. 2024 Jan 2;15(1):47.
doi: 10.1038/s41467-023-44313-9.

Serglycin secreted by late-stage nucleus pulposus cells is a biomarker of intervertebral disc degeneration

Affiliations

Serglycin secreted by late-stage nucleus pulposus cells is a biomarker of intervertebral disc degeneration

Fan Chen et al. Nat Commun. .

Abstract

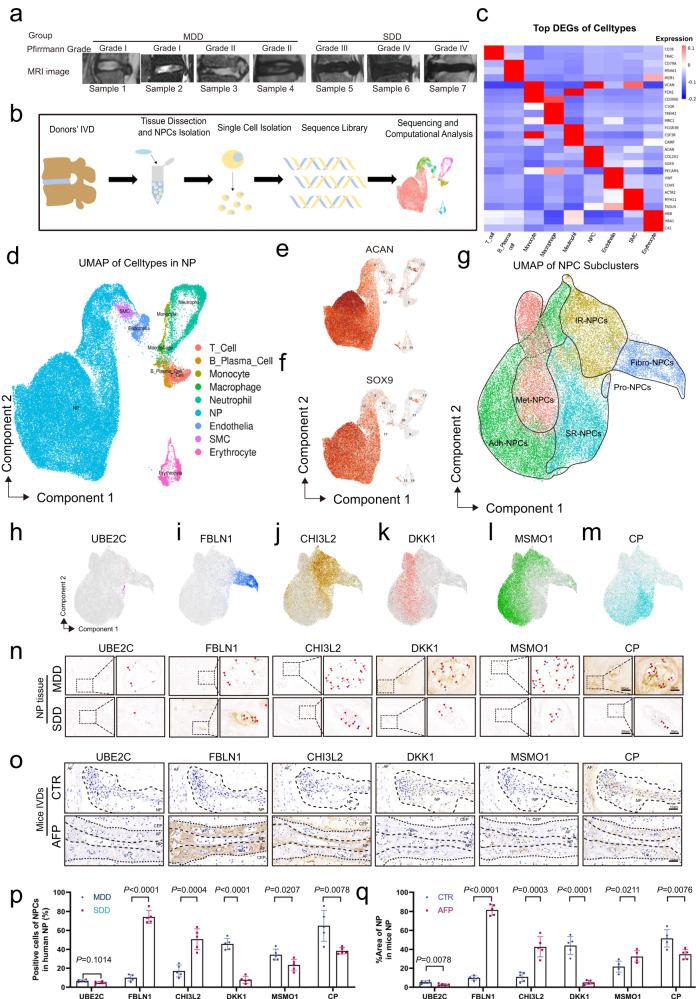
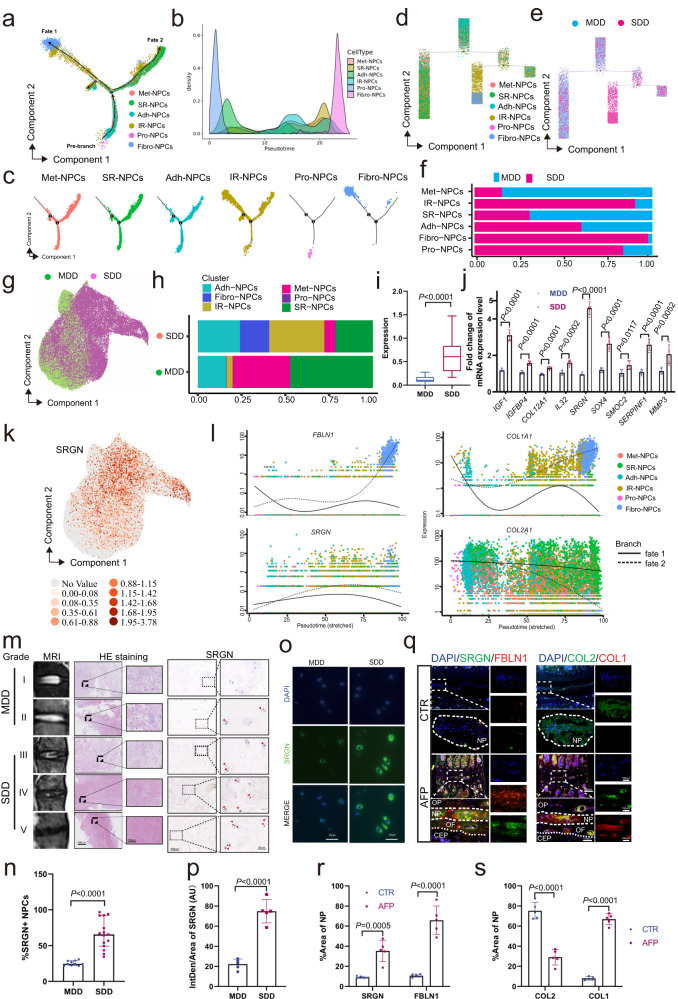
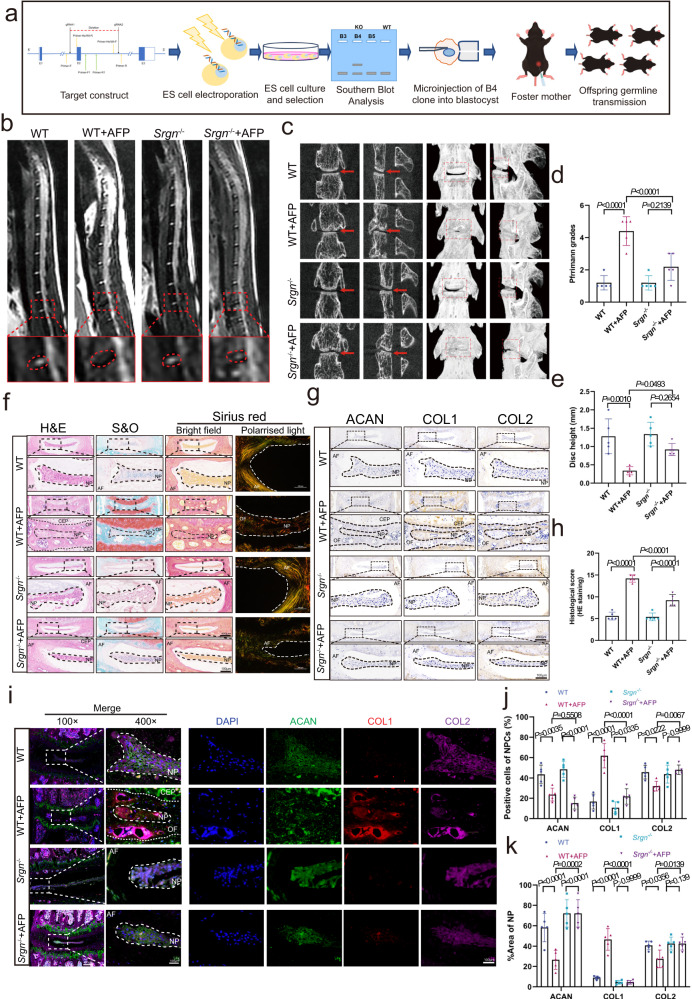
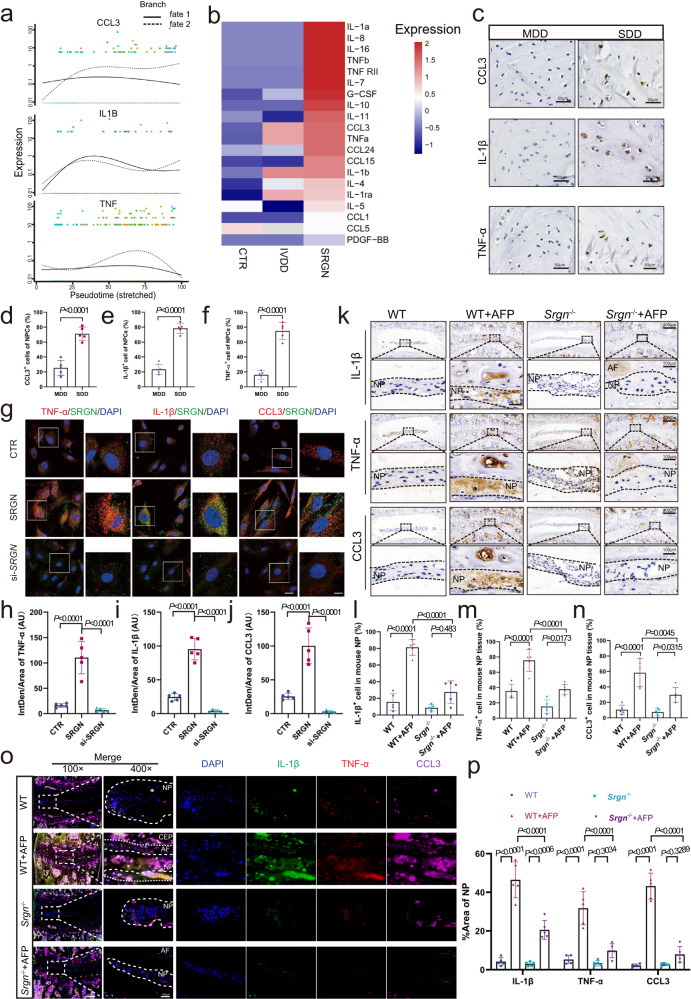
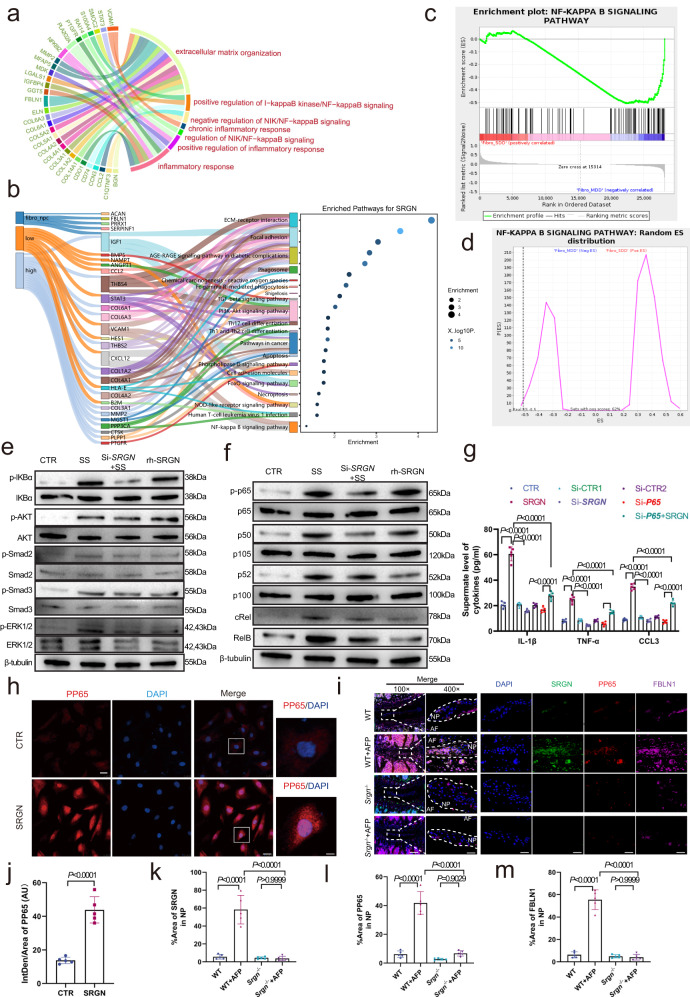
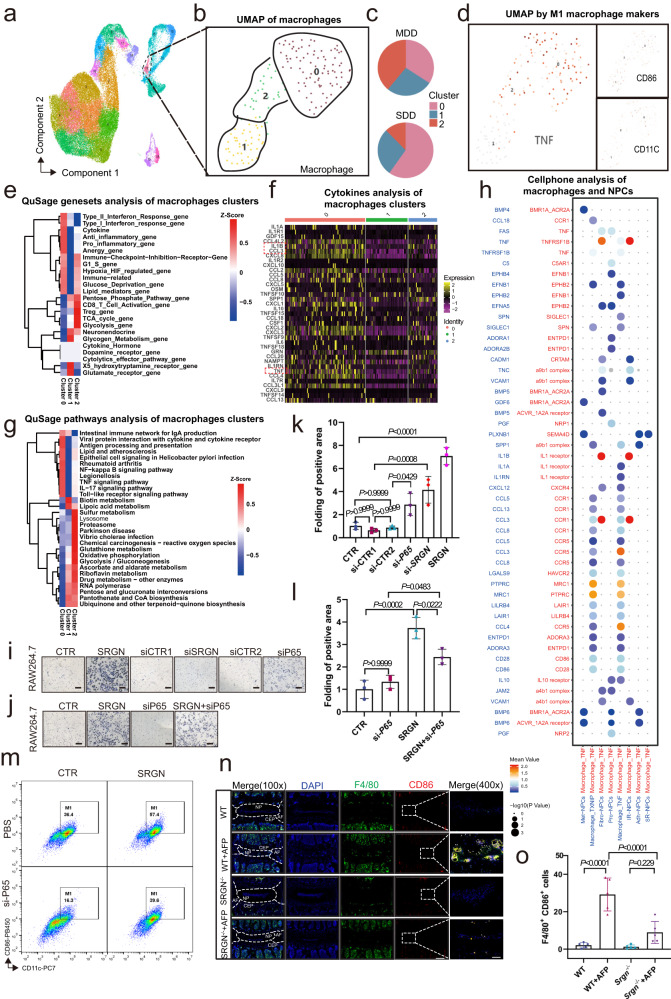
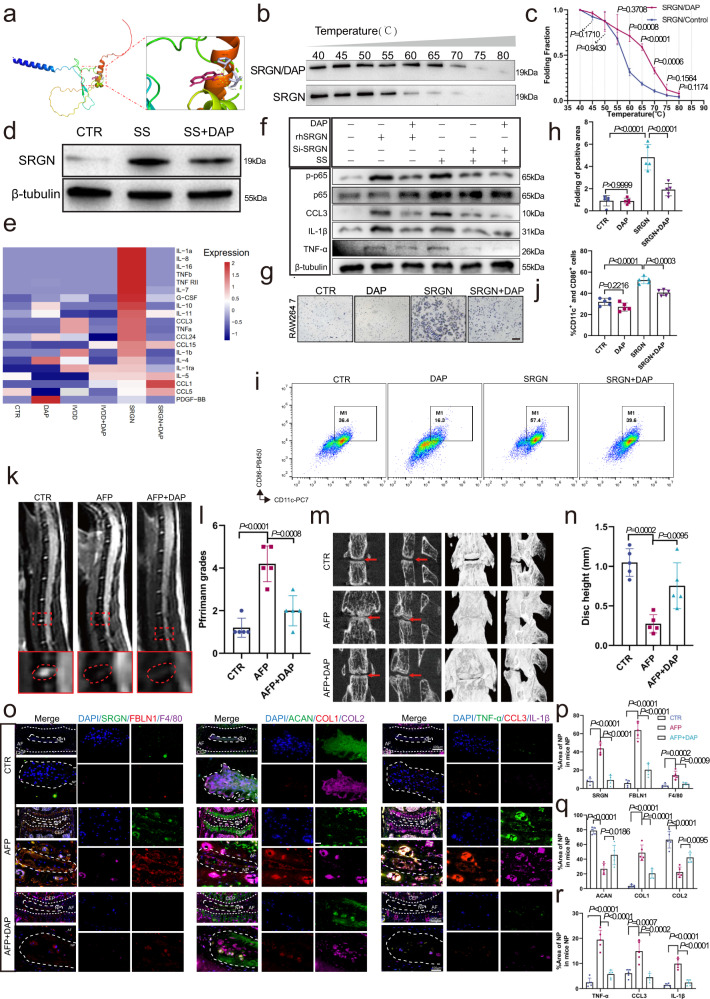
Intervertebral disc degeneration is a natural process during aging and a leading cause of lower back pain. Here, we generate a comprehensive atlas of nucleus pulposus cells using single-cell RNA-seq analysis of human nucleus pulposus tissues (three males and four females, age 41.14 ± 18.01 years). We identify fibrotic late-stage nucleus pulposus cells characterized by upregulation of serglycin expression which facilitate the local inflammatory response by promoting the infiltration of inflammatory cytokines and macrophages. Finally, we discover that daphnetin, a potential serglycin ligand, substantially mitigates the local inflammatory response by downregulating serglycin expression in an in vivo mouse model, thus alleviating intervertebral disc degeneration. Taken together, we identify late-stage nucleus pulposus cells and confirm the potential mechanism by which serglycin regulates intervertebral disc degeneration. Our findings indicate that serglycin is a latent biomarker of intervertebral disc degeneration and may contribute to development of diagnostic and therapeutic strategies.


Conflict of interest statement

The authors declare no competing interests.

Figures

Fig. 1
Fig. 1. scRNA-seq atlas of human NP tissues identifies six cell clusters.
a T2 MRI image of 7 samples of a single-cell sequence. (mild degenerative disc [MDD]: n = 4, severe degenerative disc [SDD]: n = 3). b Schematic workflow of the experimental design. Cells isolated from the NP of human IVDs were subjected to scRNA-seq. c Heatmap of marker genes of the 9 cell types. d UMAP map of the following 9 cell types: T cells, B cells, monocytes, macrophages, neutrophils, NPCs, endothelial cells, SMCs, and erythrocytes. e, f UMAP image of the NPC marker genes: ACAN and SOX9. g A single-cell atlas revealed the cell distributions and cell type distributions of NPCs. hm The differentially expressed genes in each of the 6 NPC subclusters. nq Representative IHC image with marker gene (UBE2C, FBLN1, CHI3L2, DKK1, MSMO1 and CP) expression of the 6 NPC clusters in MDD and SDD human tissue (n, p, scale bar: 200 µm left and 50 µm right panels) and in CTR and AFP group model mouse IVDs (o, q, scale bar: 200 µm up and 50 µm down panels). MDD mild degenerative discs, SDD severe degenerative discs, DEGs differentially expressed genes, UMAP uniform manifold approximation and projection, SMCs smooth muscle cells, red arrows: NPCs; CTR control groups, AFP annulus fibrosus puncture group, AF annulus fibrosus, CEP cartilaginous end plate, NP nucleus pulposus, IVD intervertebral disc. n = 5 each group. Data are presented as mean ± SD. Statistical significance was determined by two-tailed unpaired t test. Source data are provided as a Source Data file.
Fig. 2
Fig. 2. Identification of late-stage NPCs with upregulated SRGN expression.
ac Monocle pseudotime trajectory showing the progression of Met-, SR-, Adh- IR-, Pro- and Fibro-NPCs. d Tree plot of the monocle pseudotime trajectory showing the progression of 6 subclusters of NPCs. e Tree plot of the monocle pseudotime trajectory showing the progression of MDD and SDD NPCs. fh A single-cell atlas revealed the cell distributions of NPCs in the MDD and SDD groups (g), the subcluster composition of NPCs (f), and the proportions of each subcluster in MDD and SDD NPCs (h). i SRGN expression in MDD and SDD tissues by scRNA-seq analysis. j The screening RT‒qPCR results showed the expression of candidate marker genes of degenerative NPCs. k UMAP plot of SRGN expression. l Pseudotime kinetics of SRGN, FBLN1, COL1A1 and COL2A1 in each subcluster of NPCs. m, n MRI images and Pfirrmann grades of human discs and H&E and IHC staining of SRNG expression in different degenerative human NP specimens (red arrows: SRGN+ NPCs; original magnification ×100, ×400, scale bar = 200 µm, 50 µm). o, p IF staining of SRGN (green) in normal NP samples compared to degenerated NP samples (original magnification ×400, scale bar = 50 µm). qs IF staining of the late-stage NPC markers FBLN1 (red) and SRGN (green) and the degenerative indicators COL1A (red) and COL2A1 (green) in tissue samples from mouse IVDs (original magnification ×100, ×400, scale bar = 400 μm, 100 µm). MDD mild degenerative discs, SDD severe degenerative discs, CTR control group, AFP annulus fibrosus puncture group, AF annulus fibrosus, CEP cartilaginous end plate, NP nucleus pulposus. n = 5 each group. Data in 2i are presented as the median±interquartile range as appropriate, and the p value was determined by the unpaired Wilcox rank sum test. Data in (j) and (ms) are presented as the mean ± standard deviation, and p values were determined by a two-tailed unpaired t test. Source data are provided as a Source Data file.
Fig. 3
Fig. 3. Inhibition of SRGN alleviates the progression of IVDD.
a Flow diagram for establishing Srgn−/− mice. b, d MRI images and Pfirrmann grade analysis of Srgn−/− mice and IVDD models at 8 weeks after operation. c, e Micro-CT images and disc height analysis of Srgn−/− mice and IVDD models 8 weeks after operation. f, h H&E staining, Safranin-O staining, and bright field Sirius red staining with polarized light images of IVD tissue from Srgn−/− mice and IVDD models 8 weeks after operation (original magnification ×100, ×400, scale bar = 400 µm, 100 µm). g, j IHC staining for COL1, COL2, and ACAN in WT, Srgn−/−, WT plus AF, and Srgn−/− plus AF mice 8 weeks after operation (original magnification ×100, ×400, scale bar = 400 µm, 100 µm). i, k IF staining of COL1 (red), COL2 (purple), and ACAN (green) in WT plus AF and Srgn−/− plus AF mice 8 weeks after operation (original magnification ×100, ×400, scale bar = 400 µm, 100 µm). CTR control group, AFP annulus fibrosus puncture group, AF annulus fibrosus, CEP cartilaginous end plate, NP nucleus pulposus. n = 5 each group. Data are represented as mean ± standard deviation. P values were determined by one-way ANOVA with post hoc Bonferroni correction or Kruskal-Wallis H test with a Dunn’s correction as appropriate. Source data are provided as a Source Data file.
Fig. 4
Fig. 4. Late-stage NPCs with elevated SRGN aggravate the inflammatory responses.
a Pseudotime kinetics of the IL1B, TNF, and CCL3 genes. b Heatmap of significant inflammatory cytokines based on cytokine array results of different treatments of NPCs. cf IHC staining and quantitative analysis of IL-1β, TNF-α, and CCL3 in MDD and SDD human IVDs (original magnification ×400, scale bar = 50 µm). gj IF staining with quantitative analysis of IL-1β, TNF-α, and CCL3 in WT, Srgn−/−, WT plus AF, and Srgn−/− plus AF mice 8 weeks after operation (original magnification ×100, ×400, scale bar = 400 µm, 100 µm). kn IF staining of IL-1β, TNF-α, and CCL3 (red) co-stained with SRGN (green) in NPCs treated with SRGN or si-SRGN (original magnification ×400, ×1000, scale bar = 50 µm, 20 µm). o, p IF staining of IL-1β (green), TNF-α (red), and CCL3 (purple) in WT, Srgn−/−, WT plus AF, and Srgn−/− plus AF mice (original magnification ×100, ×400, scale bar = 400 µm, 100 µm). CTR control group, IVDD 1% FBS starvation-induced NPC IVDD group, SRGN recombined SRGN-treated NPC group, SRGN siRNA-transfected NPC group, Intden/Area (AU) integrated density/area (arbitrary units). n = 5 each group. Data are represented as the mean ± standard deviation. p values were determined by two-tailed unpaired t tests for two-group comparisons and one-way ANOVA with a post hoc Bonferroni correction for multiple groups. Source data are provided as a Source Data file.
Fig. 5
Fig. 5. SRGN in late-stage NPCs promotes inflammatory cytokine secretion.
ad GO and pathway analysis and GSEA of scRNA-Seq in Fibro-NPCs. e Western blotting results of four candidate inflammatory signaling pathways ((the NF-κB, AKT, Smad2/3, and ERK1/2 pathways). f Western blotting screening results of candidate subunits of the NF-κB signaling pathway. g ELISA analysis of IL-1β, TNF-α, and CCL3 in NPCs transfected with si-P65 and si-SRGN. h, j IF staining and quantitative analysis of pP65 (red) in human NPCs cultured with SRGN recombination protein (original magnification ×400, ×1000, scale bar = 50 µm, 20 µm). im IF staining of pP65 (red) costained with SRGN (green) and FBLN1 (purple) in WT, Srgn−/−, WT plus AF, and Srgn−/− plus AF mice (original magnification ×100, ×400, scale bar = 400 µm, 100 µm). n = 3 each group in (e) and (f); n = 5 each group in (gm). Data are represented as the mean ± standard deviation. p values were determined by a two-tailed unpaired t test for two-group comparisons and one-way ANOVA with a post hoc Bonferroni correction for multiple groups. Source data are provided as a Source Data file.
Fig. 6
Fig. 6. SRGN secreted by late-stage NPCs increases macrophage infiltration.
a, b UMAP plot of the following 3 clusters of macrophages: cluster 0 (TNF+), cluster 1 (VENTX+), and cluster 2 (MARCO+). c The propositions of 3 clusters in MDD and SDD IVDs. d UMAP plot of cluster 0 (TNF+) macrophages and M1 macrophages. e QuSAGE gene set analysis heatmap showing that cytokine and proinflammatory gene sets are significantly expressed. f Seurat4RDSPlot analysis shows that CCL3, IL1B, and TNF are significantly increased in cluster 0 macrophages. g QuSAGE pathways analysis showed that the proinflammatory gene set and NF-κB signaling pathway gene set were significant in cluster 0 macrophages. h CellPhone and receptor analysis of TNF+ macrophages showed that TNF+ macrophages are regulated by Fibro-NPCs with CCL3, IL-1β, and TNF-α receptors. il Migration of macrophage RAW264.7 cells after SRGN, si-SRGN or si-P65 treatment (original magnification ×100, scale bar = 200 µm). n = 3 each group. (m) Flow cytometry of CD11c+ and CD86 + RAW264.7 cells treated with SRGN and si-P65. n, o IF staining of F4/80 (green) and CD86 (red) and quantitative analysis in WT, Srgn−/−, WT plus AF, and Srgn−/− plus AF mice (original magnification ×100, ×400, scale bar = 400 µm, 100 µm). n = 3 each group in (im), n = 5 each group in (n) and (o). Data are represented as the mean ± standard deviation. p values were determined by one-way ANOVA with a post hoc Bonferroni correction or a Kruskal‒Wallis H test with Dunn’s correction. Source data are provided as a Source Data file.
Fig. 7
Fig. 7. DAP attenuates the IVD local inflammatory response to alleviate IVDD.
a Ligand interaction diagram of the top-scoring molecular docking complexes of the DAP and SRGN proteins (RMSD = 0.406; estimated free energy of binding = −15.313 kJ/mol). b CETSA of DAP and protein. c Principal criteria for evaluating the significance of protein stabilization in the melt curve. d Western blotting analysis of SRGN expression in the starvation-induced IVDD group and the DAP treatment group. e Heatmap of significant inflammatory cytokines based on cytokine array results of NPCs with different treatments. f Western blotting analysis of p-P65, CCL3, IL-1β, and TNF-α expression with different treatments. g, h Migration of RAW264.7 macrophages after si-SRGN or si-P65 treatment (original magnification ×100, scale bar = 200 µm). i, j Flow cytometry of CD11c+ and CD86 + RAW264.7 cells treated with SRGN and DAP. k, l MRI images and Pfirrmann grade analysis of control, AF, and AF plus DAP mice 8 weeks after operation. m, n Micro-CT images and disc height analysis of control, AF, and AF plus DAP mice 8 weeks after operation. or IF staining of COL1A1, COL2A1, ACAN, IL-1β, TNF-α, CCL3, and F4/80 in AF and AF plus DAP mice 8 weeks after operation (original magnification ×100, ×400, scale bar = 400 µm, 100 µm). CTR control group, SS serum starvation; n = 3 each group in (bd) and (f), n = 5 each group in (gr). Data are represented as the mean ± standard deviation. p values were determined by one-way ANOVA with a post hoc Bonferroni correction. Source data are provided as a Source Data file.

Similar articles

Cited by

References

    1. Chou R. Low back pain. Ann. Intern. Med. 2021;174:ITC113–ITC128. doi: 10.7326/AITC202108170. - DOI - PubMed
    1. Knezevic NN, Candido KD, Vlaeyen JWS, Van Zundert J, Cohen SP. Low back pain. Lancet. 2021;398:78–92. doi: 10.1016/S0140-6736(21)00733-9. - DOI - PubMed
    1. Risbud MV, Shapiro IM. Role of cytokines in intervertebral disc degeneration: pain and disc content. Nat. Rev. Rheumatol. 2014;10:44–56. doi: 10.1038/nrrheum.2013.160. - DOI - PMC - PubMed
    1. Lyu FJ, et al. Painful intervertebral disc degeneration and inflammation: from laboratory evidence to clinical interventions. Bone Res. 2021;9:7. doi: 10.1038/s41413-020-00125-x. - DOI - PMC - PubMed
    1. Roberts S, Evans H, Trivedi J, Menage J. Histology and pathology of the human intervertebral disc. J. Bone Jt. Surg. Am. 2006;88:10–14. - PubMed

Publication types