. 2024 Jan 2;15(1):167.
doi: 10.1038/s41467-023-43871-2.

Derivation of human primordial germ cell-like cells in an embryonic-like culture

Affiliations

Derivation of human primordial germ cell-like cells in an embryonic-like culture

Sajedeh Nasr Esfahani et al. Nat Commun. .

Abstract

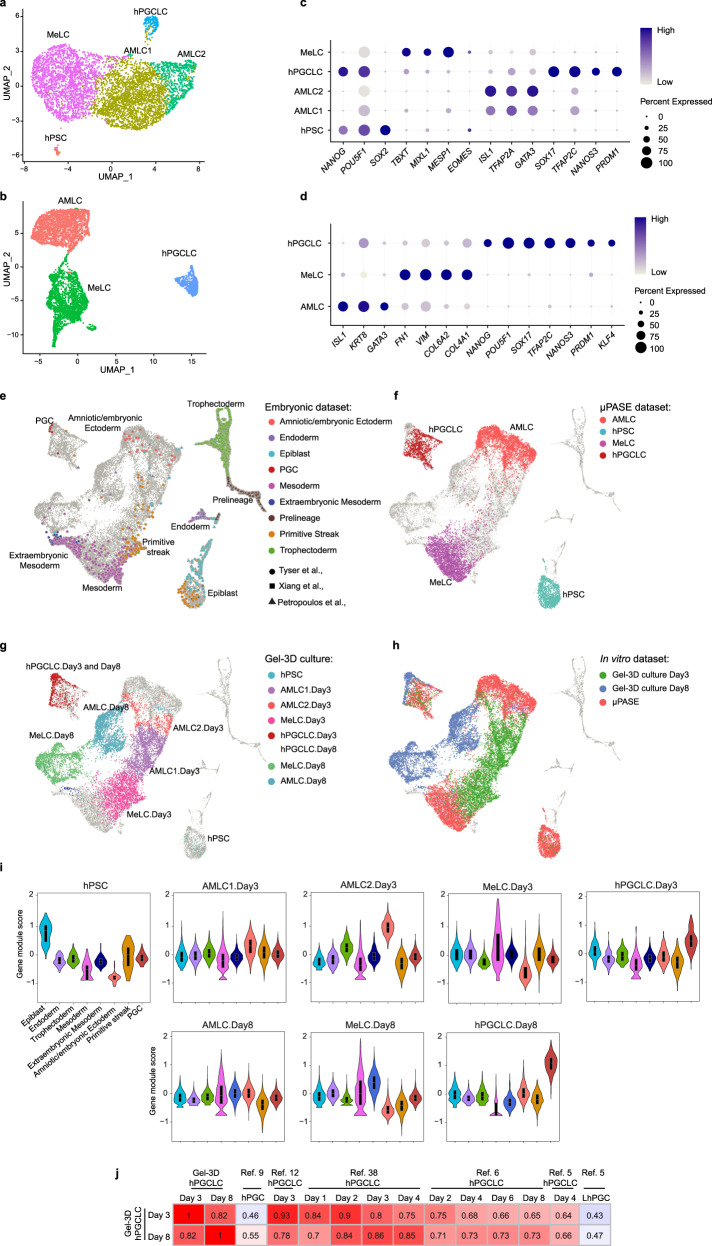
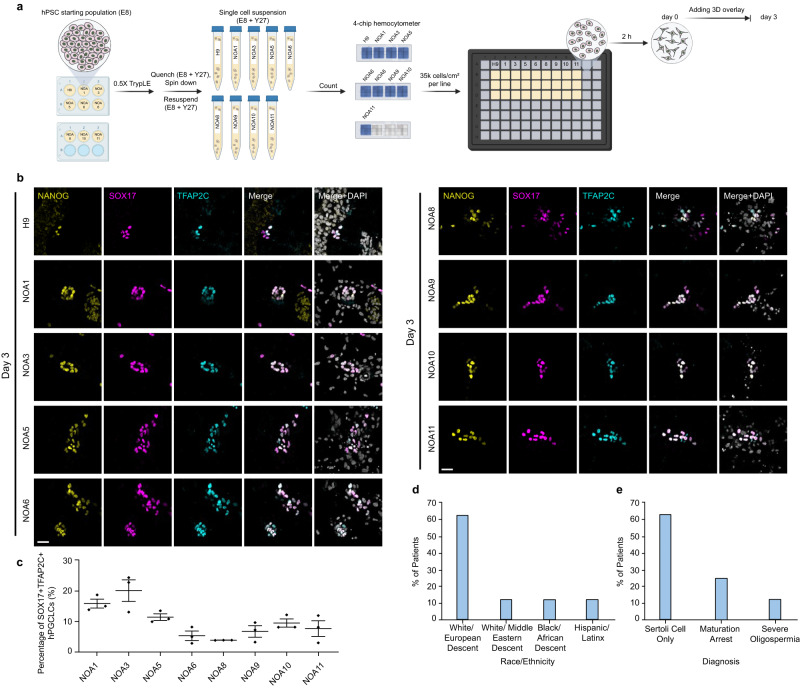
Primordial germ cells (PGCs) are the embryonic precursors of sperm and eggs. They transmit genetic and epigenetic information across generations. Given the prominent role of germline defects in diseases such as infertility, detailed understanding of human PGC (hPGC) development has important implications in reproductive medicine and studying human evolution. Yet, hPGC specification remains an elusive process. Here, we report the induction of hPGC-like cells (hPGCLCs) in a bioengineered human pluripotent stem cell (hPSC) culture that mimics peri-implantation human development. In this culture, amniotic ectoderm-like cells (AMLCs), derived from hPSCs, induce hPGCLC specification from hPSCs through paracrine signaling downstream of ISL1. Our data further show functional roles of NODAL, WNT, and BMP signaling in hPGCLC induction. hPGCLCs are successfully derived from eight non-obstructive azoospermia (NOA) participant-derived hPSC lines using this biomimetic platform, demonstrating its promise for screening applications.


Conflict of interest statement

A patent by J. Fu, Y.Z., Y.S. and S.N.E. related to this work has been granted (US11672832B2/WO2018106997). The derivation protocol of AMLCs from hPSCs is covered in this patent. Remaining authors declare no competing interests.

Figures

Fig. 1
Fig. 1. Derivation of hPGCLCs in the Gel-3D culture.
a Schematic of PGC specification in primate embryos (Left). Peri-implantation development of the primate epiblast leads to the formation of the asymmetric embryonic sac, with PGCs emerging in the incipient amniotic ectoderm at the dorsal pole of the embryonic sac and in the gastrulating cells at the posterior end of the embryonic sac. In an in vitro, hPSC-based model of the peri-implantation epiblast development, culture parameters, including gel bed thickness, cell seeding density, 3D ECM concentration, and timing of adding 3D ECM overlay, are modulated to generate columnar epiblast-like cysts, squamous amniotic ectoderm-like cysts, or irregular cysts containing pluripotent and amniotic cells as well as hPGCLCs (Right). Scale bars, 50 µm. b Bar plot showing percentages of columnar epiblast-like cysts, squamous amniotic ectoderm-like cysts, and irregular cysts on day 5 as a function of initial cell seeding densities and gel bed thicknesses. Note that 3D ECM overlay was supplemented on day 1. c Bar plot showing percentages of columnar epiblast-like cysts, squamous amniotic ectoderm-like cysts, and irregular cysts formed on day 3 as a function of Geltrex overlay concentration and timing of adding 3D ECM overlay. The quantifications are based on the cyst structures formed in each condition. d Representative micrographs showing immunostaining for EZRIN, NANOG, and SOX17; TFAP2C, NANOG, and SOX17; OCT4, BLIMP1, and SOX17; TFAP2A, TBXT, and SOX17 on day 3 as indicated. e Representative micrographs showing immunostaining for TFAP2C, NANOG, and SOX17; OCT4, BLIMP1, and SOX17; KLF4, NANOG, and TFCP2L1; TFAP2A, VIM, and SOX17 on day 8 as indicated. f Enumeration of TFAP2C+SOX17+ hPGCLCs using flow cytometry at indicated time points. g Plot showing percentages of TFAP2C+SOX17+ hPGCLCs at indicated time points. In (b, c, g), data represent the mean ± s.e.m. In (b, c, f, g), n = 3 independent experiments. In (d, e), experiments were repeated >10 times with similar results. Nuclei were counterstained with DAPI. Boxed images show magnified views of selected areas. Scale bars, 200 µm (main panel) and 30 µm (inset). Source data are provided as a Source Data file.
Fig. 2
Fig. 2. Single-cell transcriptomic analysis.
a UMAP plot of scRNA-seq data obtained on day 3, revealing five distinct, color-coded cell populations: hPSC (n = 56), AMLC1 (n = 2254), AMLC2 (n = 618), hPGCLC (n = 190), and MeLC (n = 2087). b UMAP plot of scRNA-seq data obtained on day 8, revealing three distinct, color-coded cell populations: AMLC (n = 2262), hPGCLC (n = 554), and MeLC (n = 2245). c Dot plot showing expression of key marker genes in the cell clusters in (a) as indicated. d Dot plot showing expression of key marker genes in the cell clusters in (b) as indicated. eh UMAP plot of an integrated scRNA-seq dataset from pre-implantation human embryos, in vitro cultured human embryos, in vivo human gastrula, microfluidic PASEs, and day 3 and day 8 Gel-3D cultures. In (e), human embryo data are both shape- and color-coded according to the sources and original cell annotations, and microfluidic PASE and Gel-3D data are shown in gray. In (f), microfluidic PASE data are color-coded according to original cell annotations. In (g), data from day 3 and day 8 Gel-3D cultures are color-coded according to cell annotations in (a, b). i Gene-module score plots for hPSC, MeLC, AMLC1, AMLC2, and hPGCLC clusters identified in the Gel-3D culture. Gene-module scores were calculated based on the top 15 up-regulated genes associated with the epiblast, endoderm, trophectoderm, mesoderm, extraembryonic mesoderm (or ExE_Mesoderm), amniotic / embryonic ectoderm, primitive streak, and PGC from human embryos, including pre-implantation human embryos, in vitro cultured human embryos, and in vivo human gastrula. j Heat map of correlation coefficients among hPGCLCs derived in the Gel-3D culture on day 3 (hPGCLC.Day 3) and on day 8 (hPGCLC.Day8), hPGCs from in vivo human gastrula, hPGCLCs from microfluidic PASEs, hPGCLCs from different in vitro protocols,,, and gonadal hPGCs (LhPGC). Correlation coefficients were calculated based on ontogenic cynomolgus monkey PGC (CyPGC) genes (447 in common out of 544). In (i), box: 25–75%, bar-in-box: median, and whiskers: 1% and 99%.
Fig. 3
Fig. 3. Amniotic ectoderm-like cells induce hPGCLC specification in the Gel-3D culture involving ISL1.
a Micrographs showing immunostaining for ISL1, NANOG, and SOX17 at indicated time points. b Dot plot showing expression of selected signaling factors in AMLCs and hPSCs as indicated. c Co-culture assays of AMLCs and hPSCs. Micrographs show immunostaining on day 2 (AMLCs) for TFAP2A, NANOG, and on day 4 (co-culture) for NANOG and SOX17, and for hPSC clusters without AMLCs as a control for TFAP2A, NANOG, and SOX17 as indicated. d Plot showing percentages of clusters containing NANOG+SOX17+ hPGCLCs in the co-culture system. e Micrographs showing immunostaining of the Gel-3D culture with ISL1-KO and wild-type hPSC lines. Cells were stained for TFAP2C, NANOG, and SOX17 on day 3 and day 8 as indicated. f Plot showing percentages of TFAP2C+SOX17+ hPGCLCs at indicated conditions. g Co-culture assays of ISL1-KO AMLCs and hPSCs. Micrographs show immunostaining for TFAP2A, NANOG, and SOX17 on day 4. h RT-PCR analyses showing expression of BMP2, BMP4, TGF-β, and NODAL in the AMLCs generated in 2D on day 2 from wild-type and ISL1-KO hPSCs as indicated. i Micrographs showing immunostaining of the Gel-3D culture with ISL1-KO hPSCs supplemented with BMP4 (25 ng ml−1), WNT3A (250 ng ml−1), or the combination of BMP4 and WNT3A as indicated. Cells were stained for TFAP2C, NANOG, and SOX17 on day 3. j Plot showing percentages of TFAP2C+SOX17+ hPGCLCs at indicated conditions. In (a, c, e, g, i), experiments were repeated three times with similar results. Nuclei were counterstained with DAPI. Boxed images show magnified views of selected areas. Scale bars, 200 µm (main panels) and 30 µm (insets). In (d, f, h, j), n = 3 independent experiments, and data represent the mean ± s.e.m. p values were calculated using unpaired, two-sided Student’s t test. Source data are provided as a Source Data file.
Fig. 4
Fig. 4. Gel-3D culture for screening research participants diagnosed with NOA.
a Schematic of screening protocol developed to evaluate hPGCLC induction from eight non-obstructive azoospermia (NOA) research participant-derived hPSC lines (NOA1,3,5,6,8–11). The hPSC line H9 was used as a positive control. Schematic was made with BioRender.com. b Micrographs showing immunostaining for NANOG, SOX17, and TFAP2C on day 3 for different hiPSC lines, as indicated. c Plot showing percentages of TFAP2C+SOX17+ hPGCLCs induced from eight NOA research participant-derived hPSC lines as indicated in the Gel-3D culture system on day 3. d, e Bar plots showing races and ethnicities of research subjects and their diagnoses. In (b), experiments were repeated twice with similar results. Nuclei were counterstained with DAPI. Scale bars, 30 µm. In (c), n = 3 independent experiments, and data represent the mean ± s.e.m. Source data are provided as a Source Data file.

References

    1. Chen D, Gell JJ, Tao Y, Sosa E, Clark AT. Modeling human infertility with pluripotent stem cells. Stem Cell Res. 2017;21:187–192. doi: 10.1016/j.scr.2017.04.005. - DOI - PMC - PubMed
    1. Hayashi K, de Sousa Lopes SMC, Surani MA. Germ cell specification in mice. Science. 2007;316:394–396. doi: 10.1126/science.1137545. - DOI - PubMed
    1. Lesch BJ, Page DC. Genetics of germ cell development. Nat. Rev. Genet. 2012;13:781. doi: 10.1038/nrg3294. - DOI - PubMed
    1. Tang WW, Kobayashi T, Irie N, Dietmann S, Surani MA. Specification and epigenetic programming of the human germ line. Nat. Rev. Genet. 2016;17:585. doi: 10.1038/nrg.2016.88. - DOI - PubMed
    1. Irie N, et al. SOX17 is a critical specifier of human primordial germ cell fate. Cell. 2015;160:253–268. doi: 10.1016/j.cell.2014.12.013. - DOI - PMC - PubMed

Publication types