. 2024 Jan 2;15(1):190.
doi: 10.1038/s41467-023-44430-5.

Inferring language dispersal patterns with velocity field estimation

Affiliations

Inferring language dispersal patterns with velocity field estimation

Sizhe Yang et al. Nat Commun. .

Abstract

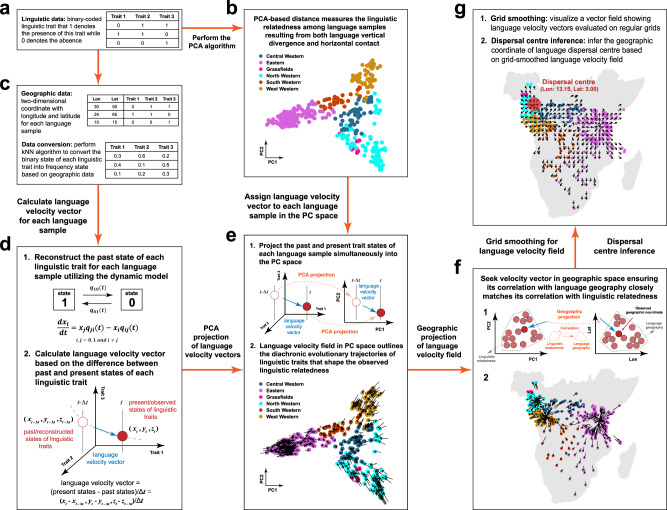
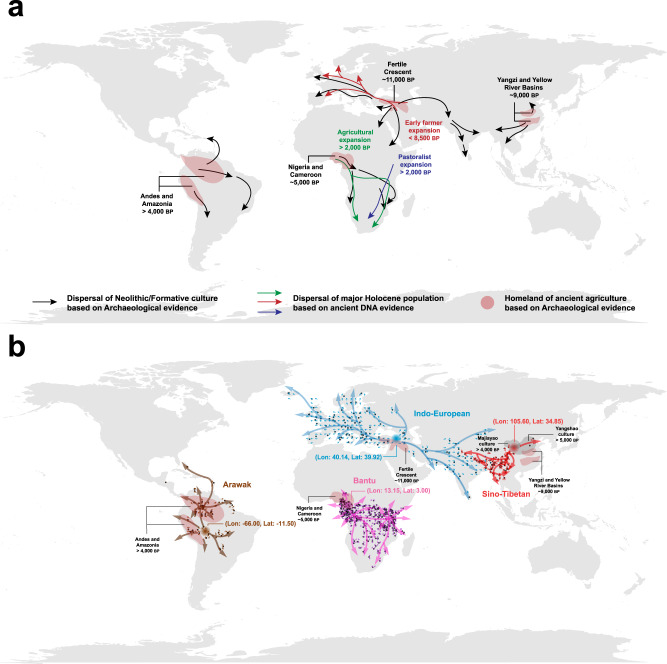
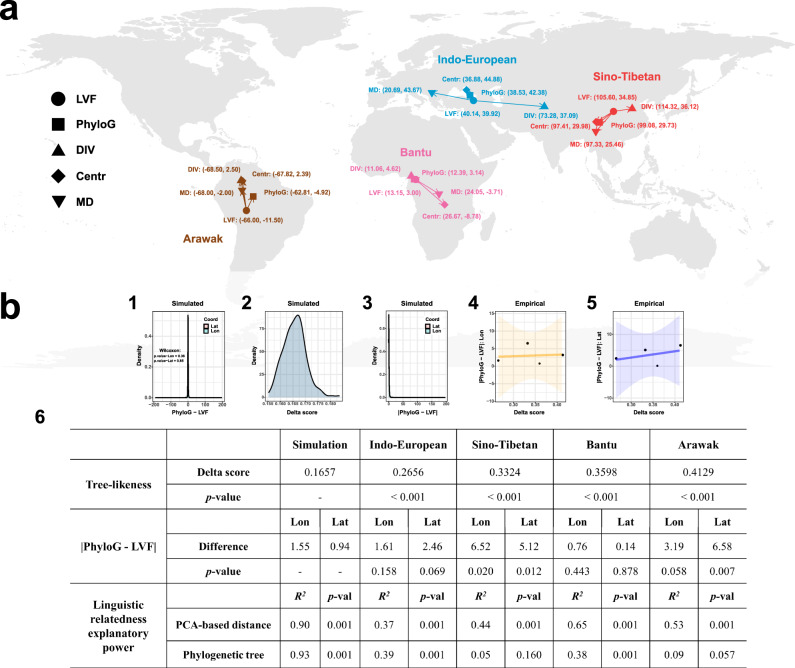
Reconstructing the spatial evolution of languages can deepen our understanding of the demic diffusion and cultural spread. However, the phylogeographic approach that is frequently used to infer language dispersal patterns has limitations, primarily because the phylogenetic tree cannot fully explain the language evolution induced by the horizontal contact among languages, such as borrowing and areal diffusion. Here, we introduce the language velocity field estimation, which does not rely on the phylogenetic tree, to infer language dispersal trajectories and centre. Its effectiveness and robustness are verified through both simulated and empirical validations. Using language velocity field estimation, we infer the dispersal patterns of four agricultural language families and groups, encompassing approximately 700 language samples. Our results show that the dispersal trajectories of these languages are primarily compatible with population movement routes inferred from ancient DNA and archaeological materials, and their dispersal centres are geographically proximate to ancient homelands of agricultural or Neolithic cultures. Our findings highlight that the agricultural languages dispersed alongside the demic diffusions and cultural spreads during the past 10,000 years. We expect that language velocity field estimation could aid the spatial analysis of language evolution and further branch out into the studies of demographic and cultural dynamics.


Conflict of interest statement

The authors declare no competing interests.

Figures

Fig. 1
Fig. 1. Schematic overview of the LVF for inferring the dispersal trajectories and centre of languages.
The computational procedure of the LVF comprises two major steps. Subfigures (a) to (e) illustrate the first step, which is to estimate a velocity field within the PC space to outline the diachronic evolutionary trajectories of linguistic traits that shape the observed linguistic relatedness. Subfigures (f) to (g) illustrate the second step, which is to project the velocity field from PC space into geographic space. Within the velocity field in geographic space, the directions of the velocity vectors compose a set of continuously changing trajectories that delineate from where the language samples diffused to their current locations. These procedures are exemplified using the Bantu language family. Comprehensive insights into the underlying principles and computational steps can be found in the Methods, as well as Supplementary Notes and Supplementary Methods. The grey base world map used in Subfigures (f) to (g) is generated using the map function of the maps package in R (4.3.1). The Source Data and Codes for generating Fig. 1 are available.
Fig. 2
Fig. 2. The homelands and dispersals of ancient agriculture, Neolithic cultures, Holocene populations, and language families and groups.
a The homelands of ancient agriculture and the dispersal routes of Neolithic/Formative cultures and Holocene populations proposed by previous studies based on archaeological and ancient DNA evidence. The pale red polygon denotes the known ancient agricultural homeland. The black arrow signifies the dispersal trajectory of the Neolithic/Formative culture. The coloured arrow represents the dispersal trajectory of the major Holocene population. b The velocity fields of four language families and groups. The coloured dot denotes the geographical position of each observed language sample. The coloured small arrow represents the velocity vector which has been grid-smoothed and normalised for better visualisation. The larger coloured schematic arrow, summarised based on the velocity vectors, renders the general language dispersal trajectory. The pale grey polygon signifies the known geographic range of the Neolithic culture. The coloured concentric circle represents the language dispersal centre inferred by the LVF. The grey base world map is generated using the map function of the maps package in R (4.3.1). The Source Data and Codes for generating Fig. 2 are available.
Fig. 3
Fig. 3. Comparison between LVF and other spatial reconstruction approaches.
a The geographic coordinates (Lon, Lat) of dispersal centres for each case inferred by five approaches: language velocity field estimation (LVF), phylogeographic approach (PhyloG), diversity approach (DIV), centroid approach (Centr), and minimal distance approach (MD). (b1) Density plot displaying differences in longitude and latitude between the dispersal centres inferred by LVF and PhyloG using 1000 simulated datasets. p value is calculated by the two-sided Wilcoxon rank-sum test. (b2) Density plot showing the delta score distribution of simulated language samples (one-sided 95% CI = [0.1553, 0.1727]), estimated from 200 bootstrap resamplings. (b3) Density plot illustrating absolute differences in longitude and latitude between dispersal centres inferred by LVF and PhyloG using 1000 simulated datasets (Lat: mean = 0.94, one-sided 95% CI = [4 × 10-4, 2.82]; Lon: mean = 1.55, one-sided 95% CI = [5 × 10-5, 3.55]). (b4) Linear relation between the delta score and the absolute difference between dispersal centres in longitude estimated from LVF and PhyloG. The orange ribbon denotes the 95% CI. (b5) Linear relation between the delta score and the absolute difference between dispersal centres in latitude estimated from LVF and PhyloG. The blue ribbon denotes the 95% CI. (b6) Table displaying statistical test results for three indexes: delta score, absolute estimated difference between LVF and PhyloG, and linguistic relatedness explanatory power of PCA-based distance and phylogenetic tree. For the delta score, the p value is calculated using the one-sided bootstrap test. For the absolute estimated difference, the p value is calculated using the one-sided Monto-Carlo Simulation test. For linguistic relatedness explanatory power of PCA-based distance or phylogenetic tree, the p value is calculated using the Mantel test. For all tests, statistical significance is indicated by p value < 0.05. The grey base world map used in Subfigure (a) is generated using the map function of the maps package in R (4.3.1). The Source Data and Codes for generating Fig.3 are available.

Similar articles

References

    1. Liu Y, Mao X, Krause J, Fu Q. Insights into human history from the first decade of ancient human genomics. Science. 2021;373:1479–1484. doi: 10.1126/science.abi8202. - DOI - PubMed
    1. Skoglund P, Mathieson I. Ancient genomics of modern humans: the first decade. Annu. Rev. Genomics Hum. Genet. 2018;19:381–404. doi: 10.1146/annurev-genom-083117-021749. - DOI - PubMed
    1. Diamond J, Bellwood P. Farmers and their languages: the first expansions. Science. 2003;300:597–603. doi: 10.1126/science.1078208. - DOI - PubMed
    1. Diamond J. Evolution, consequences and future of plant and animal domestication. Nature. 2002;418:700–707. doi: 10.1038/nature01019. - DOI - PubMed
    1. Bellwood, P. First farmers: the origins of agricultural societies. (John Wiley & Sons, 2023).

Publication types