. 2024 Jan 2;15(1):136.
doi: 10.1038/s41467-023-44506-2.

A distant global control region is essential for normal expression of anterior HOXA genes during mouse and human craniofacial development

Affiliations

A distant global control region is essential for normal expression of anterior HOXA genes during mouse and human craniofacial development

Andrea Wilderman et al. Nat Commun. .

Abstract

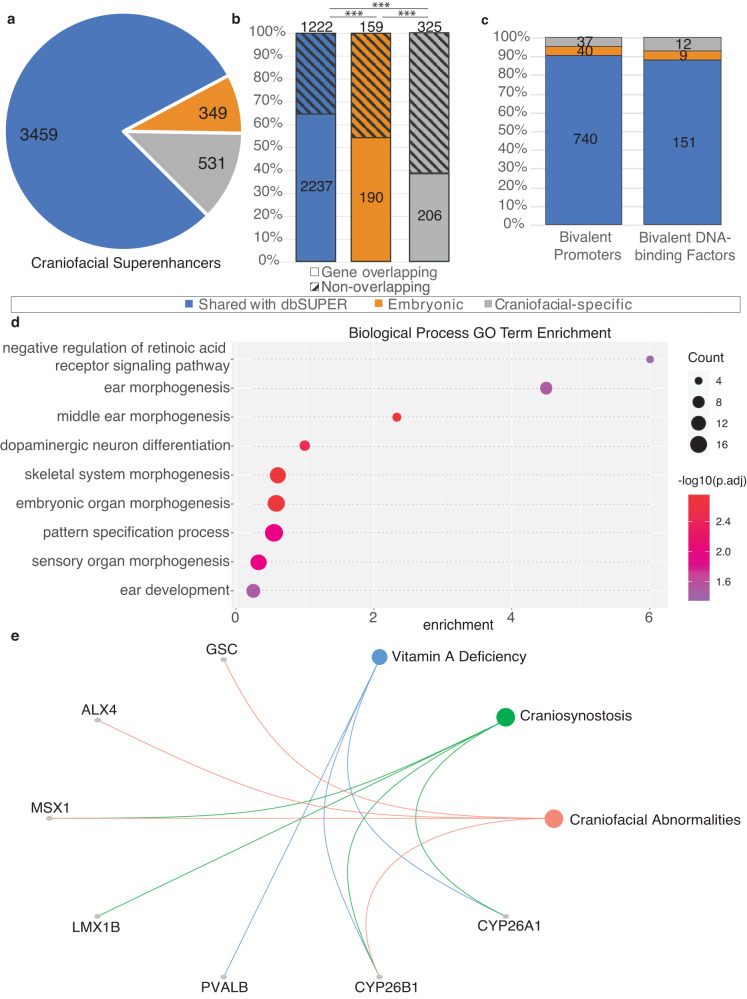
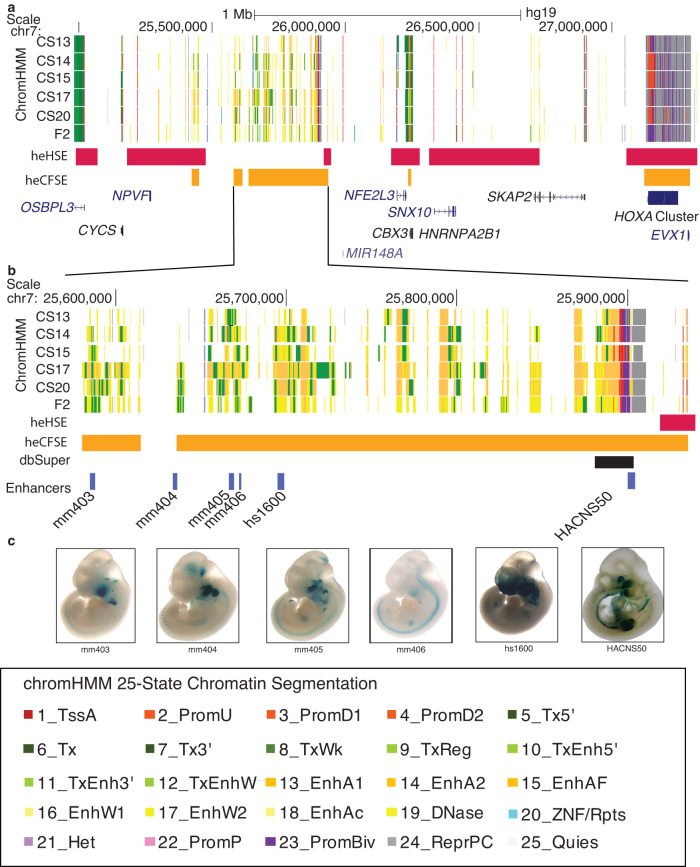
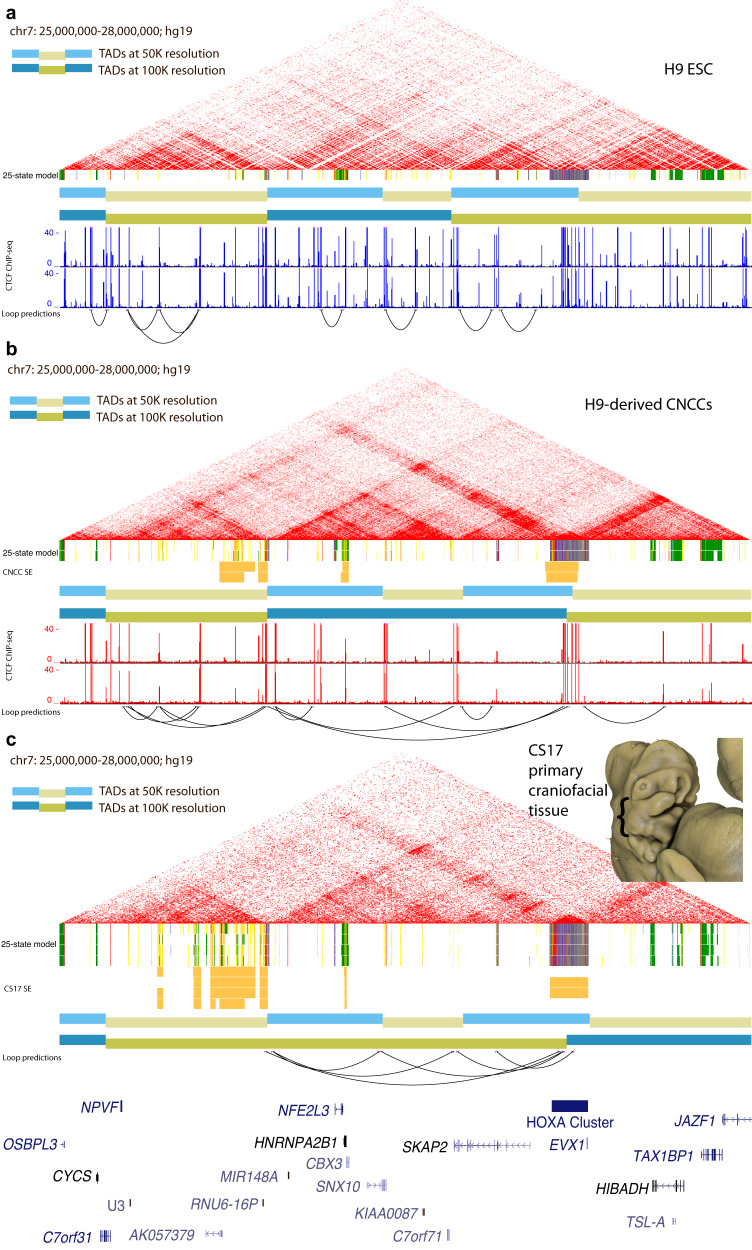
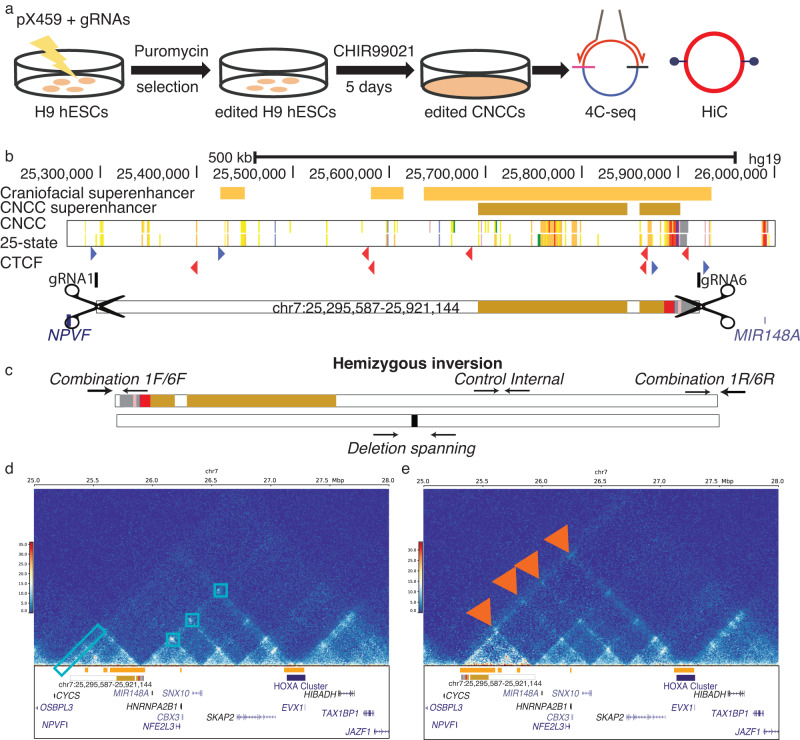
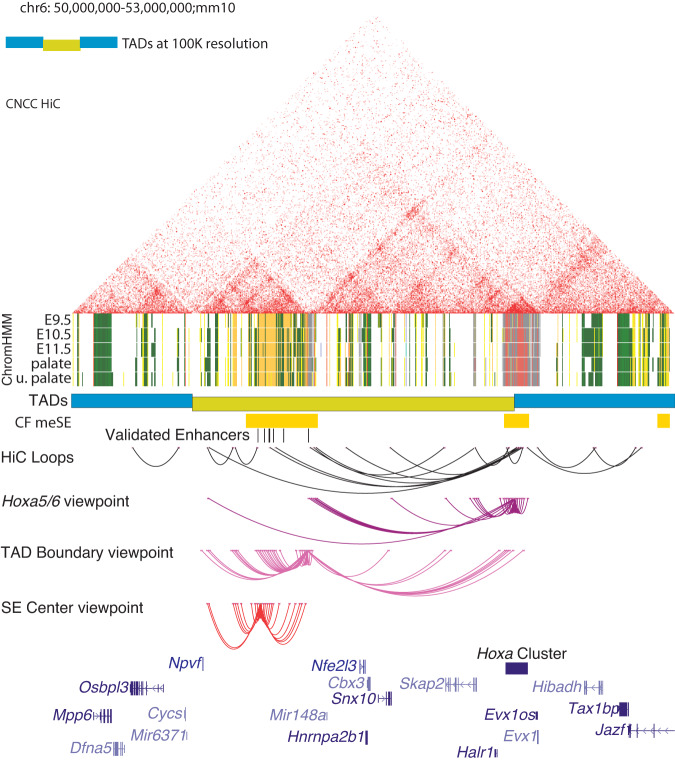
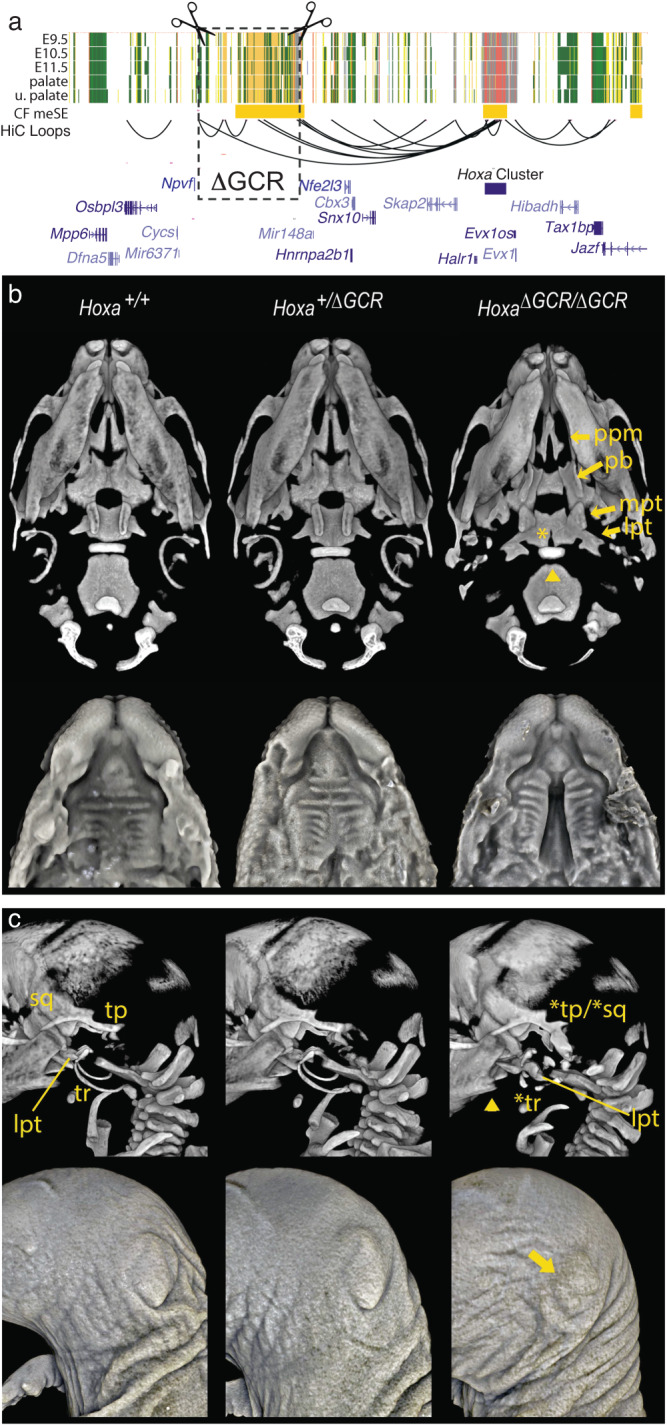
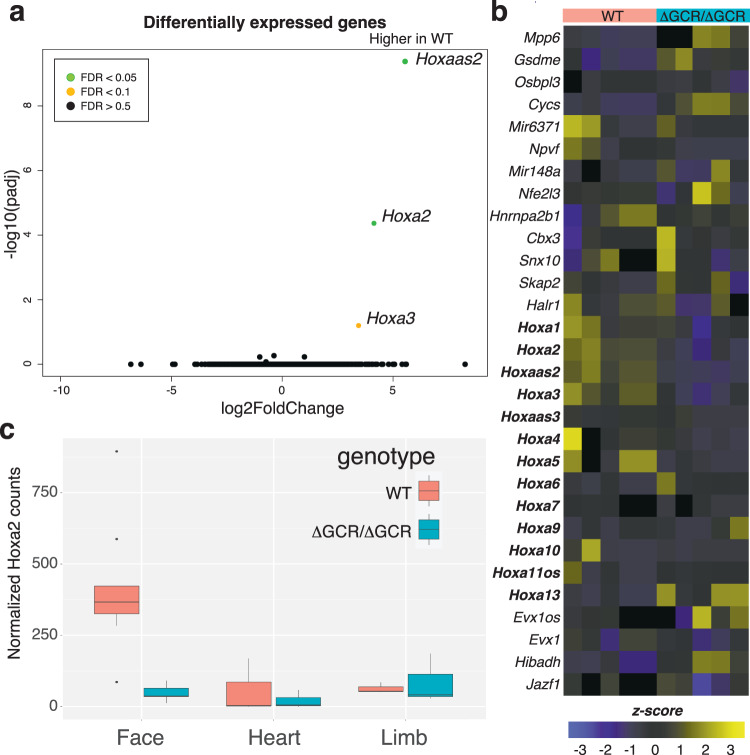
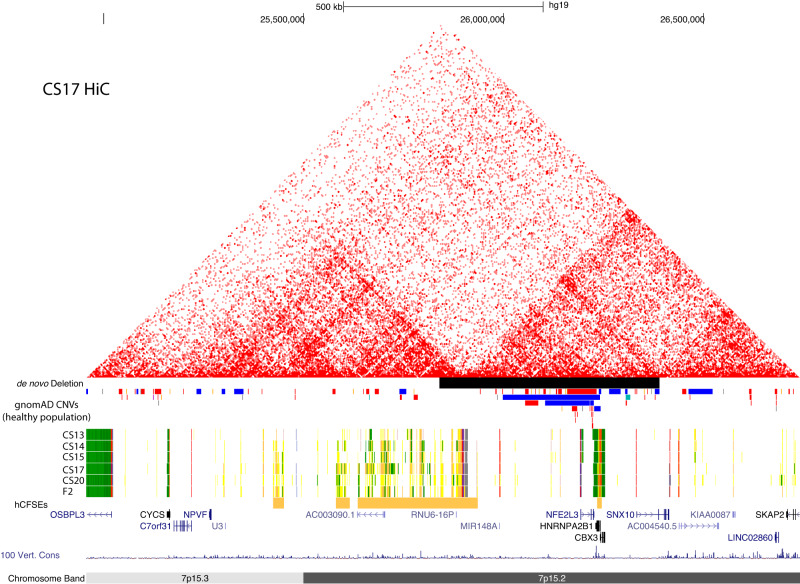
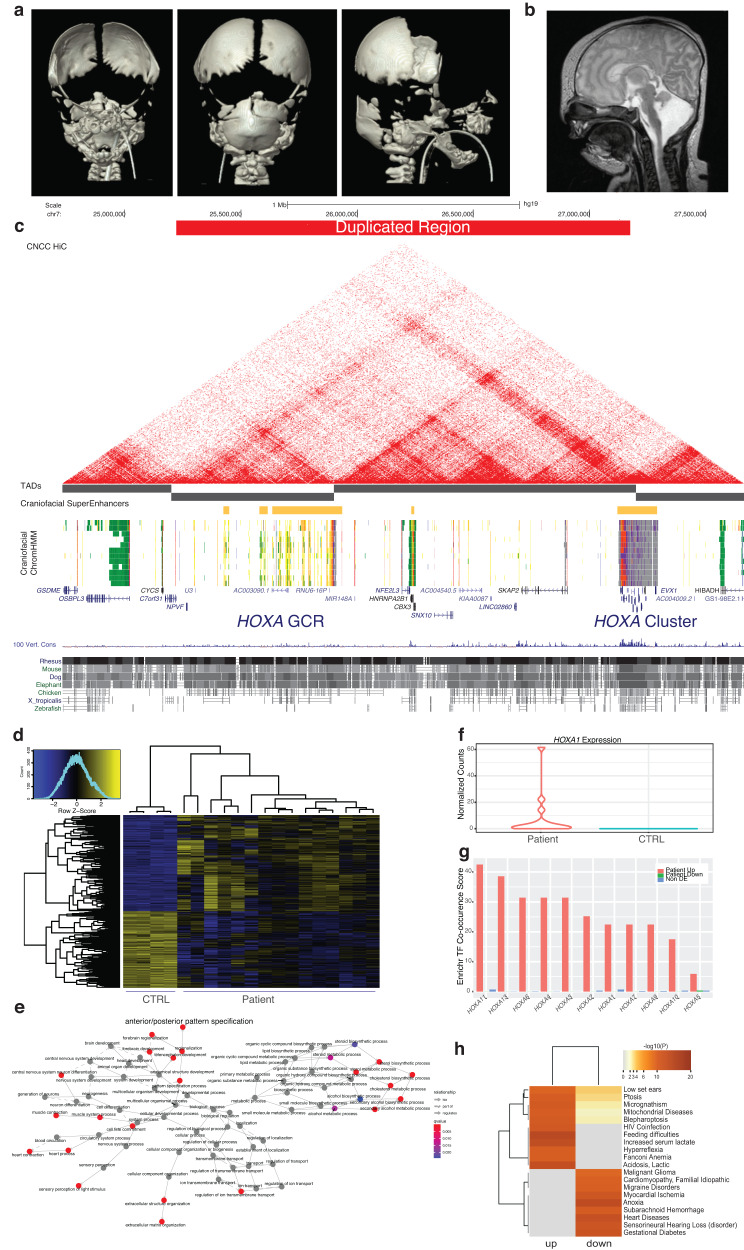
Craniofacial abnormalities account for approximately one third of birth defects. The regulatory programs that build the face require precisely controlled spatiotemporal gene expression, achieved through tissue-specific enhancers. Clusters of coactivated enhancers and their target genes, known as superenhancers, are important in determining cell identity but have been largely unexplored in development. In this study we identified superenhancer regions unique to human embryonic craniofacial tissue. To demonstrate the importance of such regions in craniofacial development and disease, we focused on an ~600 kb noncoding region located between NPVF and NFE2L3. We identified long range interactions with this region in both human and mouse embryonic craniofacial tissue with the anterior portion of the HOXA gene cluster. Mice lacking this superenhancer exhibit perinatal lethality, and present with highly penetrant skull defects and orofacial clefts phenocopying Hoxa2-/- mice. Moreover, we identified two cases of de novo copy number changes of the superenhancer in humans both with severe craniofacial abnormalities. This evidence suggests we have identified a critical noncoding locus control region that specifically regulates anterior HOXA genes and copy number changes are pathogenic in human patients.


Conflict of interest statement

DEM holds stock options in MyOme. DEM is on a scientific advisory board at ONT, is engaged in a research agreement with ONT, and they have paid for him to travel to speak on their behalf.

Figures

Fig. 1
Fig. 1. Characteristics of human embryonic craniofacial superenhancers relate to specialized developmental functions.
a Sharing of superenhancer regions (see Methods) with tissues and cell types within dbSUPER (blue), or only with human embryonic heart (termed Embryonic enhancers, orange). Those unique to the human embryonic craniofacial tissue are shown in gray. b Percentages of shared or unique superenhancer regions which encompass a TSS (Gene-overlapping) or not. The Pearson’s chi-squared test with Yates’ continuity correction (two-tailed) was used to compare the proportions of gene overlapping and nonoverlapping superenhancers, ***p < 0.001. (dbSuper vs. Embryonic p = 1.818 × 10⁻⁴, Embryonic vs. Craniofacial-specific p = 6.443 × 10⁻⁶, dbSuper vs. Craniofacial specific p-value < 2.2 × 10⁻¹⁶). c Summary of TSS encompassed in each category of superenhancer regions that correlate with genes previously identified to have bivalent promoters, and a further subset of transcription factors with bivalent promoters. d Gene Ontology terms enriched in genes for which the TSS is encompassed by superenhancer regions unique to craniofacial tissue. Dot size is based on -log10 transformed Benjamini-Hochberg adjusted hypergeometric p-values calculated by clusterProfiler. e Disease Ontology relationships with genes for which the TSS encompassed by superenhancer regions unique to craniofacial tissue are among the previously determined genes with bivalent promoters.
Fig. 2
Fig. 2. Location and functional characterization of a putative novel craniofacial superenhancer.
a Region of human chromosome 7 containing a large 500 kb window lacking any annotated protein-coding genes with extensive enrichment of activated enhancer (yellow and orange) and transcriptionally active (green) segment annotations in human craniofacial tissue. CS (Carnegie stage). Locations of human embryonic craniofacial superenhancers (heCFSE) are represented by orange bars, human embryonic heart superenhancers (heHSE) by dark pink bars and superenhancers found in the dbSuper database by black bars. b Enlargement of two superenhancers with multiple validated craniofacial enhancer segments. Enhancers with mm or hs designations were identified through the Vista Enhancer Browser (c). In this study we tested and validated the craniofacial enhancer activity of HACNS50, located within the bivalent chromatin state at the right of the enlargement.
Fig. 3
Fig. 3. Chromatin Architecture in Primary Human Embryonic Craniofacial Tissue Suggests Interaction between HOXA Gene Cluster and Gene Desert Superenhancer on Chromosome 7.
HiC of H9 human embryonic stem cells (hESCs) (a), cranial neural crest cells (CNCCs) derived from H9 hESCs (b) and CS17 primary human embryonic craniofacial tissue (c). TADs called at two different resolutions, 50 kb (light blue/light yellow) and 100 kb (blue/dark yellow). Superenhancers (for CNCCs and CS17 tissue) determined by the ROSE algorithm. CTCF ChIP-seq data from (ref. ; GSE145327). ChromHMM chromatin states from 25-state model for H9 and H9-derived CNCCs are shown below their respective HiC interaction plots and chromatin states for CS13-CS20 and F2 human craniofacial tissue are shown below the HiC interaction plot for CS17 primary craniofacial tissue. Individual enhancer segments are yellow and orange. Inset image: 3D rendered Carnegie stage 17 human embryo demonstrate representative staging of tissue used in HiC experiments The embryo was imaged using High Resolution Episcopic Microscopy (HREM): raw data courtesy of Dr Tim Mohun (Francis Crick Institute, London, UK) and provided by the Deciphering the Mechanisms of Developmental Disorders (DMDD) program (https://dmdd.org.uk/).
Fig. 4
Fig. 4. Editing of hESCs resulted in inversion of superenhancer target.
Method of genome editing H9 cells (a). Location of guide RNAs gRNA1 and gRNA6 relative to the WT orientation (b). CTCF motifs are shown in color by orientation, blue forward and red reverse. Screening strategy for determining whether clones are heterozygous for the 1/6 deletion and determining if a clone contains an inversion of the targeted region, orientation of hemizygous inversion clone is shown (c). HiC interactions in H9-derived CNCCs from WT (d- left panel) and clone with hemizygous inversion (d- right panel). The HiC plot made for INV used alignment to a custom version of the hg19 genome with the specific inversion on chromosome 7 introduced. Strong contacts in WT CNCCs are marked in the left panel with light blue boxes. Novel contacts created by inversion are marked in the right panel with red arrows.
Fig. 5
Fig. 5. Chromatin architecture in primary mouse embryonic craniofacial tissue.
HiC of E11.5 mouse embryonic craniofacial tissue. TADs called at 100Kb (blue/dark yellow). Mouse embryonic craniofacial superenhancers (CF meSE) determined by ROSE algorithm. Enhancer segments with validated craniofacial activity (shown in Fig. 2), human enhancer segment coordinates arrived at via liftover. ChromHMM chromatin states for the 18-state model of embryonic craniofacial tissue for E9.5-E11.5, E12.5 palate and E13.5 upper palate; individual enhancer segments are yellow and orange. HiC loops as predicted at 10Kb resolution, 4C-seq loops at 10Kb resolution (2 biological replicates per viewpoint). Viewpoint near intergenic space between Hoxa5 and Hoxa6 (purple), viewpoint at TAD boundary (magenta), and viewpoint at center of superenhancer subTAD (red).
Fig. 6
Fig. 6. Deletion of the craniofacial-specific superenhancer distal to the Hoxa gene cluster mimics the Hoxa2 null phenotype.
a Schematic of deletion, mouse chr6:50673614-51196805 (mm10), spanning major predicted contacts with the Hoxa cluster. b (upper row) Three-dimensional rendered images generated from microCT scans of representative wildtype E18.5 embryos and their heterozygote and homozygote ΔGCR littermates. Ventral view of the skulls reveals multiple cranial base and palatal bony defects in homozygotes. The palatal defects include cleft palate in ~66% of homozygotes and reflected by marked separation of the palatine processes of the maxillae [ppm], separation and ventrally projecting palatine bones [pb], as well as lateral flattening of the medial pterygoid processes [mpt] of the basisphenoid. There was variability in the palatal presentation in homozygotes (see Figure S22 for all scanned embryos). The cranial base presentation, characterized by the notably abnormal appearance of the lateral pterygoids [lpt] of the basisphenoid and abnormal anterior shape of the basioccipital (denoted by the arrowhead), was fully penetrant in homozygotes. A posterior cleft (arrowhead) or small notch in the basisphenoid was also evident in ~50% of homozygotes. (lower row) Soft tissue rendering from microCT scans of E17.5 embryos confirm the cleft palate observed in some homozygotes. Note the normal formation of rugae despite the cleft. c Left lateral view of the bony (top) and soft tissue (bottom) rendering of microCT scans of littermates. Homozygotes show mirror duplications of the tympanic ring (tr; *tr), tympanic process and squamous bone (tp/sq; *tp/*sq) reminiscent of previously reported Hoxa2 null mice. The abnormal lateral pterygoid (lpt) of the basisphenoid is evident from this view of homozygotes. Although not previously described in Hoxa2 null mice, the mandibular angle was consistently hypoplastic (arrowhead) in homozygotes. On the soft tissue renderings, variable severity microtia can be clearly seen in homozygotes (arrow). Microtia ranges from grade I to grade III.
Fig. 7
Fig. 7. Deletion of a superenhancer region has specific effect on Hoxa genes.
a Deletion resulted in decrease in Hoxa gene expression without similar decrease in expression of intervening genes such as Snx10 and Skap2. Significance values were calculated with Wald test by DESeq2 and adjust with the Benjamini-Hochberg approach. b Heatmap of expression from all replicates of WT and ΔGCR/ΔGCR for genes indicated in panel a. c Hoxa2 expression was substantially different in E11.5 ΔGCR/ΔGCR vs. WT littermates in craniofacial tissue but not in heart or limb. Measurements are independent biological replicates: Face WT n = 7, ΔGCR/ΔGCR n = 5; Heart WT and ΔGCR/ΔGCR n = 3 each; Limb WT and ΔGCR/ΔGCR n = 3 each. The center line denotes the median value (50th percentile), the box contains the 25th to 75th percentiles and the whiskers mark the 5th and 95th percentiles. Data points beyond these values are shown as individual dots.
Fig. 8
Fig. 8. Location of de novo deletion overlapping GCR.
Browser image (hg19) showing de novo deletion presented by the group at Ghent University corresponding to Chr7:25,839,621-26,389,620 on the hg19 assembly. Also shown are the UCSC Browser tracks for the 25-state model, human embryonic craniofacial superenhancers and gnomAD Structural Variation track filtered to show CNVs >300 bp. Colors in the gnomAD track are as they appear in the UCSC genome browser, red bars signify deletions and blue bars duplications.
Fig. 9
Fig. 9. HOXA GCR Duplication Patient.
a Newborn 3D CT with reconstruction demonstrating partial calvaria. b Newborn brain MRI demonstrating hypoplastic cerebellum and brainstem. c UCSC Genome Browser shot showing duplicated region identified in this patient. d Differentially expressed genes across multiple replicates (n = 3) and clones (n = 5) of patient neural crest cells compared to neural crest derived from control cell lines (n = 4) (CTRL). e Network plot of enriched gene ontology terms of all significantly dysregulated genes between WT and patient neural crest. f Normalized counts from all patient-derived NCC RNA-Seq. g Transcription factor co-occurrence scores reported by Enrichr for upregulated (red), downregulated (green), and non-differentially expressed genes (blue) for each of the HOXA TFs. h Significant disease ontology categories identified by Fisher Exact Test (one-sided, Benjamini-Hochberg adjusted) calculated by DisGeNet for down and upregulated genes in patient neural crest.

References

    1. Fulco CP, et al. Systematic mapping of functional enhancer-promoter connections with CRISPR interference. Science. 2016;354:769–773. doi: 10.1126/science.aag2445. - DOI - PMC - PubMed
    1. Spitz F, Furlong EEM. Transcription factors: from enhancer binding to developmental control. Nat. Rev. Genet. 2012;13:613–626. doi: 10.1038/nrg3207. - DOI - PubMed
    1. Lettice LA, et al. A long-range Shh enhancer regulates expression in the developing limb and fin and is associated with preaxial polydactyly. Hum. Mol. Genet. 2003;12:1725–1735. doi: 10.1093/hmg/ddg180. - DOI - PubMed
    1. Osterwalder M, et al. Enhancer redundancy provides phenotypic robustness in mammalian development. Nature. 2018;554:239–243. doi: 10.1038/nature25461. - DOI - PMC - PubMed
    1. Hnisz D, et al. Super-enhancers in the control of cell identity and disease. Cell. 2013;155:934–947. doi: 10.1016/j.cell.2013.09.053. - DOI - PMC - PubMed

Publication types

Substances