. 2024 Jan 2;15(1):122.
doi: 10.1038/s41467-023-44391-9.

FOXP3+ regulatory T cell perturbation mediated by the IFNγ-STAT1-IFITM3 feedback loop is essential for anti-tumor immunity

Affiliations

FOXP3+ regulatory T cell perturbation mediated by the IFNγ-STAT1-IFITM3 feedback loop is essential for anti-tumor immunity

Xinnan Liu et al. Nat Commun. .

Abstract

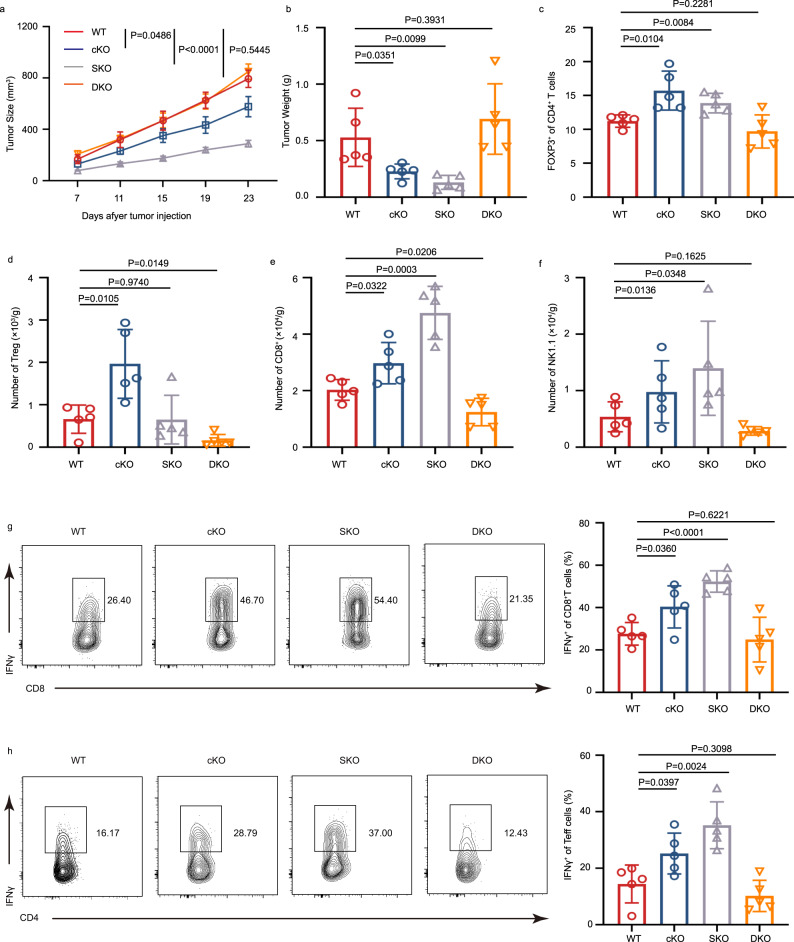
Targeting tumor-infiltrating regulatory T cells (Tregs) is an efficient way to evoke an anti-tumor immune response. However, how Tregs maintain their fragility and stability remains largely unknown. IFITM3 and STAT1 are interferon-induced genes that play a positive role in the progression of tumors. Here, we showed that IFITM3-deficient Tregs blunted tumor growth by strengthening the tumor-killing response and displayed the Th1-like Treg phenotype with higher secretion of IFNγ. Mechanistically, depletion of IFITM3 enhances the translation and phosphorylation of STAT1. On the contrary, the decreased IFITM3 expression in STAT1-deficient Tregs indicates that STAT1 conversely regulates the expression of IFITM3 to form a feedback loop. Blocking the inflammatory cytokine IFNγ or directly depleting STAT1-IFITM3 axis phenocopies the restored suppressive function of tumor-infiltrating Tregs in the tumor model. Overall, our study demonstrates that the perturbation of tumor-infiltrating Tregs through the IFNγ-IFITM3-STAT1 feedback loop is essential for anti-tumor immunity and constitutes a targetable vulnerability of cancer immunotherapy.


Conflict of interest statement

B.L. is a cofounder of Biotheus Inc. and chairman of its scientific advisory board. The other authors declare no competing interests.

Figures

Fig. 1
Fig. 1. IFITM3 is correlated with Tregs in the tumor microenvironment.
a mRNA expression of IFITM3 in TCGA ESCA database. b qRT-PCR analysis of IFITM3 in tissue from COAD patients (n = 6). c Histogram shows the MFI of IFITM3 and the quantification of the MFI of IFITM3 in Treg cells from normal tissue and tumor tissue from ESCA patients (n = 6). d Treg percentage of CD4+ T cells in normal tissue and tumor tissue of ESCA patients. Tumor-infiltrating Treg cells were divided into two subsets (FOXP3high and FOXP3low)according to FOXP3 expression (n = 6). e Histogram shows the MFI of IFITM3 and the quantification of the MFI of IFITM3 in FOXP3high and FOXP3low tumor Treg cells (n = 6). f Correlation analysis of IFITM3 expression and FOXP3 expression in tumor-infiltrating Treg cells from ESCA patients (n = 13). g qRT-PCR analysis of Ifitm3 and genes associated with Treg function in Treg cells from the tumor and normal tissue (dLN) of MC38 tumor-bearing mice (n = 3). Data are represented as the mean ± SD. Source data are provided as a Source Data file.
Fig. 2
Fig. 2. IFITM3 deficient in Tregs promotes anti-tumor responses in vivo.
a, b Tumor growth (a, WT group: n = 7; cKO group: n = 7) and tumor weight (b, WT group: n = 6; cKO group: n = 6) in WT and cKO mice injected s.c. with MC38 murine colon cancer cells. c Survival curve of WT and cKO mice injected s.c. with MC38 murine colon cancer cells (n = 7 per group). d, e Percentage of CD8+ (d) and NK cells (e) in tumor of WT and cKO mice injected s.c. with MC38 murine colon cancer cells (day 23, n = 5 per group). f Histogram shows the MFI of Ki67 and the quantification of the MFI of Ki67 in CD8+ T cells and Teff cells in tumors of WT and cKO mice injected s.c. with MC38 murine colon cancer cells (n = 4 per group). g, h Cytokine secretion of CD8+ and Teff cells in tumor of WT and cKO mice injected s.c. with MC38 murine colon cancer cells (day 23, n = 5 per group). Survival curves were analyzed by log-rank (Mantel-Cox) test. The data dh are presented as representative plots and as summary graphs (n = 4/5 per group). Source data are provided as a Source Data file.
Fig. 3
Fig. 3. IFITM3 ablation dampens Treg function and stability in the tumor.
a Percentage of CD4+FOXP3+ Treg cells among CD4+ T cells in tumor of WT and cKO mice injected s.c. with MC38 murine colon cancer cells (day 23, n = 4 per group). b Histogram shows the MFI of FOXP3 and the quantification of the MFI of FOXP3 in tumor Treg cells of WT and cKO mice injected s.c. with MC38 murine colon cancer cells (day 23, n = 4 per group). c Histogram shows the MFI of CD25 and the quantification of the MFI of CD25 in tumor Treg cells of WT and cKO mice injected s.c. with MC38 murine colon cancer cells (day 23, n = 4 per group). d Histogram shows the MFI of Ki67 and the quantification of the MFI of Ki67 in tumor Treg cells of WT and cKO mice injected s.c. with MC38 murine colon cancer cells(day 23, n = 4 per group). e, f Frequency of IFNγ (e) and IL10 (f) producing Treg cells in tumor of WT and cKO mice injected s.c. with MC38 murine colon cancer cells (day 23, n = 4 per group). g Percentage of Tconv cells, CD8+ T cells, and NK cells in the spleen of WT and cKO mice injected s.c. with MC38 murine colon cancer cells (day 23, n = 4 per group). h Percentage of CD4+FOXP3+ Treg cells among CD4+ T cells in the spleen of WT and cKO mice injected s.c. with MC38 murine colon cancer cells (day 23, n = 4 per group). i, j The quantification of the MFI of FOXP3 (i) and CD25 (j) in spleen Treg cells of WT and cKO mice injected s.c. with MC38 murine colon cancer cells(day 23, n = 4 per group). The data are presented as summary graphs (n = 4 per group). Data are represented as the mean ± SD. Source data are provided as a Source Data file.
Fig. 4
Fig. 4. IFITM3 is dispensable for STAT1 phosphorylation and expression in Tregs.
a Heatmap of upregulated genes associated with Treg activation and IFN signal pathway in tumor-infiltrating WT and IFITM3-deficient Treg cells. Treg cells were isolated from tumor-bearing WT and KO mice on day 23 after the injection of MC38 murine colon cancer cells. b GSEA enrichment plots of the indicated signatures in tumor-infiltrating WT and IFITM3-deficient Treg cells. c qRT-PCR analysis of upregulated genes in tumor-infiltrating Treg cells of WT and cKO mice (n = 3). d Immunoblot analysis of STAT1 and FOXP3 in WT and cKO Treg cells stimulated with anti-CD3 and anti-CD28 antibodies for the indicated durations. e Immunoblot analysis of p-STAT1(Tyr701) and STAT1 in WT and cKO Treg cells stimulated with anti-CD3 and anti-CD28 antibodies for the indicated durations. f Flow cytometric analysis of p-STAT1(Tyr701) in WT and cKO Treg cells stimulated with anti-CD3 and anti-CD28 antibodies for the indicated durations. g ChIP-qPCR analysis of Ifi44 and Psmb9 that are regulated by STAT1 in WT and cKO Treg cells. Data in df are representative of 3 independent experiments. Data are represented as the mean ± SD. Source data are provided as a Source Data file.
Fig. 5
Fig. 5. IFITM3 mediates JAK-STAT1 activation and facilitates the AKT-FOXO1 axis.
a Cell lysates of mouse Treg cells were immunoprecipitated with anti-IFITM3 antibody and assessed by immunoblotting with anti-STAT1. b HEK293T cells were transfected with HA-tagged STAT1 and increased amounts of Myc-tagged IFITM3. The level of Myc-IFITM3 was then detected by immunoblotting. c Immunoblot analysis of HA-STAT1 and Myc-IFITM3 in nuclear and cytoplasm extracted from HEK293T cells transfected with HA-tagged STAT1 and Myc-tagged IFITM3. d HEK293T cells were transfected with the Flag-tagged JAK1 and Myc-tagged IFITM3 were immunoprecipitated with anti-Myc antibody and assessed by immunoblotting with anti-Flag. e HEK293T cells were transfected with the HA-tagged JAK2 and Myc-tagged IFITM3 were immunoprecipitated with anti-Myc antibody and assessed by immunoblotting with anti-HA. f Immunofluorescence analysis of HEK293T cells transfected with Flag-JAK1/HA-JAK2 and Myc-IFITM3. g Heatmap of downregulated genes associated with Treg activation and IFN signal pathway in tumor-infiltrating WT and IFITM3-deficient Treg cells. Treg cells were isolated from tumor-bearing WT and KO mice on day 23 after the injection of MC38 murine colon cancer cells. h Immunoblot analysis of p-AKT(Ser473) and AKT in WT and cKO Treg cells stimulated with anti-CD3 and anti-CD28 antibodies for the indicated durations. i Immunoblot analysis of FOXO1 in WT and cKO Treg cells. Experiments were independently repeated 3 times. Source data are provided as a Source Data file.
Fig. 6
Fig. 6. IFITM3 and STAT1 form a feedback loop and it is IFNγ dependent.
a Immunoblot analysis of IFITM3, STAT1, and FOXP3 in Treg cells after IL12 (50 ng/ml), IL27 (50 ng/ml), and IFNγ (50 ng/ml) treatment for 24 h. b Flow cytometric analysis of IFITM3 in WT and SKO Treg cells after IL12, IL27, and IFNγ treatment for 24 h (n = 3). c RT–qPCR analysis of IFITM3 mRNA level in WT and SKO Treg cells after IL12, IL27, and IFNγ treatment for 24 h (n = 3). d ChIP-qPCR analysis of −203 to −70bp and −23 to +109 bp of exon1 of Ifitm3 that is regulated by STAT1 in WT Treg cells. Data in d are representative of 3 independent experiments. e Tumor growth in WT, cKO, and IFNγ+/- cKO mice injected s.c. with MC38 murine colon cancer cells (WT: n = 7; cKO: n = 7; IFNγ+/- cKO: n = 7). f Tumor weight of WT, cKO, and IFNγ+/- cKO mice injected s.c. with MC38 murine colon cancer cells (n = 4 per group). g Percentage of Treg cells in tumor of WT, cKO, and IFNγ +/-cKO mice injected s.c. with MC38 murine colon cancer cells (day 23, n = 4 per group). h, i Frequency of IL10 (h) and IFNγ (i) producing Treg cells in tumor of WT and cKO mice injected s.c. with MC38 murine colon cancer cells (day 23, n = 4 per group). j The quantification of the MFI of Ki67 in Treg cells in tumors of WT, cKO, and IFNγ +/-cKO mice injected s.c. with MC38 murine colon cancer cells (day 23, n = 4 per group). k, l Cytokine secretion of CD8+ (k) and CD4+ T cells (l) in tumor of WT, cKO, and IFNγ+/- cKO mice injected s.c. with MC38 murine colon cancer cells (day 23, n = 4 per group). The data fl are presented as representative plots and as summary graphs (n = 4 per group). Data are represented as the mean ± SD. Source data are provided as a Source Data file.
Fig. 7
Fig. 7. STAT1-IFITM3 feedback loop plays an essential role in tumor-infiltrating Tregs.
a Tumor growth in WT, cKO, SKO, and DKO mice injected s.c. with MC38 murine colon cancer cells (WT: n = 7; cKO: n = 7; SKO: n = 7; DKO: n = 7). b Tumor weight of WT, cKO, SKO, and DKO mice injected s.c. with MC38 murine colon cancer cells (n = 5 per group). c Percentage of Treg cells in tumor of WT, cKO, SKO, and DKO mice injected s.c. with MC38 murine colon cancer cells (n = 5 per group). df Cell number of Treg cells (d), CD8+ cells (e), and NK cells (f) in tumor of WT, cKO, SKO, and DKO mice injected s.c. with MC38 murine colon cancer cells (Day 23, n = 5 per group). g, h Cytokine secretion of CD8+ (g) and CD4+ T cells (h) in tumor of WT, cKO, SKO, and DKO mice injected s.c. with MC38 murine colon cancer cells (Day 23, n = 5 per group). The data bh are presented as representative plots and as summary graphs (n = 5 per group). Data are represented as the mean ± SD. Source data are provided as a Source Data file.
Fig. 8
Fig. 8. Model explaining our findings.
A STAT1-IFITM3 negative feedback loop limits the IFNγ-signaling pathway to maintain Treg function and stability. In WT Treg cells, IFNγ induces the phosphorylation of STAT1, and then the phosphorylated STAT1 transfer to the nucleus and induce the transcription and translation of IFITM3. And then IFITM3 will suppress the phosphorylation of STAT1 and lead to the degradation of STAT1 to inhibit the further activation of the IFNγ-signaling pathway (WT Treg on the left). In IFITM3-deficient Treg cells, the phosphorylation of STAT1 and IFNγ-signaling pathway are strongly activated, thus Treg cells show upregulated IFNγ signaling and revert to inflammatory cells (IFITM3 cKO Treg on the right). We simulate TI-Treg cells as buildings made up of blocks and simulate IFITM3 and STAT1 as two blocks balancing each other to maintain the stability of the buildings. When we take away block-IFITM3 (IFITM3 cKO) or block-STAT1 (STAT1 cKO), the building loses balance and collapses. But when we take away both block-IFITM3 and block-STAT1 (IFITM3 and STAT1 DKO), the building remains in normal equilibrium. So this block model greatly simulates Treg function and stability in WT, IFITM3 cKO, STAT1 cKO, and DKO mice.

References

    1. Tanaka A, Sakaguchi S. Regulatory T cells in cancer immunotherapy. Cell Res. 2017;27:109–118. doi: 10.1038/cr.2016.151. - DOI - PMC - PubMed
    1. Joyce JA, Fearon DT. T cell exclusion, immune privilege, and the tumor microenvironment. Science (New York, N.Y.) 2015;348:74–80. doi: 10.1126/science.aaa6204. - DOI - PubMed
    1. Tanaka A, Sakaguchi S. Targeting Treg cells in cancer immunotherapy. Eur. J. Immunol. 2019;49:1140–1146. doi: 10.1002/eji.201847659. - DOI - PubMed
    1. Hansen W, et al. Neuropilin 1 deficiency on CD4+Foxp3+ regulatory T cells impairs mouse melanoma growth. J. Exp. Med. 2012;209:2001–2016. doi: 10.1084/jem.20111497. - DOI - PMC - PubMed
    1. Ye L, Schnepf D, Staeheli P. Interferon-λ orchestrates innate and adaptive mucosal immune responses. Nat. Rev. Immunol. 2019;19:614–625. doi: 10.1038/s41577-019-0182-z. - DOI - PubMed

Publication types

MeSH terms