. 2024 Jan 2;15(1):186.
doi: 10.1038/s41467-023-44559-3.

ApoL6 associates with lipid droplets and disrupts Perilipin1-HSL interaction to inhibit lipolysis

Affiliations

ApoL6 associates with lipid droplets and disrupts Perilipin1-HSL interaction to inhibit lipolysis

Yuhui Wang et al. Nat Commun. .

Abstract

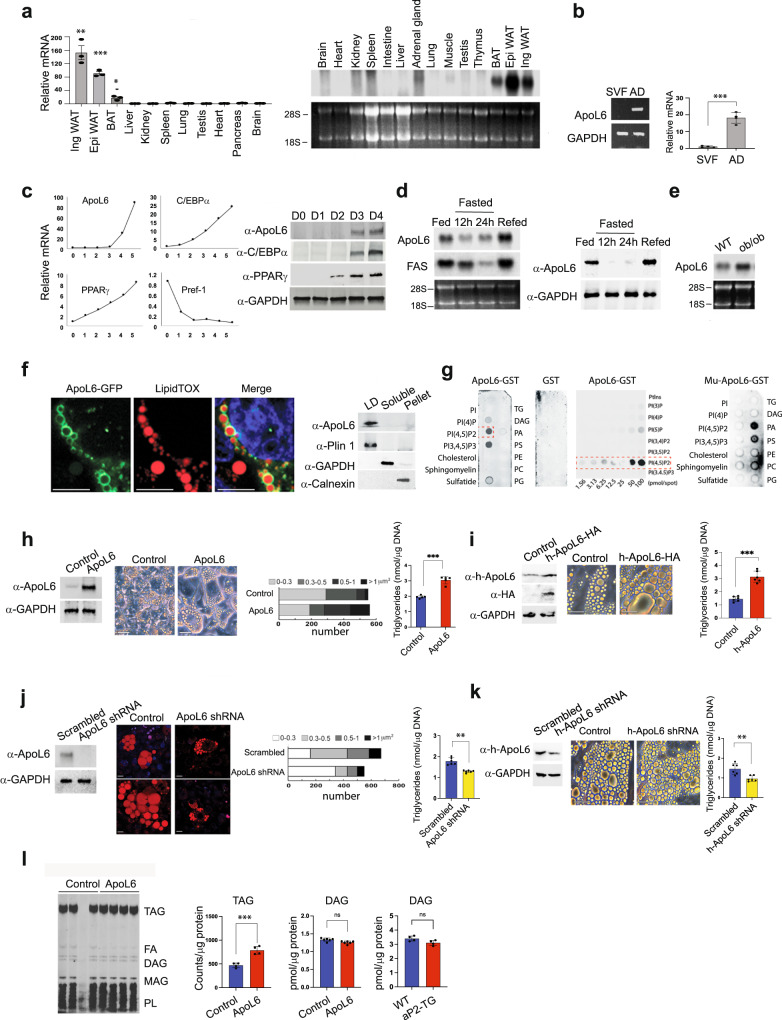
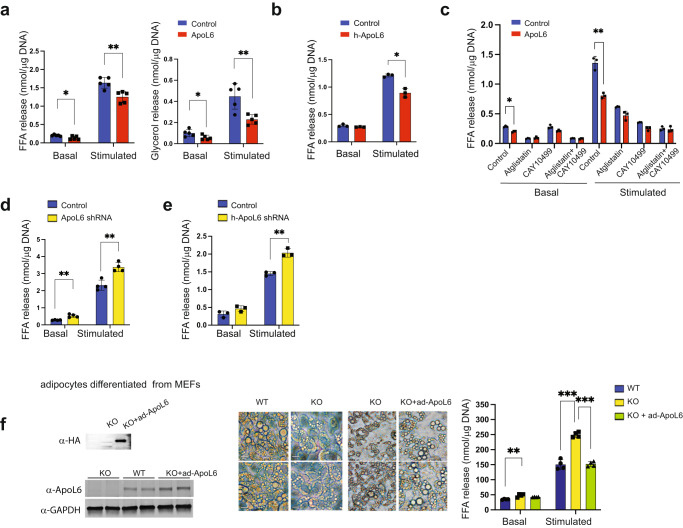
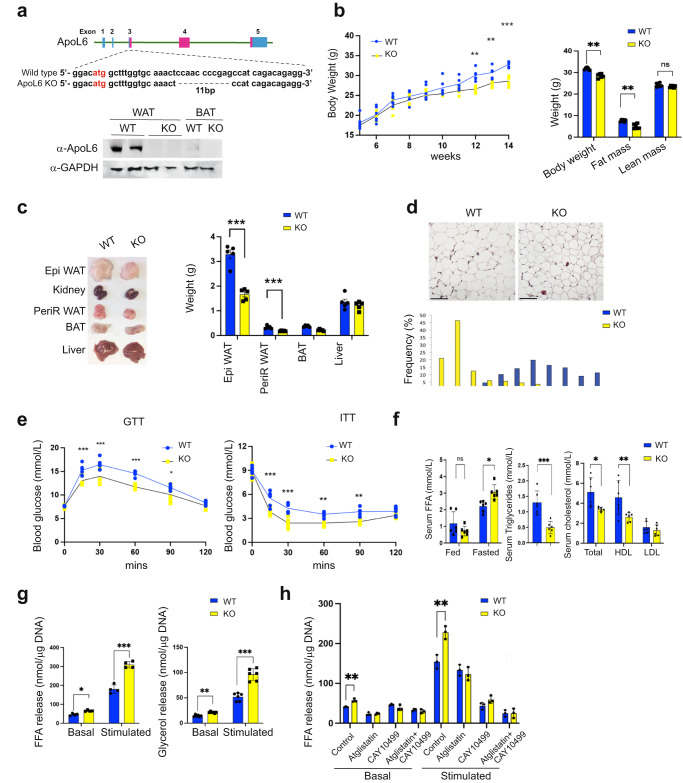
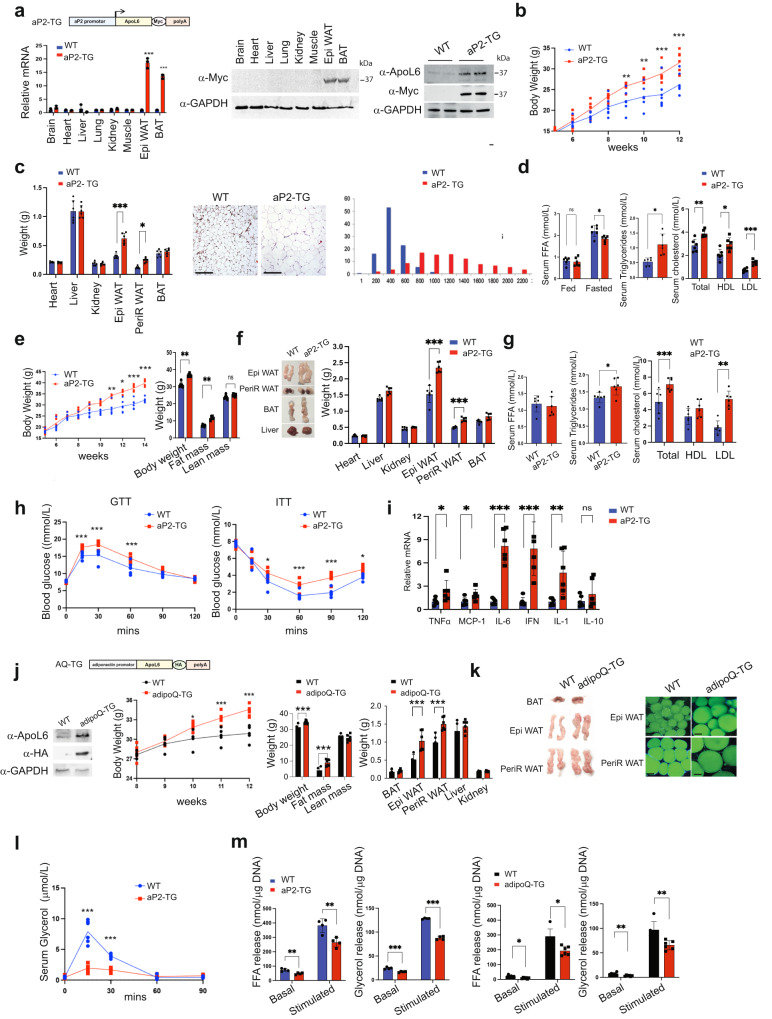
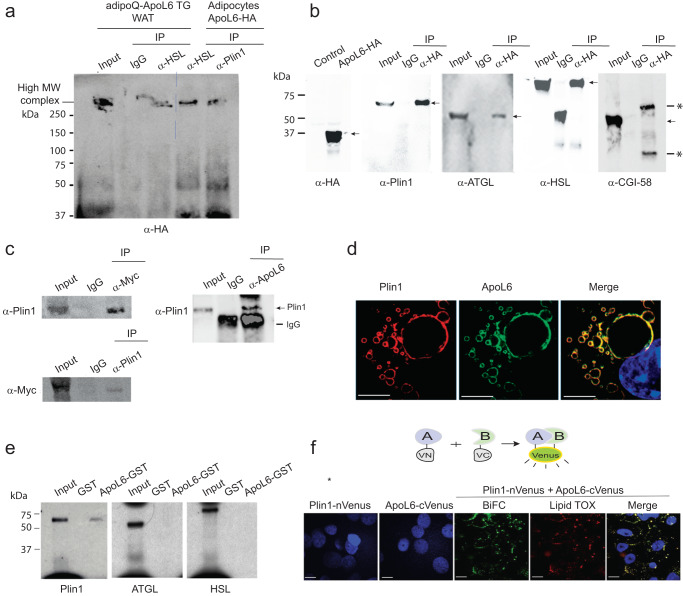
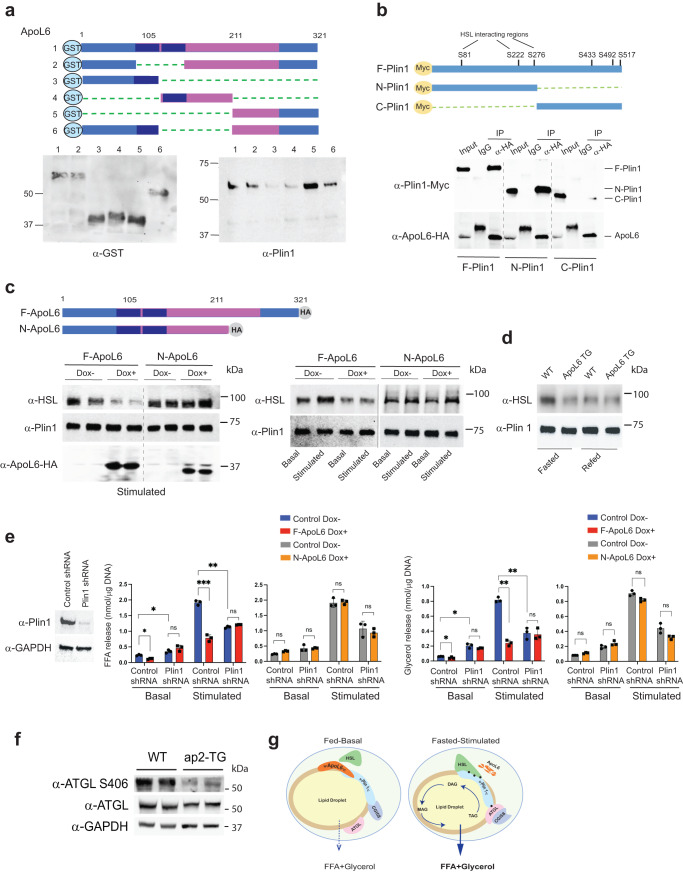
Adipose tissue stores triacylglycerol (TAG) in lipid droplets (LD) and release fatty acids upon lipolysis during energy shortage. We identify ApoL6 as a LD-associated protein mainly found in adipose tissue, specifically in adipocytes. ApoL6 expression is low during fasting but induced upon feeding. ApoL6 knockdown results in smaller LD with lower TAG content in adipocytes, while ApoL6 overexpression causes larger LD with higher TAG content. We show that the ApoL6 affects adipocytes through inhibition of lipolysis. While ApoL6, Perilipin 1 (Plin1), and HSL can form a complex on LD, C-terminal ApoL6 directly interacts with N-terminal Plin1 to prevent Plin1 binding to HSL, to inhibit lipolysis. Thus, ApoL6 ablation decreases white adipose tissue mass, protecting mice from diet-induced obesity, while ApoL6 overexpression in adipose brings obesity and insulin resistance, making ApoL6 a potential future target against obesity and diabetes.


Conflict of interest statement

The authors declare no competing interests.

Figures

Fig. 1
Fig. 1. ApoL6 is a LD-associated protein and enhances triglyceride accumulation.
a RT-qPCR and Northern blotting for ApoL6 mRNA levels in various tissues. (n = 3 mice, **p = 0.0061, **p = 0.0019, ***p < 0,001, two-tailed Student’s t test compared to expression levels in liver). Data are expressed as mean ± SD. b RT-PCR and RT-qPCR for ApoL6 mRNA levels in stromal vascular and adipocyte fractions of WAT (n = 4 mice, ***p < 0.001, two-tailed Student’s t test). Data are expressed as mean ± SD. c RT-qPCR (left) and immunoblotting (right) during 3T3-L1 adipocyte differentiation. d Northern blotting (left) and immunoblotting (right) of WAT. e Northern blotting of WAT. f Immunofluorescence of differentiated 3T3-L1 cells infected with ApoL6-GFP (green) adenovirus stained with (red), (bar = 10 μm) and immunoblotting after sucrose separation (right). g Immunoblotting after incubation of lipid membrane strips with either WT ApoL6-GST or control GST (right and middle) or mutated ApoL6 -GST (Mu-ApoL6-GST, aa286-292, from RYRKLQR to DYDDLQD, right). h Immunoblotting after infection of adenoviral ApoL6 in differentiated 3T3-L1 adipocytes, image (bar=10 μm), quantification of LD size and TAG levels (right, n = 5, ***p < 0.001, two-tailed Student’s t test). Data are expressed as mean ± SD. Experiment was repeated twice. i Human adipocytes differentiated from human fibroblasts were infected with lentiviral h-ApoL6-HA. Immunoblotting with h-ApoL6 antibody, cell images (bar = 10 μm), and TAG levels (n = 6, ***p < 0.001, two-tailed Student’s t test). j Immunoblotting after scramble and ApoL6-shRNA infection in 3T3-L1 adipocytes. LipidTOX staining (bar = 10 μm), quantification of LD sizes and TAG levels (n = 6. **p = 0.0025, two-tailed Student’s t test). Data represent mean ± SD. Independent experiments were repeated twice. k Human adipocytes were infected with lentiviral ApoL6 shRNA. Immunoblotting after infection, cell images (bar = 10 μm) and TAG levels (n = 6, **p = 0.003, two-tailed Student’s t test). l Lipids were extracted from [U-14C-TAG] pulse-labeled 3T3-L1 adipocytes and separated by TLC. Image for TLC plate. 14C-TAG was quantified by scintillation counting (n = 4, ***p < 0.001, two-tailed Student’s t test). DAG levels were measured in lipids extracted from 3T3-L1 adipocytes (n = 6, ns p = 0.0912, two-tailed Student’s t test) and WAT from mice (right, n = 4, ns p = 0.058, two-tailed Student’s t test). Data represent mean ± SD. Source data are provided as a Source Data file.
Fig. 2
Fig. 2. ApoL6 inhibits lipolysis.
a Differentiated 3T3-L1 adipocytes were infected with inducible lentiviral ApoL6. Induction was achieved by treating the cells with Dox for 3 h before experiment. No Dox-treatment was used as control. FFA and glycerol release in the media from cells in basal and isoproterenol-stimulated conditions was measured. FFA (n = 5, *p = 0.016, **p = 0.0039, multiple t test), glycerol (n = 5, *p = 0.043, **p = 0.0055, multiple t test). Data represent mean ± SD. Independent experiment were repeat twice. b FFA release from human adipocytes after infection with lentiviral h-ApoL6-HA (n = 3, **p = 0.0027). Data represent mean ± SD. Experiment was repeated twice. c FFA release from differentiated 3T3-L1 cells cultured with Atglistatin (ATGL inhibitor) and CAY10499 (HSL inhibitor, n = 3, *p = 0.016, **p = 0.0013). Data represent mean ± SD. d FFA release from differentiated 3T3-L1 adipocytes after ApoL6 shRNA knockdown (n = 4, **p = 0.002 and 0.0019). e FFA release from human adipocytes after infection with lentiviral h-ApoL6 shRNA (n = 3, **p = 0.0016). Data represent mean ± SD. Experiment was repeated twice. f MEFs prepared from WT and ApoL6 KO E13.5 embryos were differentiated into adipocytes and infected with ApoL6-HA adenovirus. Immunoblotting with HA antibody and ApoL6 antibody (left), cell images (middle, bar = 10 μm) and FFA release (right, n = 4, **p = 0.0028, ***p < 0.001, two-way ANOVA test). Data represent mean ± SD. Independent experiments were repeated twice.
Fig. 3
Fig. 3. ApoL6 ablation in mice results in lean phenotype with increased WAT lipolysis.
a 11 bp deletion in exon 3 of ApoL6 gene and ApoL6 protein level in WAT and BAT of WT and ApoL6 KO mice. b BW during HFD feeding (n = 6, **p = 0.0018 and 0.0072, ***p < 0.001, two-way AVOVA test) and EchoMRI after HFD (n = 6, ***p < 0.001, multiple t test). c Tissue pictures and tissue weights after 10 wks of HFD feeding (n = 5, ***p < 0.001). d H&E staining (bar = 100 μm) and quantification of cell sizes of WAT. e GTT and ITT after HFD (n = 6, GTT: ***p < 0.001, *p = 0.0347; ITT: **p = 0.0056 and 0.0013, ***p < 0.001, two-way ANOVA test). f Serum FFA in fed and fasted conditions (n = 6, *p = 0.011, multiple t test), TAG (n = 6, ***p < 0.001) and cholesterol levels in the fed condition (n = 6, *p = 0.0167, **p = 0.0058). Data represent mean ± SD. g FFA (n = 4, *p = 0.017, ***p < 0.001) and glycerol release (n = 6, **p = 0.005, ***p < 0.001) from dispersed adipocytes isolated from WAT. h FFA release from cultured primary adipocytes treated with inhibitors (n = 3, **p = 0.0028 and 0.0058). Data represent mean ± SD. Experiments were repeated twice.
Fig. 4
Fig. 4. Overexpression of ApoL6 in adipocytes in mice increases WAT mass.
a aP2-ApoL6 TG design (left upper), RT-qPCR for transgene expression (left lower, n = 3 mice, ***p < 0.001 compared to WT), immunoblotting of transgene expression in different tissues and ApoL6 protein levels in WAT (right). b BW in chow (n = 6 mice per group, **p = 0.0057 and 0.0027, ***p < 0.00, two-way ANOVA test). c Tissue weights of 24 wk-old mice (left, n = 6, *p = 0.03, ***p < 0.001, multiple t test). H&E staining (bar = 100 μm) and quantification of cell sizes of WAT (right two panels). d Serum FFA (fed and fasted, n = 6, *p = 0.0117, multiple t test), TAG (n = 6, *p = 0.0224), and cholesterol levels in fed condition (n = 6, **p = 0.0034, *p = 0.049). Data represent mean ± SD. e BW during HFD (n = 6, **p = 0.006, *p = 0.0104, ***p < 0.001) and EchoMRI after HFD (n = 6, **p = 0.007 and 0.005). f Tissue image and tissue weight after 12 wks of HFD feeding (n = 6, ***p < 0.001). Data represent mean ± SD. g Serum FFA, TAG (n = 6, *p = 0.0214) and cholesterol levels after HFD feeding in the fed condition (n = 6 ***p < 0.001, **p = 0.0239). h GTT (n = 6, ***p < 0.001) and ITT (n = 6, *p = 0.0162 and 0.0319, ***p < 0.001, two-way ANOVA test) after HFD, Experiment was repeated twice. i RT-qPCR for inflammatory markers in WAT after HFD (n = 6, *p = 0.045, 0.032, **p = 0.0089, ***p < 0.001, multiple t test). j adipoQ-ApoL6 TG design. Immunoblotting using lysates of WAT from adipoQ-ApoL6 TG. BW (n = 5 mice per group, ***p < 0.001) and WAT mass measured by using EchoMRI (n = 6, ***p < 0.001) and tissue weights after 12 wks on HFD (n = 6, ***p < 0.001). k Image of tissues and whole mount staining of WAT with LipidTOX green (bar = 10 μm) after HFD feeding. l In vivo lipolysis assay: Serum glycerol levels at different time points after mice were injected with isoproterenol at 10 mg/kg BW (n = 6, ***p < 0.001, two-way ANOVA test). Experiments were repeated twice. m FFA and glycerol release from dispersed adipocytes isolated from WAT of aP2-TG (n = 4, *p = 0.005 and 0.006, ***p < 0.001) (left two panel). FFA and glycerol release from dispersed adipocytes isolated from WAT of adipoQ-ApoL6 TG (n = 6. *p = 0.026, 0.021, **p = 0.0024 and 0.0023). Data represent mean ± SD. Experiments were repeated twice.
Fig. 5
Fig. 5. ApoL6 directly interacts with Plin1.
a Total LD-associated proteins from WAT of adipoQ-ApoL6 TG mice and lysates of differentiated 3T3-L1 cells overexpressing ApoL6-HA were first IP with HA antibody, and the elution fractions were subjected to secondary IP with HSL antibody or Plin1 antibody. Immunoblotting with HA antibody after secondary IP using native gel. b Co-transfection of ApoL6-HA with Plin1, ATGL, HSL and CGI-58 in HEK293 cells. Immunoblotting after lysates were IP with HA antibody. Arrows indicate positions of interests; * indicates IgG band. c Immunoblotting after IP, using lysates of WAT of aP2-ApoL6 TG (left) and WT mice (right). d Immunofluorescence of differentiated 3T3-L1 adipocytes using Plin1 antibody (mouse) and ApoL6 antibody (rabbit) followed by Alexa fluor plus 594 anti-mouse (read) and Alexa Fluor plus 488 (green) anti-rabbit secondary antibodies (bar = 10 μm), respectively. e ApoL6-GST was incubated with S35 labeled in vitro transcribed/translated Plin1, ATGL and HSL before GST pull-down. f Bimolecular Fluorescence Complementation (BiFC) after transfection of Plin1 (fused to N-terminus of Venus) or ApoL6 (fused to C-terminus of Venus) alone (left two panels) and co-transfection of Plin1 and ApoL6 and merged with LipidTOX (red) staining in HEK293 cells (bar = 10 μm).
Fig. 6
Fig. 6. C-terminal domain of ApoL6 is critical for Plin1 interaction to inhibit lipolysis.
a ApoL6-GST deletion constructs (upper), immunoblotting after GST purification (lower left). Purified GST proteins then were incubated with purified full length Plin1. Immunoblotting with Plin1 antibody after GST pull-down (lower right). b Myc-tagged Plin1 deletion constructs (upper) were co-transfected with F-ApoL6-HA into HEK293 cells. Immunoblotting with Myc antibody after IP with HA antibody. c Inducible lentiviral F-ApoL6-HA and C-terminal deletion ApoL6 HA (N-ApoL6) (upper) were used to infect HEK293 cells after co-transfection with Plin1 and HSL. Immunoblotting with HSL antibody after IP with Plin1 antibody (left). Immunoblotting with HSL antibody after IP with Plin1 antibody in differentiated 3T3-L1 adipocytes induced to overexpress F-ApoL6-HA and N-ApoL6-HA (right). d Immunoblotting with HSL antibody after IP with Plin1 antibody using total LD-associated proteins of WAT from wild type and aP2-ApoL6 TG mice in fasted and fed conditions. e Immunoblotting after transduction of lentiviral Plin1 shRNA in differentiated 3T3-L1 adipocytes. FFA and glycerol release from 3T3-L1 adipocytes in basal and stimulated conditions (FFA: n = 3, *p = 0.019 and 0.038, **p = 0.0052, ***p < 0.001; glycerol: n = 3, *p = 0.046, 0.012, **p = 0.0011 and 0.0016, two-way ANOVA test). Data represent mean ± SD. Experiments were repeated twice. f Immunoblotting of lysates from WAT of fasted WT and aP2-ApoL6 TG mice after HFD. g Schematic model of lipolysis in adipocytes in fed-basal condition and in fasted-stimulated condition.

References

    1. Unger RH, Scherer PE. Gluttony, sloth and the metabolic syndrome: a roadmap to lipotoxicity. Trends Endocrinol. Metab. 2010;21:345–352. doi: 10.1016/j.tem.2010.01.009. - DOI - PMC - PubMed
    1. Ahmadian M, et al. Adipose overexpression of desnutrin promotes fatty acid use and attenuates diet-induced obesity. Diabetes. 2009;58:855–866. doi: 10.2337/db08-1644. - DOI - PMC - PubMed
    1. Duncan RE, et al. Characterization of desnutrin functional domains: critical residues for triacylglycerol hydrolysis in cultured cells. J. Lipid Res. 2010;51:309–317. doi: 10.1194/jlr.M000729. - DOI - PMC - PubMed
    1. Jenkins CM, et al. Identification, cloning, expression, and purification of three novel human calcium-independent phospholipase A2 family members possessing triacylglycerol lipase and acylglycerol transacylase activities. J. Biol. Chem. 2004;279:48968–48975. doi: 10.1074/jbc.M407841200. - DOI - PubMed
    1. Villena JA, Roy S, Sarkadi-Nagy E, Kim KH, Sul HS. Desnutrin, an adipocyte gene encoding a novel patatin domain-containing protein, is induced by fasting and glucocorticoids: ectopic expression of desnutrin increases triglyceride hydrolysis. J. Biol. Chem. 2004;279:47066–47075. doi: 10.1074/jbc.M403855200. - DOI - PubMed

Publication types