

Qualification of a multiplexed tissue imaging assay and detection of novel patterns of HER2 heterogeneity in breast cancer
- PMID: 38167908
- PMCID: PMC10761880
- DOI: 10.1038/s41523-023-00605-3
Qualification of a multiplexed tissue imaging assay and detection of novel patterns of HER2 heterogeneity in breast cancer
Abstract
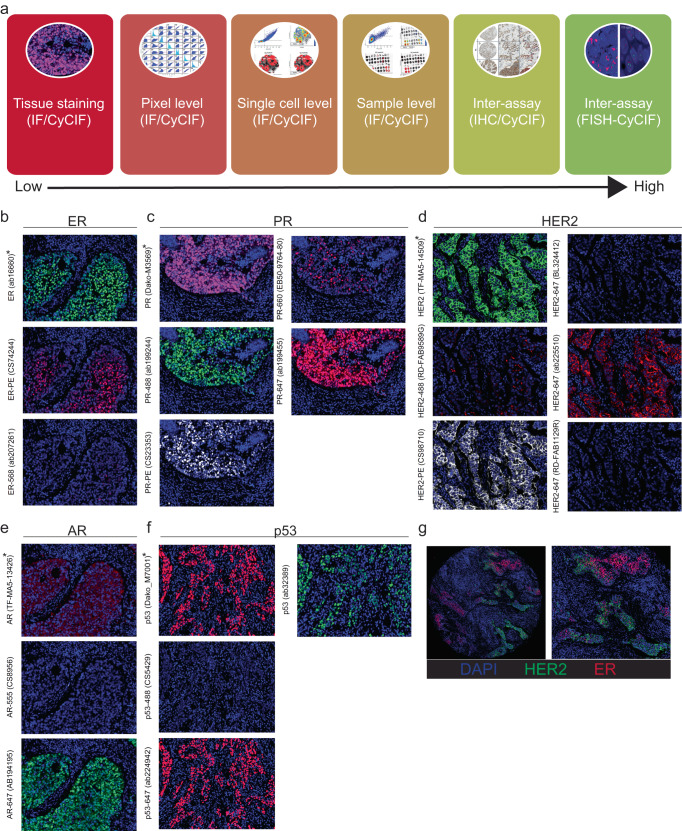
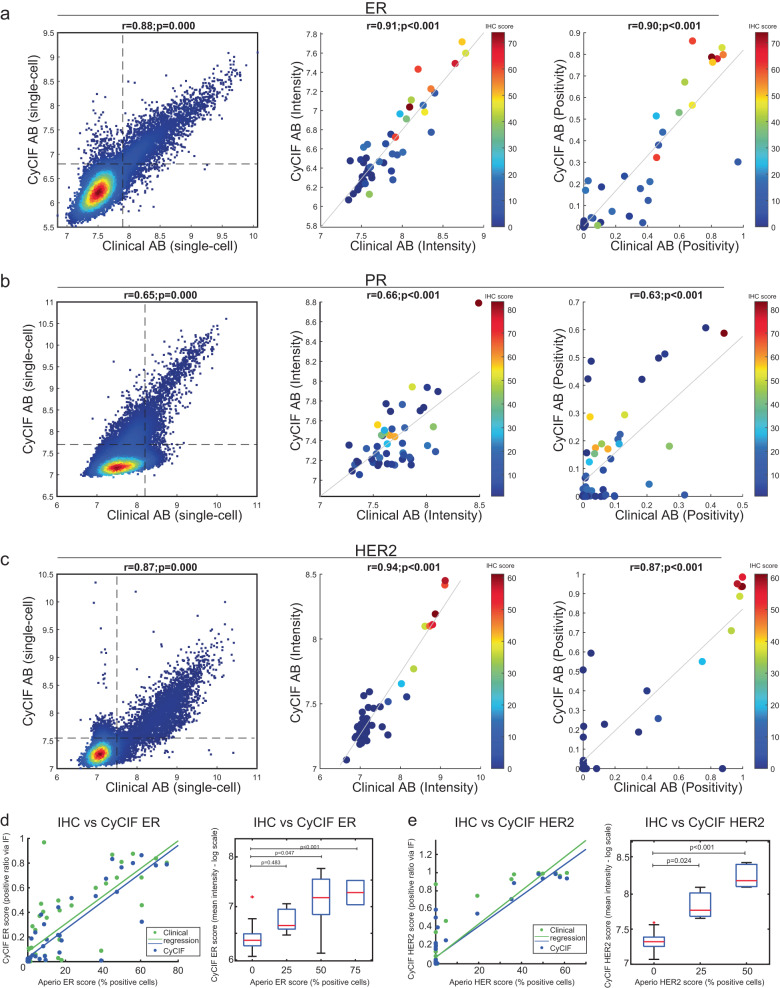
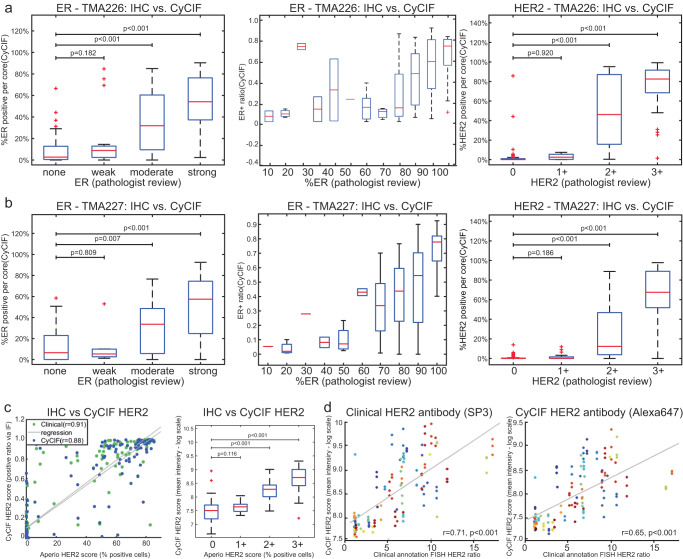
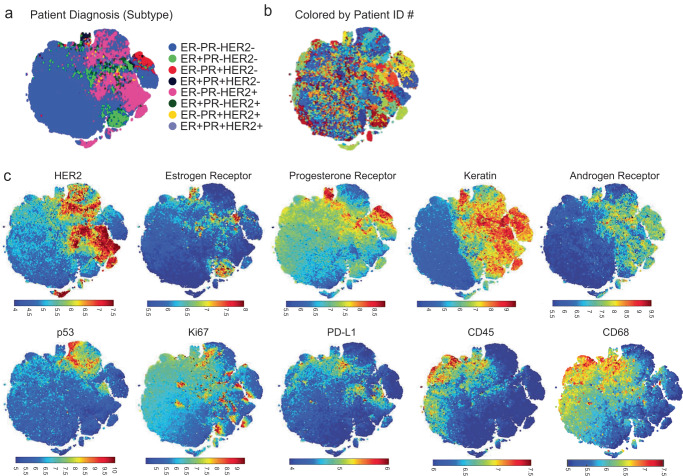
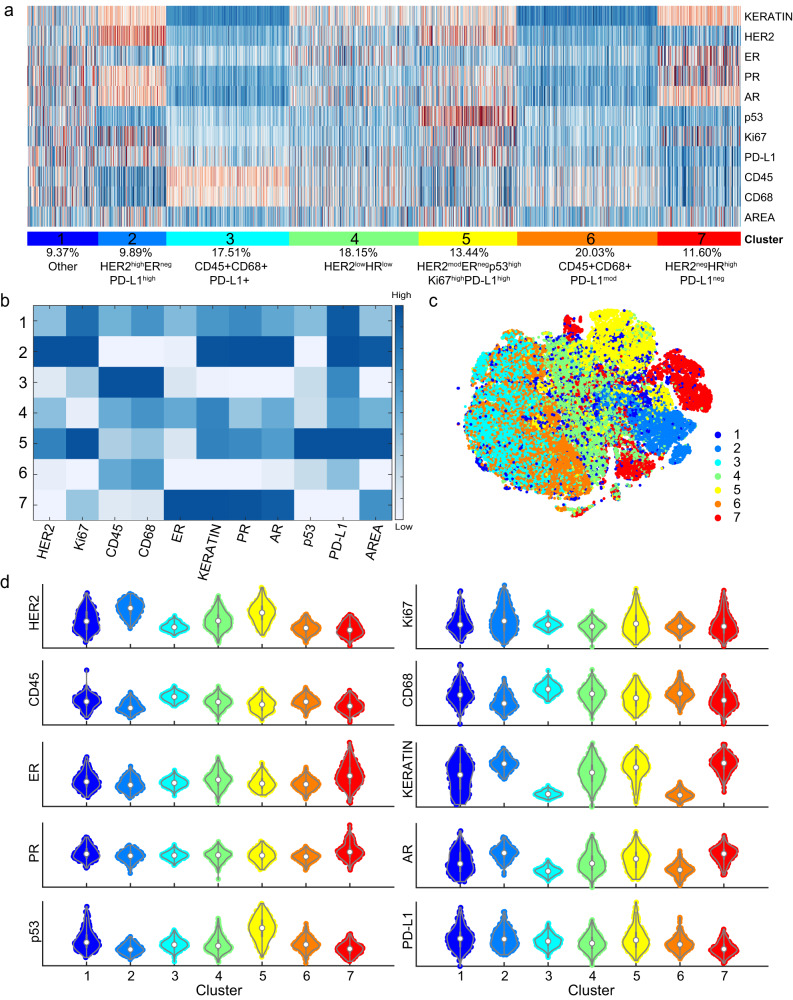
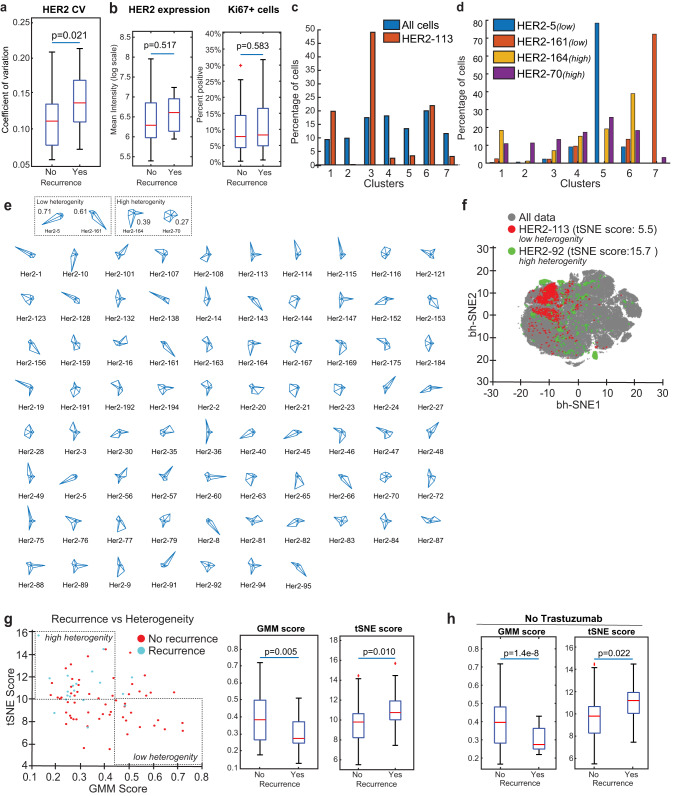
Emerging data suggests that HER2 intratumoral heterogeneity (ITH) is associated with therapy resistance, highlighting the need for new strategies to assess HER2 ITH. A promising approach is leveraging multiplexed tissue analysis techniques such as cyclic immunofluorescence (CyCIF), which enable visualization and quantification of 10-60 antigens at single-cell resolution from individual tissue sections. In this study, we qualified a breast cancer-specific antibody panel, including HER2, ER, and PR, for multiplexed tissue imaging. We then compared the performance of these antibodies against established clinical standards using pixel-, cell- and tissue-level analyses, utilizing 866 tissue cores (representing 294 patients). To ensure reliability, the CyCIF antibodies were qualified against HER2 immunohistochemistry (IHC) and fluorescence in situ hybridization (FISH) data from the same samples. Our findings demonstrate the successful qualification of a breast cancer antibody panel for CyCIF, showing high concordance with established clinical antibodies. Subsequently, we employed the qualified antibodies, along with antibodies for CD45, CD68, PD-L1, p53, Ki67, pRB, and AR, to characterize 567 HER2+ invasive breast cancer samples from 189 patients. Through single-cell analysis, we identified four distinct cell clusters within HER2+ breast cancer exhibiting heterogeneous HER2 expression. Furthermore, these clusters displayed variations in ER, PR, p53, AR, and PD-L1 expression. To quantify the extent of heterogeneity, we calculated heterogeneity scores based on the diversity among these clusters. Our analysis revealed expression patterns that are relevant to breast cancer biology, with correlations to HER2 ITH and potential relevance to clinical outcomes.
© 2024. The Author(s).
Conflict of interest statement
D.A.D. consults for Novartis, receives funding from Canon, Inc., and is on the advisory board for Oncology Analytics, Inc. S.J.S. receives consulting fees from Venn Therapeutics. P.K.S. serves on the SAB or BOD of Glencoe Software, Applied Biomath, and RareCyte Inc. and has equity in these companies; he is a member of the NanoString SAB and is also co-founder of Glencoe Software, which contributes to and supports the open-source OME/OMERO image informatics software used in this paper. In the last five years, the Sorger lab has received research funding from Novartis and Merck. Sorger declares that none of these relationships are directly or indirectly related to the content of this manuscript. E.A.M. is on the SAB for AstraZeneca/Medimmune, Celgene, Genentech/Roche, Genomic Health (now Exact Sciences), Merck, Peregrine Pharmaceuticals, SELLAS Lifescience, and Tapimmune, is on steering committees for Bristol Myers Squibb and Roche/Genentech, has clinical trial support to her former institution (MD Anderson Cancer Center) from AstraZeneca/Medimmune, EMD-Serono, Galena Biopharma, and Genentech, has Genentech and Gilead support to a SU2C grant, and has sponsored Research Support to the laboratory from Glaxo-Smith Kline (GSK) and Eli Lilly. J.L.G. is a consultant for GSK, Codagenix, Duke Street Bio, and Array BioPharma/Pfizer and has received sponsored research support from GSK, Array BioPharma/Pfizer, Eli Lilly, and Merck. S.S. and K.S. report no relevant disclosures. S.M.T.: Consulting or Advisory Role: Novartis, Pfizer, Merck, Lilly, Nektar, NanoString Technologies, AstraZeneca, Puma Biotechnology, Genentech/Roche, Eisai, Sanofi Genzyme, Bristol Myers Squibb, Seattle Genetics, Odonate Therapeutics, OncoPep, Kyowa Hakko Kirin, Samsung Bioepis, CytomX Therapeutics, Daiichi Sankyo, Athenex, Gilead, Mersana, Certara, Chugai Pharma, Ellipses Pharma, Infinity, 4D Pharma, OncoSec Medical Inc., BeyondSpring Pharmaceuticals, OncXerna, Zymeworks, Zentalis, Blueprint Medicines, Reveal Genomics, ARC Therapeutics; Institutional Research Funding: Genentech/Roche, Merck, Exelixis, Pfizer, Lilly, Novartis, Bristol Myers Squibb, Eisai, AstraZeneca, NanoString Technologies, Cyclacel, Nektar, Gilead, Odonate Therapeutics, Sanofi, Seattle Genetics.
Figures
Similar articles
-
Development and evaluation of a novel RT-qPCR based test for the quantification of HER2 gene expression in breast cancer.Gene. 2017 Mar 20;605:114-122. doi: 10.1016/j.gene.2016.12.027. Epub 2016 Dec 28. Gene. 2017. PMID: 28039034
-
Intratumoral Heterogeneity and Immune Response Indicators to Predict Overall Survival in a Retrospective Study of HER2-Borderline (IHC 2+) Breast Cancer Patients.Front Oncol. 2021 Nov 11;11:774088. doi: 10.3389/fonc.2021.774088. eCollection 2021. Front Oncol. 2021. PMID: 34858854 Free PMC article.
-
Multi-institutional TSA-amplified Multiplexed Immunofluorescence Reproducibility Evaluation (MITRE) Study.J Immunother Cancer. 2021 Jul;9(7):e002197. doi: 10.1136/jitc-2020-002197. J Immunother Cancer. 2021. PMID: 34266881 Free PMC article.
-
HER2 testing in breast cancer: NCCN Task Force report and recommendations.J Natl Compr Canc Netw. 2006 Jul;4 Suppl 3:S1-22; quiz S23-4. J Natl Compr Canc Netw. 2006. PMID: 16813731 Review.
-
HER2 Intratumoral Heterogeneity in Breast Cancer, an Evolving Concept.Cancers (Basel). 2023 May 9;15(10):2664. doi: 10.3390/cancers15102664. Cancers (Basel). 2023. PMID: 37345001 Free PMC article. Review.
Cited by
-
Tumor-immune partitioning and clustering algorithm for identifying tumor-immune cell spatial interaction signatures within the tumor microenvironment.PLoS Comput Biol. 2025 Feb 18;21(2):e1012707. doi: 10.1371/journal.pcbi.1012707. eCollection 2025 Feb. PLoS Comput Biol. 2025. PMID: 39965007 Free PMC article.
-
Intra-tumoral spatial heterogeneity in breast cancer quantified using high-dimensional protein multiplexing and single cell phenotyping.Breast Cancer Res. 2025 May 21;27(1):88. doi: 10.1186/s13058-025-02038-1. Breast Cancer Res. 2025. PMID: 40399910 Free PMC article.
-
COEXIST: Coordinated single-cell integration of serial multiplexed tissue images.PLoS Comput Biol. 2025 Aug 5;21(8):e1013325. doi: 10.1371/journal.pcbi.1013325. eCollection 2025 Aug. PLoS Comput Biol. 2025. PMID: 40763304 Free PMC article.
-
Development of a prediction model for HER2 low breast cancer using quantitative intra- and peri-tumoral heterogeneity and MRI features on high-spatial resolution ultrafast DCE-MRI.Quant Imaging Med Surg. 2025 Sep 1;15(9):7788-7802. doi: 10.21037/qims-24-976. Epub 2025 Aug 18. Quant Imaging Med Surg. 2025. PMID: 40893528 Free PMC article.
-
Preoperative prediction of extensive intraductal component in invasive breast cancer based on intra- and peri-tumoral heterogeneity in high-resolution ultrafast DCE-MRI.Sci Rep. 2024 Jul 29;14(1):17396. doi: 10.1038/s41598-024-68601-6. Sci Rep. 2024. PMID: 39075278 Free PMC article.
References
Grants and funding
LinkOut - more resources
Full Text Sources
Research Materials
Miscellaneous
