. 2024 Jun;20(6):689-698.
doi: 10.1038/s41589-023-01504-1. Epub 2024 Jan 2.

Short-range translocation by a restriction enzyme motor triggers diffusion along DNA

Affiliations

Short-range translocation by a restriction enzyme motor triggers diffusion along DNA

Martin Göse et al. Nat Chem Biol. 2024 Jun.

Abstract

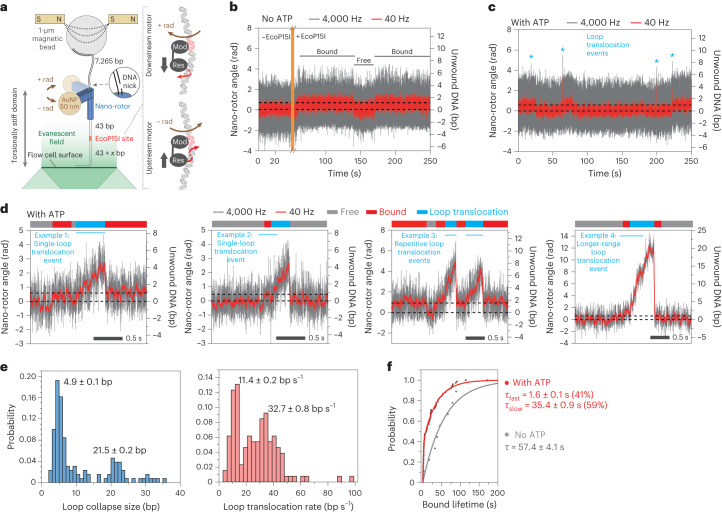
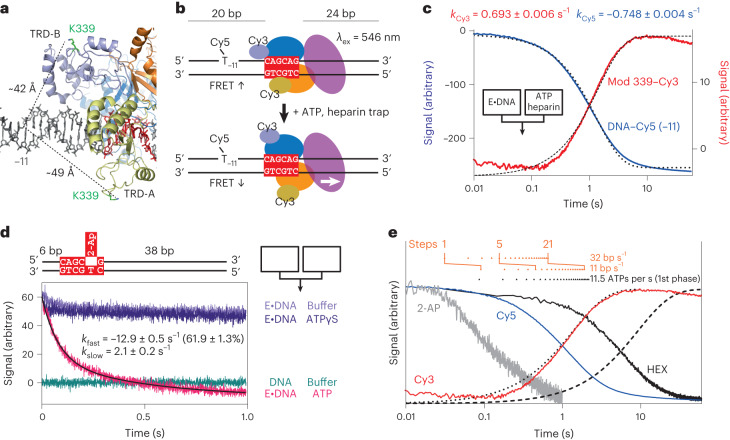
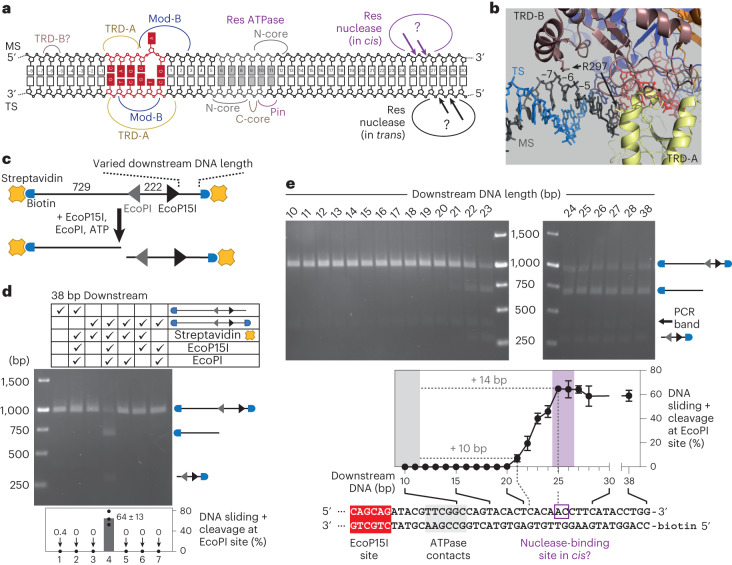
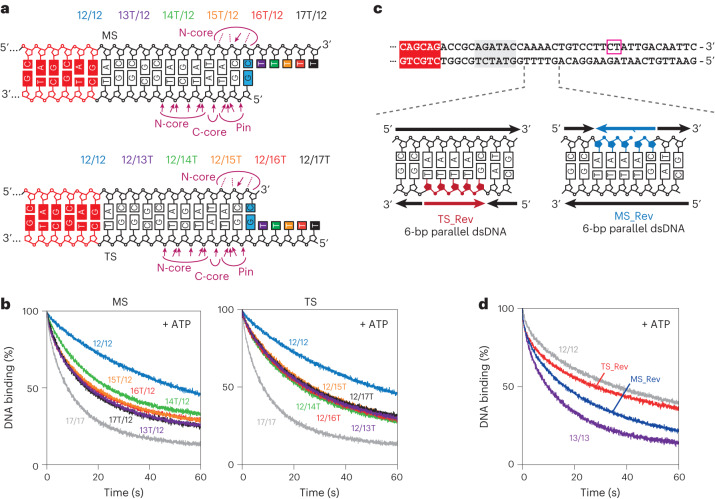
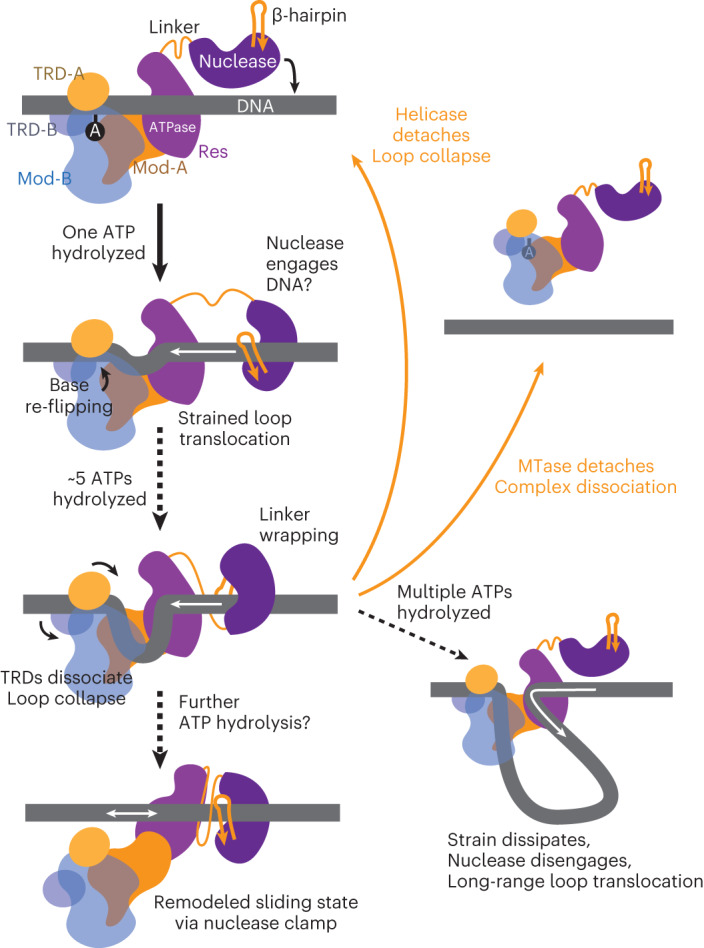
Cleavage of bacteriophage DNA by the Type III restriction-modification enzymes requires long-range interaction between DNA sites. This is facilitated by one-dimensional diffusion ('DNA sliding') initiated by ATP hydrolysis catalyzed by a superfamily 2 helicase-like ATPase. Here we combined ultrafast twist measurements based on plasmonic DNA origami nano-rotors with stopped-flow fluorescence and gel-based assays to examine the role(s) of ATP hydrolysis. Our data show that the helicase-like domain has multiple roles. First, this domain stabilizes initial DNA interactions alongside the methyltransferase subunits. Second, it causes environmental changes in the flipped adenine base following hydrolysis of the first ATP. Finally, it remodels nucleoprotein interactions via constrained translocation of a ∼ 5 to 22-bp double stranded DNA loop. Initiation of DNA sliding requires 8-15 bp of DNA downstream of the motor, corresponding to the site of nuclease domain binding. Our data unify previous contradictory communication models for Type III enzymes.


Conflict of interest statement

The authors declare no competing interests.

Figures

Fig. 1
Fig. 1. Measurement of DNA loop translocation by EcoP15I.
a, Left, DNA origami nano-rotor assembly. An EcoP15I target site DNA was attached to the flow cell surface and a nano-rotor consisting of a DNA origami nanostructure with a 56-nm rotor arm and an attached 50-nm AuNP. A paramagnetic bead was attached to a 7.5 kb DNA spacer, allowing force application via two external magnets. Nano-rotor rotations were determined by imaging backscattered light from the AuNP. Right, schematic representation of expected rotation changes upon downstream (top) or upstream (bottom) Res movement, assuming the Mod subunit remains attached and there is no twist compliance in the Res–Mod interactions. b, Time trajectory of nano-rotor angular position (gray, at 4,000 Hz; red, after 100-point sliding average ≜ 40 Hz) without EcoP15I and with 4.66 nM EcoP15I. A reversible positive rotational shift of 0.60 ± 0.18 rad (1.0 ± 0.3 bp) is observed with EcoP15I, which we identified as the ‘DNA-bound’ state. c, Time trajectory of the nano-rotor angular position with EcoP15I and ATP. In addition to free and bound states, sawtooth-like loop translocation events were also detected (blue asterisks). d, Representative examples of different loop translocation events. Bars identify different EcoP15I–DNA interaction states (gray, free state; red, bound state; blue, loop translocation). Loop translocation occurred as short-range single events terminating in a bound (example 1) or free (example 2) state, or clustered short-range events (example 3) and long-range events (example 4). e, Maximum loop size and loop translocation rate exhibiting bimodal distributions, with mean values of: 4.9 ± 0.1 bp and 21.5 ± 0.2 bp for length and 11.4 ± 0.2 bp s−1 and 32.7 ± 0.8 bp s−1 for translocation rate (n = 130; errors, s.e.). f, Probability distribution of bound state lifetime without ATP (gray, n = 9) and with ATP (red, n = 76). Average lifetimes of 57.4 ± 4.1 s (without ATP) and 21.5 s (with ATP, 41% at 1.6 ± 0.1 s and 59% at 35.4 ± 0.9 s) were obtained by single-exponential (without ATP) or double-exponential (with ATP) curve fitting (errors, s.e.).
Fig. 2
Fig. 2. Nucleoprotein conformation changes during the first ATPase burst.
a, Cropped view of the structure from ref. . Protein domains are shown as cartoons, colored as in Extended Data Fig. 1a, and DNA is shown as sticks in black and red. The K339 residues from both TRDs are shown as green sticks, with dotted lines indicating the approximate distance to the major groove of the base −11 bp from the recognition site (red). b, Cartoon of the oligoduplex used in the FRET assay. The MS was labeled at the dT position −11 with Cy5, and K339 was labeled with Cy3. Movement of the TRDs reduces the FRET. c, Stopped-flow fluorescence measurements of a pre-formed EcoP15I 339–Cy3 and Cy5–oligoduplex (E·DNA) complex mixed with ATP and heparin trap. Cy3 (red) and Cy5 (blue) emission fluorescence signals were fitted to single exponentials (dotted lines) to give the rate constants indicated (errors, s.e.m.). d, Cartoon of the oligoduplex used in the 2-aminopurine (2-AP) assay. 2-Aminopurine emission signals are shown for stopped-flow fluorescence measurements mixed according to the color key (right). The ATP trace was fitted to a double exponential (black line) to give the rate constants indicated (errors, s.e.m.). e, Comparison of EcoP15I kinetics. Cy5 (blue) and Cy3 (red) FRET data shown are from c; 2-aminopurine data (gray) shown are from d; hexachlorofluoroscein (HEX) anisotropy DNA dissociation data (black) using substrate 38/38 shown are from Supplementary Fig. 8; First phase ATPase burst kinetics (black dotted line) and second phase ATPase kinetics (dashed line) using substrate 38/38 from Supplementary Fig. 9. Cumulative ATP hydrolysis steps for the first phase are also shown as black triangles; cumulative stepping events calculated from the fast and slow translocation rates in Fig. 1e are shown as orange triangles. The first, fifth and 21st steps are indicated.
Fig. 3
Fig. 3. Effect of upstream and downstream DNA on DNA sliding and cleavage.
a, Locations of protein–DNA contacts (curved lines) from Protein Data Bank (PDB) 4ZCF (ref. ). Nuclease contacts at the DNA cleavage sites (arrows) are not known. TRD-B upstream contacts are defined in b. b, Cropped view of PDB 4ZCF with the upstream DNA extended using B-form DNA (PDB 1BNA). Proteins are shown as cartoons, R297 in each TRD is shown as a stick, and DNA is shown as sticks (MS gray; TS, blue; recognition site, red). c, DNA substrate design with sites for EcoP15I (5ʹ-CAGCAG-3ʹ top strand sequence, black) and EcoPI (5ʹ-GGTCT-3ʹ top strand sequence, gray) in tail-to-tail orientation. The distance upstream of the EcoP15I site was varied from 10 to 38 bp. DNA ends were labeled with biotin (blue) and capped with streptavidin (orange). d, DNA labeled with biotin at one or both ends was mixed with streptavidin, EcoP15I or EcoPI as indicated. Reactions were quenched after 1 h and DNA was separated by agarose gel electrophoresis (representative gel; n = 3 repeats). Mean EcoPI site cleavage was quantified from n = 3 repeats (error bars, s.d.). Cleavage at the EcoP15I site was not possible. e, Cleavage reactions were carried out for 1 h using DNA capped at both ends with varying downstream DNA lengths as indicated. DNA was separated by agarose gel electrophoresis (representative gel; n = 3 repeats) and mean DNA cleavage was quantified from n = 3 repeats (error bars, s.d.).
Fig. 4
Fig. 4. Effect of downstream DNA on DNA binding and ATPase activity.
a, Example substrates with varying downstream DNA lengths shown as the duplex MS sequence with colors indicating substrate classifications. Data are grouped into columns according to classifications (see main text). Substrates are named according to Supplementary Fig. 13. Pi, phosphate. b, Examples of the release of prebound enzyme from its target site with heparin trap and with (+) or without (−) ATP, measured using HEX anisotropy. Data are the average of two independent repeats (Supplementary Fig. 8). c, Examples of ATP hydrolysis by prebound enzyme measured by phosphate release. Data were corrected for the heparin background (Supplementary Fig. 9) apart from 11/11 and 12/12, which are shown uncorrected. d, Downstream length-dependence of DNA dissociation measured as the time to reach 50% with or without ATP and the number of ATPs consumed during the first ATPase phase. Circles show fitted parameters from two repeat experiments. Full kinetic parameters are in Supplementary Fig. 14.
Fig. 5
Fig. 5. DNA strand dependence of translocation.
a, Oligoduplex substrates (upstream 6 bp of DNA not shown) with a poly(dT) extended MS (top) or TS (bottom). Curved lines show regions of Res–DNA contact from PDB 4ZCF (ref. ) with arrows indicating side chain contacts and dashed lines indicating main chain contacts. b, Release of prebound EcoP15I from its target site with ATP and the heparin trap measured using HEX anisotropy. The 12/12 DNA was extended on either MS (left) or TS (right) and compared to 12/12 and 17/17. c, Cartoon of 50-bp oligoduplex substrates (upstream 6 bp of DNA not shown) with a 5-nucleotide stretch of reversed-polarity backbone on the MS (MS_Rev) or TS (TS_Rev) immediately downstream of the initial helicase-like motor-binding site (Fig. 3a). d, Release of prebound enzyme from its target site with ATP and the heparin trap measured using HEX anisotropy. The reversed-polarity DNAs were compared to 12/12 and 13/13.
Fig. 6
Fig. 6. Model for activation of DNA sliding by EcoP15I by short-range dsDNA loop translocation.
Given the well-defined cis cleavage site 25–26 bp downstream of the recognition site on the MS, the nuclease domain should engage the DNA early in the pathway. Hydrolysis of the first ATP and the start of loop translocation returns the flipped adenine to the DNA. Further translocation leads to strain, resulting in helicase dissociation and loop collapse; dissociation of the whole complex; dissipation of strain and formation of a larger translocating loop; or dissociation of the TRDs, loop collapse and translocation without looping. Only the latter allows the motor domain to engage the nuclease to remodel the DNA contacts and to produce a diffusing state that can activate cleavage at a distant DNA site. During translocation following the helical path, the linker may be wrapped around the DNA to support sliding clamp formation, as seen for Mfd.
Extended Data Fig. 1
Extended Data Fig. 1. Structural and kinetic features of EcoP15I.
a, Escherichia coli EcoP15I structure (PDB: 4ZCF) with ModA (orange), Target Recognition Domain-A (TRD-A) (yellow), ModB (blue), TRD-B (light blue), and Res and the Pin domain (magenta) as protein cartoons and DNA (black and blue) as sticks. The nuclease domain was not fully resolved in PDB:4ZCF and is indicated by an oval. b, Transparent protein surface view in the same orientation as panel a, with DNA shown as sticks with the translocating strand (TS, blue), methylating strand (MS, black) and recognition site (red), indicated. The eye symbol indicates the direction of the view in panel c. c, SF2 helicase-like ATPase domain of Res viewed along the DNA axis (sticks in blue and black) with the N-core RecA (grey), C-core RecA (wheat) and Pin (purple) sub-domains shown as protein cartoons. The helicase-like motifs I (Walker A, red), Ia (green), II (Walker B, yellow), III (purple), V (orange) and VI (light blue) indicated. d, Kinetic constants measured during binding, initiation, sliding and re-isomerisation from Refs. ,. D1D is the diffusion coefficient for DNA sliding. DNA is in black; EcoP15I coloured as in panel a, or in green/grey for the isomerised sliding states. With ATP, there is a first phase of ATPase activity of ∼1 s in which ∼10–15 ATPs are consumed. Following a delay, the enzyme leaves the site and enters a long-lived DNA sliding state that retains the enzyme orientation without a requirement for further ATP binding or hydrolysis,. If a sliding enzyme collides head-to-head with an enzyme bound at a distant site so that the nuclease domains can dimerise, and the second enzyme can hydrolyse ATP,, DNA cleavage occurs. Collisions with enzymes in incorrect orientations or with other sliding enzymes do not permit cleavage,,.
Extended Data Fig. 2
Extended Data Fig. 2. DNA loop translocation properties.
a, Further examples of translocation events measured with the nano-rotor assay (grey, at 4000 Hz; red, after 100-point sliding average ≜40 Hz) after the addition of 4.66 nM EcoP15I. b, Distribution of the loop translocation time (Δtloop translocation) with a mean time of 373 ± 14 ms (n = 130, errors s.e.). c-e, Plots of the loop translocation rate vs. loop collapse size (panel c), Δtloop translocation vs loop collapse size (panel d) and the loop translocation rate vs Δtloop translocation (panel e) plotted for individual events. The loop translocation time increased with the loop collapse size, consistent with a constant stepwise translocation rate, whereas the other parameters did not follow a trend. f, (left panel) Time trajectory of the angular position of the nano-rotor including long loop translocation events with loop collapse sizes of >40 bp. Asterisk marks the event shown in the right panel. (right panel) Trajectory of the angular position of the nano-rotor for the long loop translocation event shown together with the length of the DNA construct revealing the DNA length reduction upon loop translocation. The loop collapse size of ∼77 bp matches with the apparent DNA length reduction of 24.5 nm (∼72 bp) assuming helix translocation with 1 bp ≈ 0.34 nm. g, Probabilities that loop translocation events started and ended either in the free or bound state (n = 113). Only 5% of loop translocation events started in the free state and 95% in the bound state. 77% of loop translocation events terminated in a bound state and 23% in the free state. h, The bound state after loop translocation exhibited a bi-exponential lifetime distribution with an average lifetime of ∼2.3s (37%: 0.17 ± 0.02 s and 63%: 3.5 ± 0.2 s; n = 54, errors, s.e.).
Extended Data Fig. 3
Extended Data Fig. 3. A nick in either strand of the translocated loop does not significantly affect ATP-dependent DNA dissociation.
a, Nicked oligoduplex substrates. 38N/38 (upper), nicked on the MS 4 bp downstream of the recognition site, was made by annealing the DNA oligonucleotides Nick3_Fwd_Hex, N35_Fwd_Phos and 38_Rev (Supplementary Tables 5, 6). 38/38N (lower), nicked on the TS 4 bp downstream of the recognition site, was made by annealing 38_Fwd_Hex, N23_Rev and N15_Rev_Phos (Supplementary Tables 5, 6). b, Release of prebound enzyme from its target site with ATP and heparin measured using stopped flow fluorescence anisotropy. Data is the average of two independent repeats.
Extended Data Fig. 4
Extended Data Fig. 4. EcoP15I cannot displace streptavidin from biotin-labelled DNA despite its translocase activity.
a, DNA substrate (Fig. 3c), with a single EcoP15I site 13 bp from the DNA end and with three sites for the Type ISP restriction enzyme LlaGI (5ʹ-CTnGAYG-3ʹ) in direct repeat (purple) where arrowheads indicate the direction of ATP-dependent LlaGI translocation. The 13 bp spacing was chosen to be within the average loop translocation distance of EcoP15I (Fig. 1). The grey box indicates the helicase binding site. EcoP15I or LlaGI were pre-incubated with the DNA and then the reaction started with ATP and free biotin. If motor activity displaced the streptavidin from the biotin-labelled DNA end, the released streptavidin would be bound by the free biotin and unable to rebind the DNA. b, Example agarose gel (from 3 repeats) of reactions with 8 nM DNA and the order of addition shown for 855 nM streptavidin (yellow), 17.1 µM free biotin (blue), EcoP15I (from left to right, 264, 528 or 792 nM), nuclease mutant LlaGI D78A (50 nM) and/or ATP and biotin mix (4 mM and 17.1 µM, respectively). DNA with none, one or two streptavidin molecules can be separated. The average relative intensities of the three species were quantified (n = 3, errors, s.d.). Free biotin was sufficient to prevent streptavidin binding to the DNA ends (lane 3). Increasing concentrations of EcoP15I did not displace the streptavidin (lanes 4-6). Contrastingly, LlaGI can displace >80% of the streptavidin from one DNA end (lane 7) consistent with the expected directional translocation. Lane 2 shows incomplete biotin labelling of both DNA ends. Lanes 1 and 8 are the same control marker.
Extended Data Fig. 5
Extended Data Fig. 5. Downstream DNA-length dependence of sliding state formation.
a, EcoP15I-DNA binding and ATP-dependent dissociation schemes that either do (upper) or do not (lower) produce a sliding state. b, Substrates with varying downstream DNA lengths shown as the duplex MS sequence. Substrates named according to Supplementary Fig. 13. Cartoon shows the stopped-flow rapid mixing regime. c, Binding kinetics of EcoP15I to its target site with ATP. Data is the average of three independent repeats. The 16/16 and 17/17 data were fitted to a double exponential by nonlinear regression: 16/16 Plateau = 68.1 ± 0.0 %, Fast phase = 88.0 ± 0.3 %, kfast = 2.90 ± 0.03 s1, kslow = 0.20 ± 0.01 s1; 17/17 Plateau = 61.3 ± 0.1 %, Fast phase = 75.1 ± 1.2 %, kfast = 3.50 ± 0.08 s, kslow = 0.64 ± 0.10 s1 (errors, s.e.m.). The 18/18 to 38/38 data were fitted to the upper scheme in panel a by numerical integration (parameters in panel d). For 18/18, only a fraction of dissociated species underwent the recycling. d, Fitted mean parameter values for the 18/18 to 38/38 data from panel c (errors, s.d., n = 3). For fitting the 18/18 data, krecycle was fixed at 0.04 /s and a fraction of dissociated species could bypass this state (37 ± 7%, errors, s.d., n = 3).
Extended Data Fig. 6
Extended Data Fig. 6. N-core RecA contacts to the methylating strand backbone are necessary for stable DNA association.
a, Cartoon of the sequences of the DNA substrates with an extended MS (upstream DNA sequence not shown). 10(P3ʹ)/10 had an MS with 10 nt downstream and a 3ʹ phosphate. Curved lines show regions of Res-DNA contact from PDB:4ZCF with arrows indicating side chain contacts and dotted lines indicating main chain contacts. b, Release of prebound enzyme from its target site with heparin trap and with (left) or without (right) ATP measured using HEX anisotropy. The weakly-bound 10/10 DNA was extended on the MS strand. An additional 3ʹ phosphate produces a small increase in stability but the additional base at position 11 is also important, possibly to help orient the phosphate-T237 interaction. Further extension of the MS has only a moderate effect. c, Cartoon of DNA substrates with an extended TS (upstream DNA sequence not shown). d, Release of prebound enzyme from its target site with heparin trap and with (left) or without (right) ATP measured using HEX anisotropy. Extension of the TS strand had little effect compared to the weakly-bound 10/10 DNA. One representative dataset shown from two independent repeats.
Extended Data Fig. 7
Extended Data Fig. 7. Structural models for the nuclease lobe of the EcoP15I Res subunit.
a, Domain arrangement of Res determined from the crystal structure and the Alphafold 2 structural predictions (Supplementary Figs. 15, 16),. b, Ribbon diagram views of an Alphafold 2 prediction of the Endonuclease Lobe structure shown in two orientations. The dashed circle indicates the diameter of B-form dsDNA that could fit within the clamp formed by the β-hairpin and Linker, placing the nucleic acid near the PDExK nuclease active site residues P892, D898, E916 and K918 (red sticks). c, Five predicted models (Supplementary Fig. 16) aligned using the nuclease fold showing relative disorder/lower confidence in the placement of the β-hairpin and Linker.
Extended Data Fig. 8
Extended Data Fig. 8. Alignment of the rank_1 AlphaFold 2 structure to the EcoP15I crystal structure.
a, Alignment of rank_1 (green) to PDB:4ZCF (blue) via the helicase lobe (residues 1–594). (inset) Rotated alignment to show that the Endonuclease Lobe of rank_1 clashes with ModA of PDB:4ZCF (pink). Clashes are also seen for other predicted structures. b, Alignment of rank_1 (green) to the partial nuclease regions of PDB:4ZCF; (discontinuous residues 620–633, 667–705, 744–774, 804–810) in blue with the helicase lobe (residues 1–594) in grey.

References

    1. Singleton MR, Dillingham MS, Wigley DB. Structure and mechanism of helicases and nucleic acid translocases. Annu. Rev. Biochem. 2007;76:23–50. doi: 10.1146/annurev.biochem.76.052305.115300. - DOI - PubMed
    1. Linder P, Jankowsky E. From unwinding to clamping - the DEAD box RNA helicase family. Nat. Rev. Mol. Cell Biol. 2011;12:505–516. doi: 10.1038/nrm3154. - DOI - PubMed
    1. Byrd AK, Raney KD. Superfamily 2 helicases. Front Biosci. (Landmark Ed.) 2012;17:2070–2088. doi: 10.2741/4038. - DOI - PMC - PubMed
    1. Harada BT, et al. Stepwise nucleosome translocation by RSC remodeling complexes. Elife. 2016;5:e10051. doi: 10.7554/eLife.10051. - DOI - PMC - PubMed
    1. Yan L, Chen Z. A unifying mechanism of DNA translocation underlying chromatin remodeling. Trends Biochem. Sci. 2020;45:217–227. doi: 10.1016/j.tibs.2019.09.002. - DOI - PubMed

Publication types

MeSH terms