. 2024 Jan;30(1):117-129.
doi: 10.1038/s41591-023-02659-z. Epub 2024 Jan 2.

A candidate antibody drug for prevention of malaria

Affiliations

A candidate antibody drug for prevention of malaria

Katherine L Williams et al. Nat Med. 2024 Jan.

Abstract

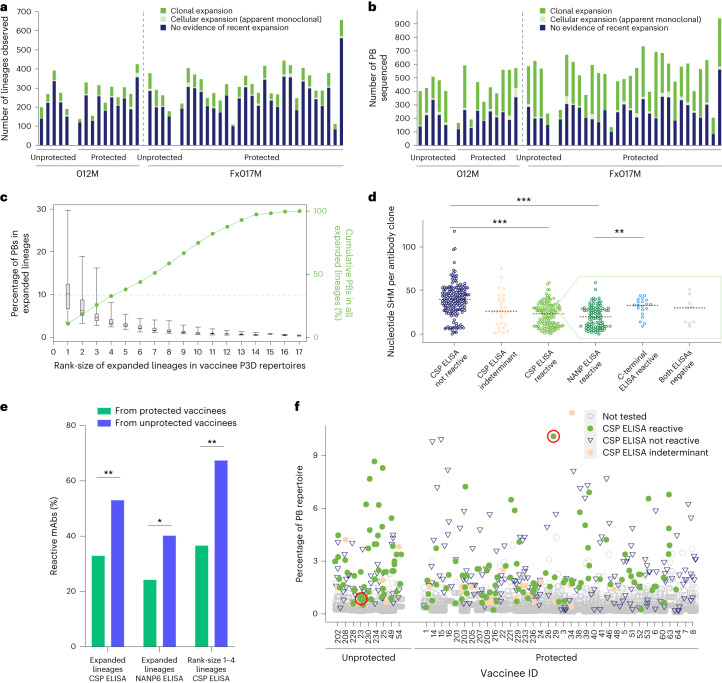
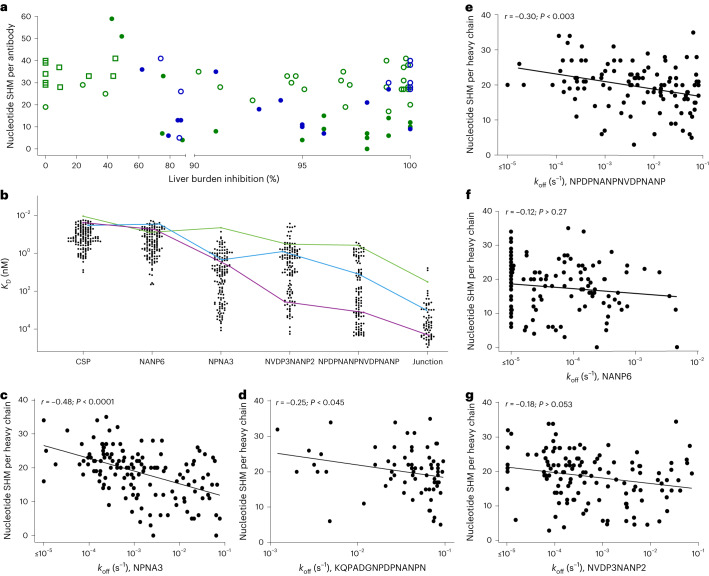
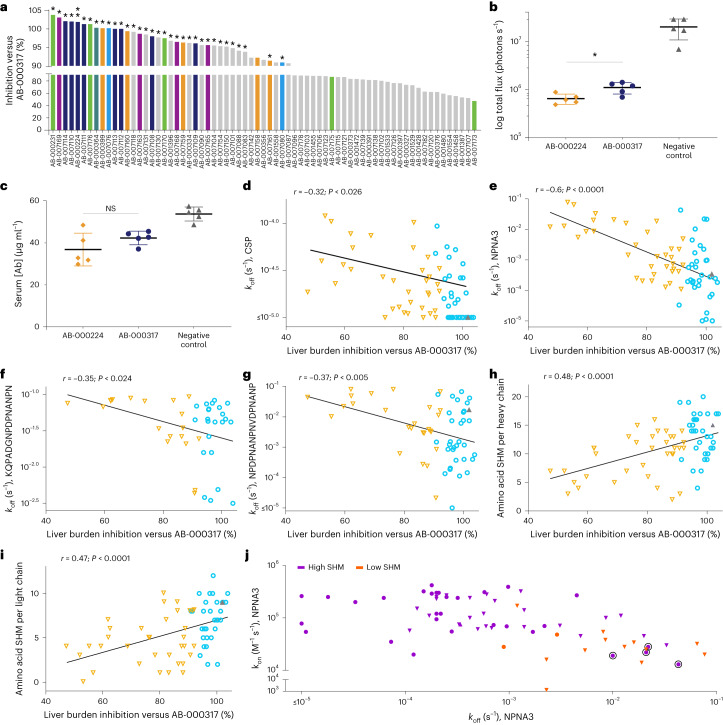
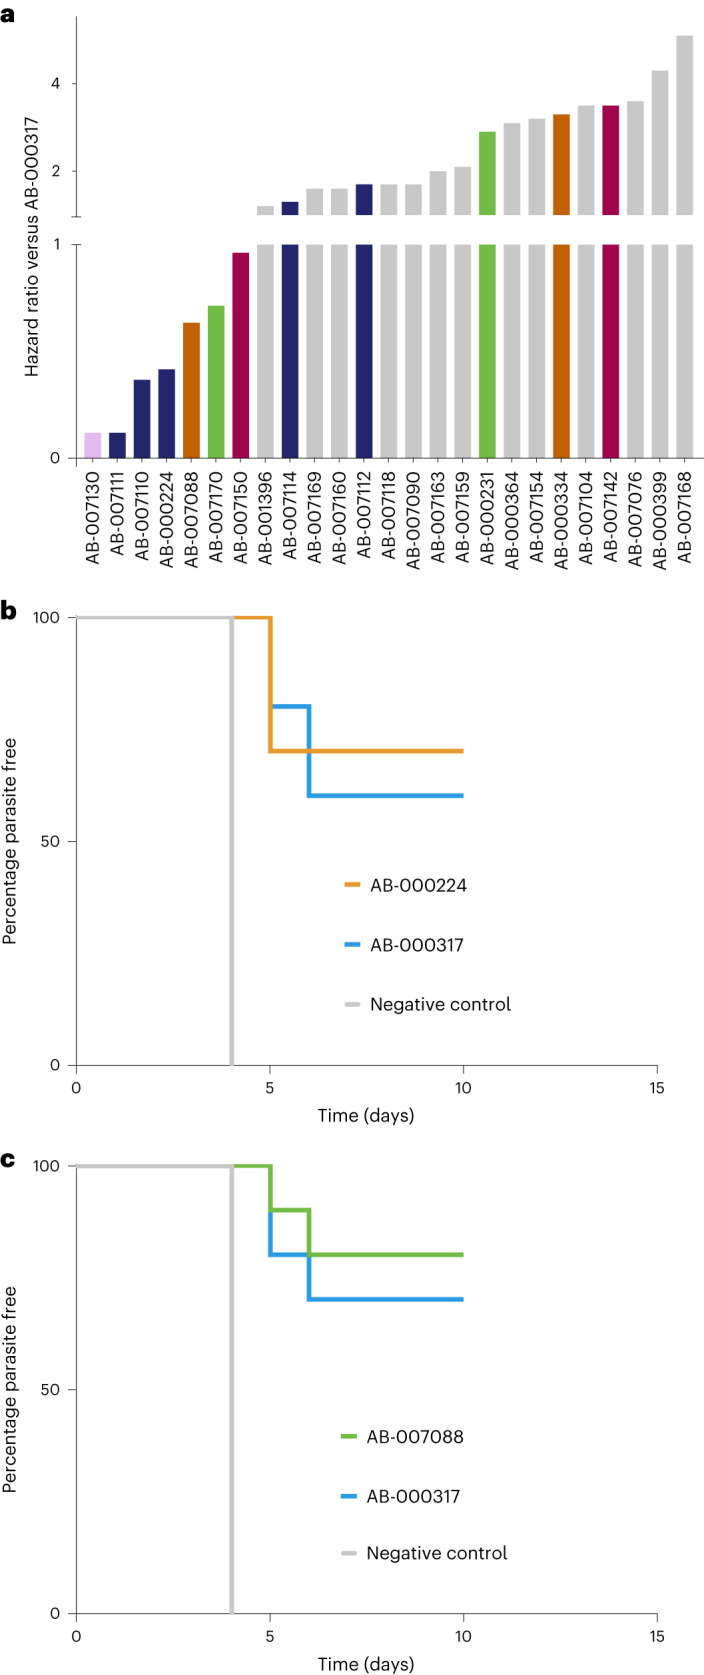
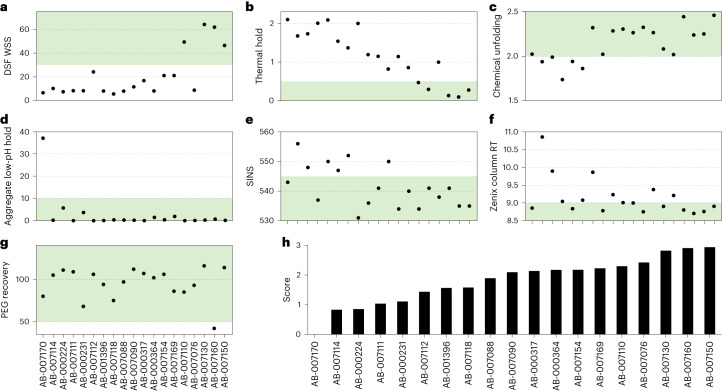
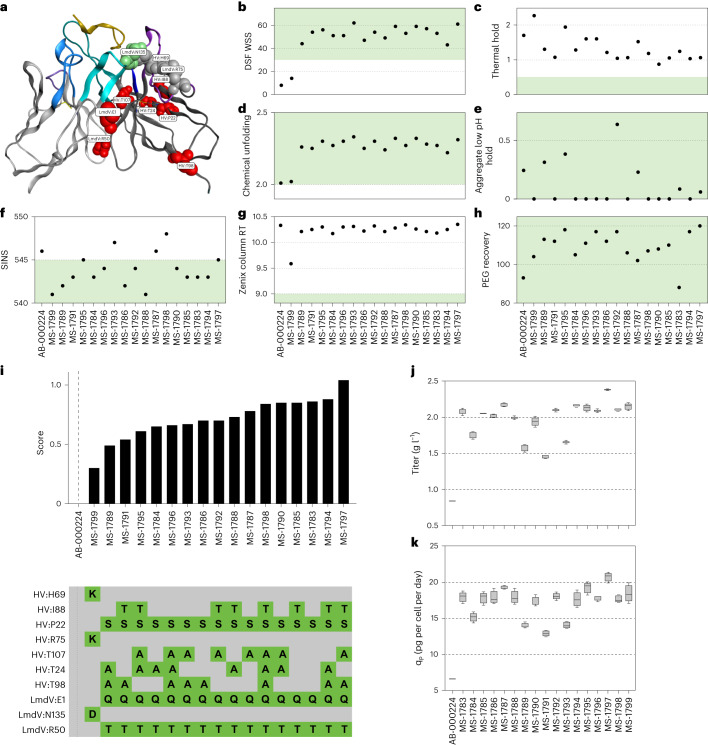
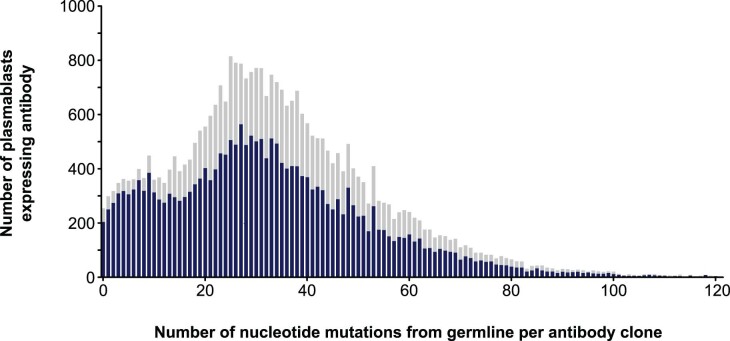
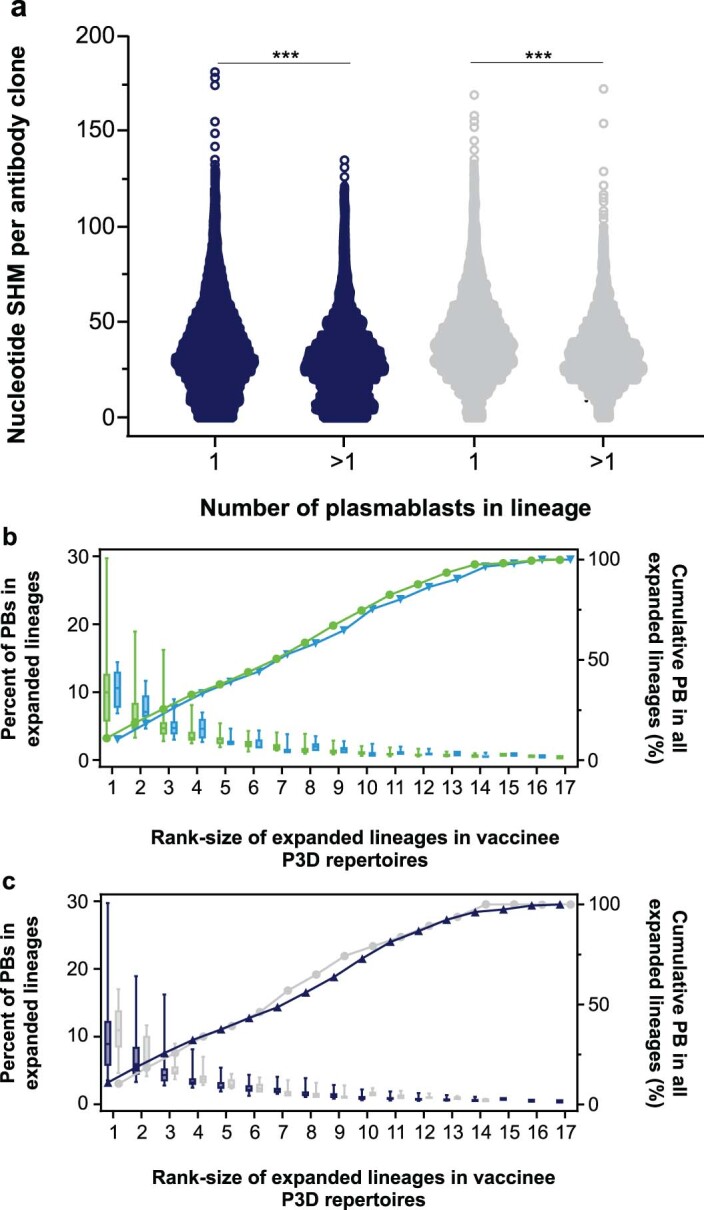
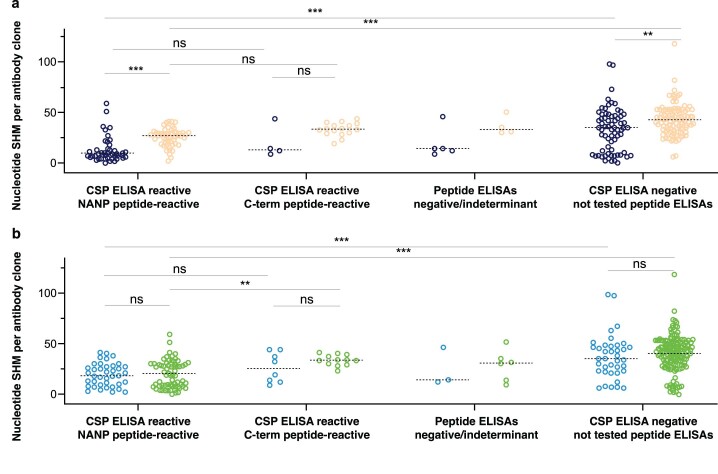
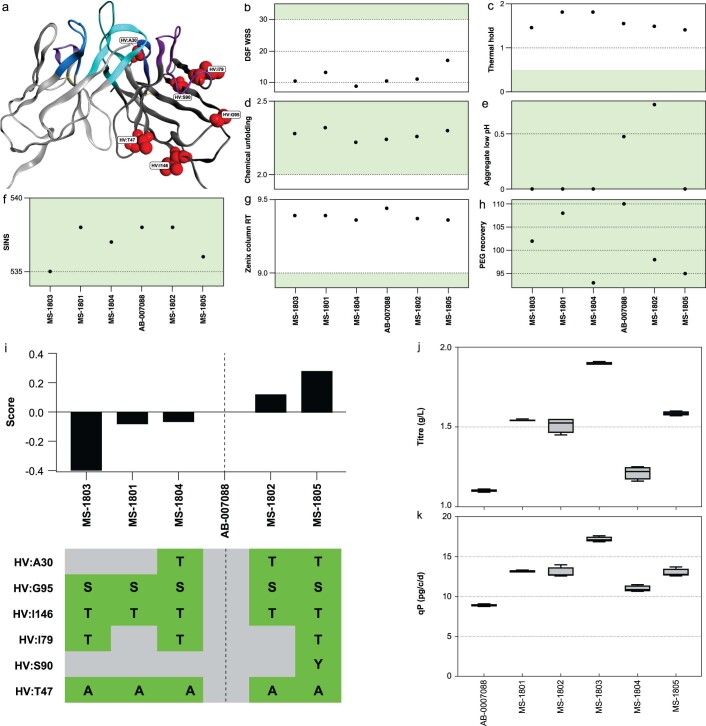
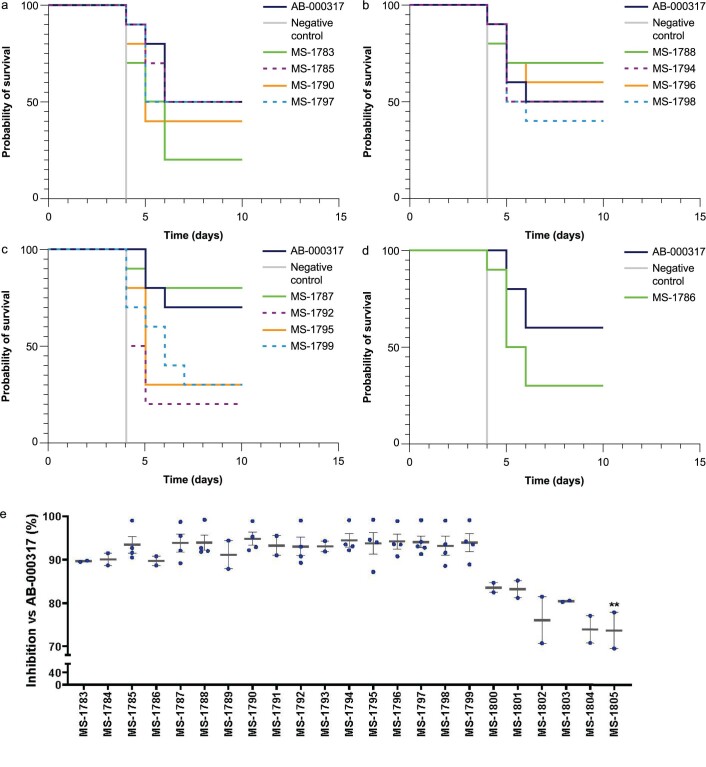
Over 75% of malaria-attributable deaths occur in children under the age of 5 years. However, the first malaria vaccine recommended by the World Health Organization (WHO) for pediatric use, RTS,S/AS01 (Mosquirix), has modest efficacy. Complementary strategies, including monoclonal antibodies, will be important in efforts to eradicate malaria. Here we characterize the circulating B cell repertoires of 45 RTS,S/AS01 vaccinees and discover monoclonal antibodies for development as potential therapeutics. We generated >28,000 antibody sequences and tested 481 antibodies for binding activity and 125 antibodies for antimalaria activity in vivo. Through these analyses we identified correlations suggesting that sequences in Plasmodium falciparum circumsporozoite protein, the target antigen in RTS,S/AS01, may induce immunodominant antibody responses that limit more protective, but subdominant, responses. Using binding studies, mouse malaria models, biomanufacturing assessments and protein stability assays, we selected AB-000224 and AB-007088 for advancement as a clinical lead and backup. We engineered the variable domains (Fv) of both antibodies to enable low-cost manufacturing at scale for distribution to pediatric populations, in alignment with WHO's preferred product guidelines. The engineered clone with the optimal manufacturing and drug property profile, MAM01, was advanced into clinical development.


Conflict of interest statement

W.H.R. owns equity in, serves as a consultant to and is a member of the Board of Directors of Atreca, Inc. K.L.W., S.G., K.S.W. and S.M.L. own equity in, and are employed by, Atreca, Inc. D.E.E. and M.W. own equity in, and serve as consultants to, Atreca, Inc. G.C. and D.K. own equity in Atreca, Inc. C.S., P.S., S.Z.J. and R.R.K. are employed by Just – Evotec Biologics. E.J. owns equity in, and is employed by, GSK. U.W.-R. is employed by BioNTech. J.G. owns equity in, is employed by and is a member of the Board of Directors of Centivax, Inc. Y.C.T. owns equity in Atreca, Inc. and is employed by Nuevocor Pte. Ltd. K.L.W., S.M.L., R.R.K. and D.E.E. are coinventors on patent applications filed by Atreca, Inc. that include antibodies to CSP. The remaining authors declare no competing interests.

Figures

Fig. 1
Fig. 1. CSP-reactive lineages from blood PBs following the third dose of RTS,S.
a,b, IgG lineages for each vaccinee (bars, n = 45) that are clonally expanded (that is, have two or more distinct nucleotide clones; green), that consist of two or more identical nucleotide clones (gray) or that contain only one observed PB (blue) are shown by either number of lineages (a) or number of PBs per vaccinee (b). c, By vaccinee (n = 45), the size of each expanded lineage was calculated by dividing the number of PBs in that lineage (2–84 PBs per lineage) by the number in each vaccinee’s P3D-expanded lineage repertoire (37–492 PBs per vaccinee) and then assigning a rank-size. Boxes indicate interquartile ranges, lines within boxes are medians and whiskers represent minimum and maximum across vaccinees for each rank-size (44–1,246 PBs per rank, 22–301 lineages per rank). Dotted line indicates that the top four rank-size lineages contain 33% of PBs in all P3D-expanded lineages (n = 11,478 PBs, 2,662 lineages). de, ELISA reactivity, SHM levels and vaccinee protection status of mAbs from expanded lineages (n = 349). d, Number of nucleotide mutations from germline (SHM) for mAbs that are not reactive (dark blue, n = 185), show an indeterminant, weak signal (orange, n = 29) or are reactive (light green, n = 135) in a CSP ELISA. Domain specificity for CSP-reactive mAbs is shown in the box with a dashed green outline. Monoclonal antibodies reactive by ELISA to the NANP6 repeat-region peptide (dark green, n = 98), to the C-terminal region peptide (Pfs16, royal blue, n = 20) or not reactive in either peptide ELISA (gray, n = 9). Lines represent median values, ***P < 0.0001, **P < 0.001, unpaired two-tailed Mann–Whitney test. CSP-reactive mAbs that were not tested in peptide ELISAs (n = 8) are not shown. e, Percentage of tested antibodies from expanded lineages that originated from protected (green, n = 36) and unprotected (blue, n = 9) vaccinees that are CSP-reactive (82 out of 249, and 53 out of 100 mAbs, respectively), repeat-region NANP6 peptide-reactive (59 out of 244, and 39 out of 97 mAbs, respectively) and the subset from only dominant rank-size one to four lineages that are CSP-reactive (52 out of 142, and 31 out of 46 mAbs, respectively); **P < 0.001, *P < 0.01, two-tailed Fisher’s exact test. f, For each vaccinee (x axis), each symbol indicates a single lineage. The lineages (n = 369) from which a clone was selected for testing are indicated by CSP reactivity: CSP-reactive (green dots, n = 139), indeterminant (orange dots, n = 29) or not reactive (royal blue triangles, n = 201). All lineages that were not tested are shown (gray circles, n = 13,134; 2,313 expanded and 10,821 single-PB lineages). Protected vaccinees have a lower ratio of CSP-reactive versus nonreactive lineages than unprotected vaccinees (bootstrap analysis, P = 0.0011). Red circles indicate the two lineages containing the amino acid sequence of AB-000317.
Fig. 2
Fig. 2. Functional mAbs bind CSP-derived peptides not present in RTS,S.
a, Percentage inhibition in the sporozoite liver burden mouse model and number of nucleotide mutations from germline are shown for mAbs reactive to either NANP6 repeat-region peptide (circles, n = 67) and C-terminal-region peptide (squares, n = 10), and are indicated as originating from vaccinees who were either protected (green, n = 54) or unprotected (blue, n = 23) and who received either the standard (012M, closed symbols, n = 30) or fractional (Fx017M, open symbols, n = 47) dose. b, SPR-determined binding potencies (Kd) of mAbs (n = 141) selected from 35 of the most efficacious lineages tested against CSP and a panel of CSP-derived peptides that are either homologous (NANP6, NPNA3) or heterologous (NVDP3NANP2, NPDPNANPNVDPNANP, junction [KQPADGNPDPNANPN]) to RTS,S. Examples are shown of a mAb with a broadly promiscuous binding profile (green, AB-007163), another with a profile relatively biased toward homologous peptides (purple, AB-007143) and a third with a profile between these extremes (blue, AB-007175). cg, Simple two-tailed linear regression comparing the number of nucleotide mutations from germline (SHM) per heavy chain versus log-transformed SPR binding off-rate (koff) against peptides. c, Short, major repeat (NPNA3, n = 140). d, Junctional (KQPADGNPDPNANPN, n = 68). e, Short, minor repeat (NPDPNANPNVDPNANP, n = 109). f, Long, major repeat (NANP6, n = 141). g, Long, minor repeat (NVDP3NANP2, n = 129). See Extended Data Table 1 for correlation analyses with nontransformed data. Dissociation rate (koff) measurements were limited to a minimum of 10−5 s−1. MAbs, with rates ≤10−5 s−1 included in the graphic but excluded from correlation analyses.
Fig. 3
Fig. 3. In vitro binding, in vivo activity and SHM associated with developable mAbs.
ac, Liver burden model. a, Percentage inhibition compared with untreated, infected mice (geometric mean, n = 5, 100 μg per mouse) normalized to the activity of AB-000317 of n = 69 antibodies (32 lineages, *P > 0.05, **P < 0.05 activity greater than AB-000317, no icon P < 0.05 activity less than AB-000317, two-tailed, nonparametric log-rank), with colors other than gray indicating the six lineages containing the most efficacious mAbs. b,c, Example data from AB-000224 and AB-000317 of parasite bioluminescence in the liver (total flux, photons s1), *P = 0.03 (b) and serum concentrations (serum(Ab), μg ml1) of mAb at the time of sporozoite challenge (c), P > 0.2 (NS), mean ± s.d. (n = 5 mice), two-tailed Mann–Whitney test. di, Simple two-tailed linear regression of percentage liver burden inhibitory activity compared with untreated, infected mice (geometric mean, n = 5) and normalized to the activity of AB-000317, with each mAb indicated as having activity either significantly better (gray upward-pointing triangle), not different to (cyan circles) or weaker than (orange downward-pointing triangles) AB-000317 (two-tailed, nonparametric log-rank) versus dg, log-transformed binding off-rate (koff) against CSP (n = 70) (d), major repeat (NPNA3, n = 70) (e), junctional (KQPADGNPDPNANPN, n = 42) (f) and short minor-repeat (NPDPNANPNVDPNANP, n = 60) peptides (g) and versus h,i, the number of amino acid changes from germline (SHM) for each mAb (n = 69)—heavy (h) and light chain (i) (see Extended Data Table 1 for correlation analyses of non-log-transformed data). Dissociation rate (koff) measurements were limited to a minimum of 10−5 s−1 and mAbs were excluded from correlation analyses if assigned this value. j, log-transformed SPR binding off- (koff) versus on-rates (kon) against NPNA3 peptide of mAbs with either high SHM (purple, ≥20 nucleotide mutations per clone, n = 55) or low SHM (orange, <20 nucleotide mutations per clone, n = 14) and with activity weaker (downward-pointing triangles), not different to (circles) or better than (upward-pointing triangle) AB-000317 (two-tailed, nonparametric log-rank). mAbs from a lineage reported to bind CSP with Fab–Fab homotypic interactions are indicated (black circles, AB-000399 (refs. ,), AB-007159, AB-007160, AB-007161).
Fig. 4
Fig. 4. Inhibition of mosquito-bite parasitemia from mAbs prioritized for development.
a, Hazard ratios of n = 25 antibodies (14 lineages) compared with AB-000317 in the mosquito-bite parasitemia model (n = 10 mice, 150 μg per mouse), with colors other than gray indicating the five lineages containing the most efficacious antibodies. b,c, Survival curves from repeat experiments in comparison with AB-000317 and AB-000224 (0.74 (0.15, 3.8)) (b) and AB-007088 (0.61 (0.097, 3.8)) (c); n = 10 mice, two-tailed, nonparametric log-rank (Mantel–Haenszel hazard ratio (95% CIs)).
Fig. 5
Fig. 5. Developability properties of lead antibodies.
ag, Developability properties of prioritized lead antibodies as characterized by scores for DSF WSS (a), thermal hold (b), chemically induced unfolding (c), low-pH stability (aggregate low-pH hold) (d), SINS (e), stand-up monolayer affinity chromatography (Zenix column RT) (f) and relative solubility analysis (PEG recovery) (g); green shading indicates preferred ranges. h, Relative aggregate scores generated from assay panel results.
Fig. 6
Fig. 6. Developability properties of engineered variants from selected lead AB-000224.
a, Mutations made to generate engineered variants depicted in the Fv region of the Fab of AB-000224 in complex with NPNA4 (gold ribbon, PDB ID 6WFY; Methods). The light-chain framework is shown in silver and the heavy-chain in pale gray. The CDRs for light and heavy chains are indicated, respectively, as CDR1 (light and dark blue), CDR2 (light and dark purple) and CDR3 (light and dark cyan). Mutation sites of engineered variants are labeled as stability violations (red), deamidation sites (green) and paired sibling sites (gray; Methods). bh, Developability properties of engineered variants of AB-000224 as characterized by scores from DSF WSS (b), thermal hold (c), chemically induced unfolding (d), low-pH stability (aggregate low-pH hold) (e), SINS (f), stand-up monolayer affinity chromatography (Zenix column RT) (g) and relative solubility analysis (PEG recovery) (h); green shading tindicates preferred ranges. i, Aggregate score of assay panel results from bh for each engineered variant, with mutations shown in comparison with parental AB-000224. j,k, Characterization of stable cell production pools generated from engineered variants compared with AB-000224 for production titers (g l1) (j) and cell-specific productivity (qP, pg per cell per day) (k). Boxes indicate interquartile ranges, lines within boxes are medians and whiskers represent minimum and maximum (four independent replicates of each antibody).
Extended Data Fig. 1
Extended Data Fig. 1. Levels of SHM among antibody sequences.
Histogram of the number of nucleotide mutations from germline (SHM) of combined IgG heavy and light chains from blood PBs collected 7 days after administration of the third dose (blue, n = 22,319) or fourth dose (grey, n = 10,629) of RTS,S. Source data
Extended Data Fig. 2
Extended Data Fig. 2. SHM and size distribution of expanded PB IgG lineages.
a, Range of nucleotide mutations from germline (SHM) in heavy plus light chain for antibodies in expanded lineages (>1 PB) compared to antibodies in lineages that lack evidence of recent expansion (1 PB). PBs were collected 7 days after administration of the third dose (blue, n = 11,478 and n = 10,841, respectively) or fourth dose (grey, n = 5,538 and n = 5,091, respectively) of RTS,S, ***P < 0.0001 unpaired two-tailed Mann–Whitney test. b, c, By vaccinee, the size of each expanded lineage was calculated by dividing the number of PBs in that lineage by the number of PBs in all expanded lineages within each repertoire and then assigning a rank-size. Box and whisker plots represent the distribution of lineage sizes across vaccinees for each rank-size from, b, protected (green, n = 36) versus unprotected (blue, n = 9) vaccinees, and, c, from vaccinees administered a third standard dose (012 M, grey, n = 15) versus vaccinees administered a delayed fractional dose (Fx017M, blue, n = 30) of RTS,S. Boxes indicate interquartile ranges, lines within boxes are medians, and whiskers represent minimum and maximum across vaccinees.
Extended Data Fig. 3
Extended Data Fig. 3. SHM and CSP-peptide binding of mAbs versus RTS,S dose group and vaccinee protection status.
a, b, Number of nucleotide mutations from germline (SHM) for mAbs from expanded lineages of vaccinees, a, administered a third standard dose (012 M, dark blue, n = 15) or a delayed fractional dose (Fx017M, orange, n = 30) of RTS,S with CSP-reactive mAbs shown that are reactive to the repeat region peptide (NANP6, n = 45 and n = 53, respectively), to the C-terminal region peptide (C-terminal, n = 4 and n = 16, respectively), or to neither peptide (negative, n = 5 and n = 4, respectively) in comparison to mAbs not reactive in the CSP ELISA (n = 72 and n = 113, respectively), and, b, from vaccinees that were protected (green, n = 36) or unprotected (light blue, n = 9) with mAbs shown that are reactive to repeat region peptide (n = 59 and n = 39, respectively)], to the C-terminal region peptide (n = 12 and n = 8, respectively), or to neither peptide (negative, n = 6 and n = 3, respectively) in comparison to mAbs not reactive in the CSP ELISA (n = 147 and n = 38, respectively), lines are medians, ***P < 0.0001, **P < 0.001, *P < 0.02, or P > 0.1 (‘ns’), unpaired two-tailed Mann–Whitney test.
Extended Data Fig. 4
Extended Data Fig. 4. CSP-binding on-rates and amino acid divergence from germline.
a, b, Simple two-tailed linear regression of log-transformed SPR binding on-rates (kon) to CSP of mAbs (n = 141) from 35 of the most efficacious lineages compared to the number of, a, heavy, and, b, light chain amino acid mutations from germline (SHM). For correlations of non-transformed data, see Extended Data Table 1.
Extended Data Fig. 5
Extended Data Fig. 5. Generation and developability properties of engineered variants from backup molecule.
a, Mutations made to generate engineered variants are depicted in the Fv region of a Fab structure model of AB-007088 built in the MOE Antibody Modeler (see Methods). The light chain framework is in silver and the heavy chain in dim grey. The CDRs for light and heavy chains are indicated, respectively, as CDR1 (light and dark blue), CDR2 (light and dark purple), and CR3 (light and dark cyan). Mutation sites of engineered variants are labelled as stability violations (red, see Methods). b–h, Developability properties of engineered variants of parental backup, AB-007088, as characterized by scores from, b, DSF WSS, c, thermal hold, d, chemically induced unfolding, e, low pH stability (aggregate low pH hold), f, self-interaction nanoparticle spectroscopy (SINS), g, stand-up monolayer affinity chromatography (Zenix column RT), h, relative solubility analysis (PEG recovery) with green shading that indicates preferred ranges. i, Aggregate score of assay panel results from b-h for each engineered variant with mutations shown in comparison to AB-007088. j–k, Characterization of stable cell production pools generated from engineered variants compared to AB-007088 for, j, production titres, (Titre, g/L) and, k, cell-specific productivity (qP, pg per cell per day). Boxes indicate interquartile ranges, lines within boxes are medians, and whiskers represent minimum and maximum (4 independent replicates of each antibody).
Extended Data Fig. 6
Extended Data Fig. 6. In vivo activity of engineered mAb variants.
a–d, Mosquito-bite parasitaemia survival curves for 13 variants (n = 10 mice), including the eight that had the best aggregate score from the developability assays. e, Sporozoite liver burden percent inhibition compared to untreated, infected mice (geometric mean, n = 5) and normalized to the activity of AB-000317, lines and bars indicate mean ± SEM, 2–5 independent experiments per mAb, **P = 0.005 or P > 0.05 for all other variants, two-tailed Dunn’s multiple comparisons test verses AB-000317 (see Extended Data Table 3 for details).

References

    1. World Health Organization. World malaria report 2022. https://www.who.int/teams/global-malaria-programme/reports/world-malaria... (2022).
    1. World Health Organization. Global technical strategy for malaria 2016-2030, 2021 update. www.who.int/publications/i/item/9789240031357 (2021).
    1. Sinnis P, Fidock DA. The RTS,S vaccine—a chance to regain the upper hand against malaria? Cell. 2022;185:750–754. doi: 10.1016/j.cell.2022.01.028. - DOI - PMC - PubMed
    1. Collins KA, Snaith R, Cottingham MG, Gilbert SC, Hill AVS. Enhancing protective immunity to malaria with a highly immunogenic virus-like particle vaccine. Sci. Rep. 2017;7:46621. doi: 10.1038/srep46621. - DOI - PMC - PubMed
    1. World Health Organization. WHO recommends R21/Matrix-M vaccine for malaria prevention in updated advice on immunization. www.who.int/news/item/02-10-2023-who-recommends-r21-matrix-m-vaccine-for... (2023).