. 2024 Jul 1;15(7):512-529.
doi: 10.1093/procel/pwad065.

Follicle stimulating hormone controls granulosa cell glutamine synthesis to regulate ovulation

Affiliations

Follicle stimulating hormone controls granulosa cell glutamine synthesis to regulate ovulation

Kai-Hui Zhang et al. Protein Cell. .

Abstract

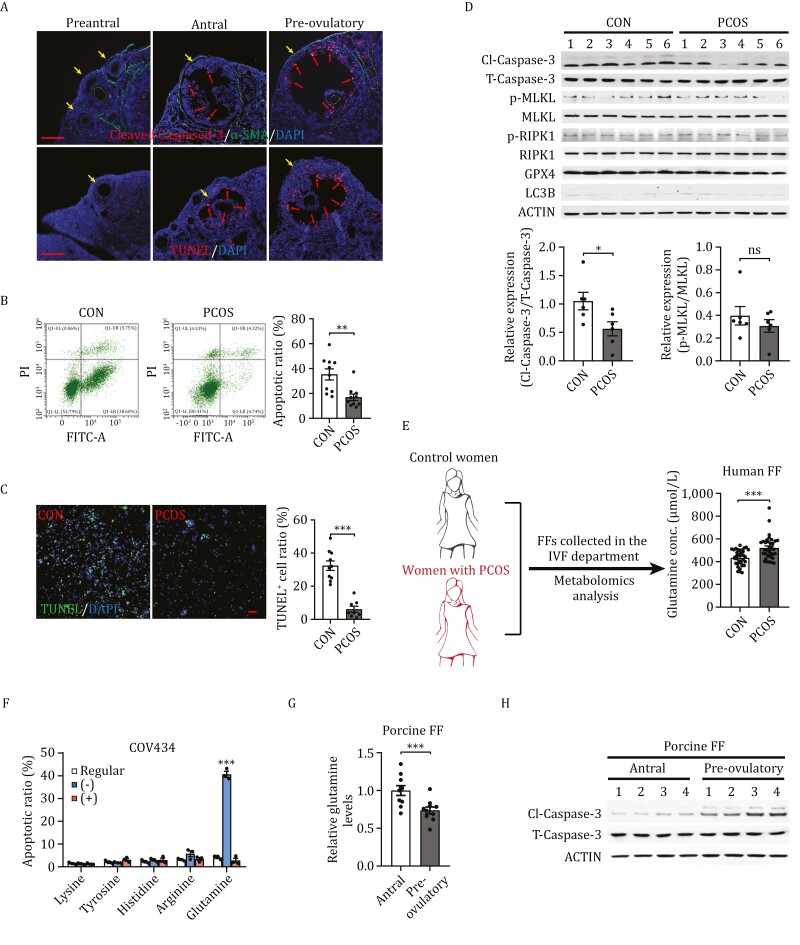
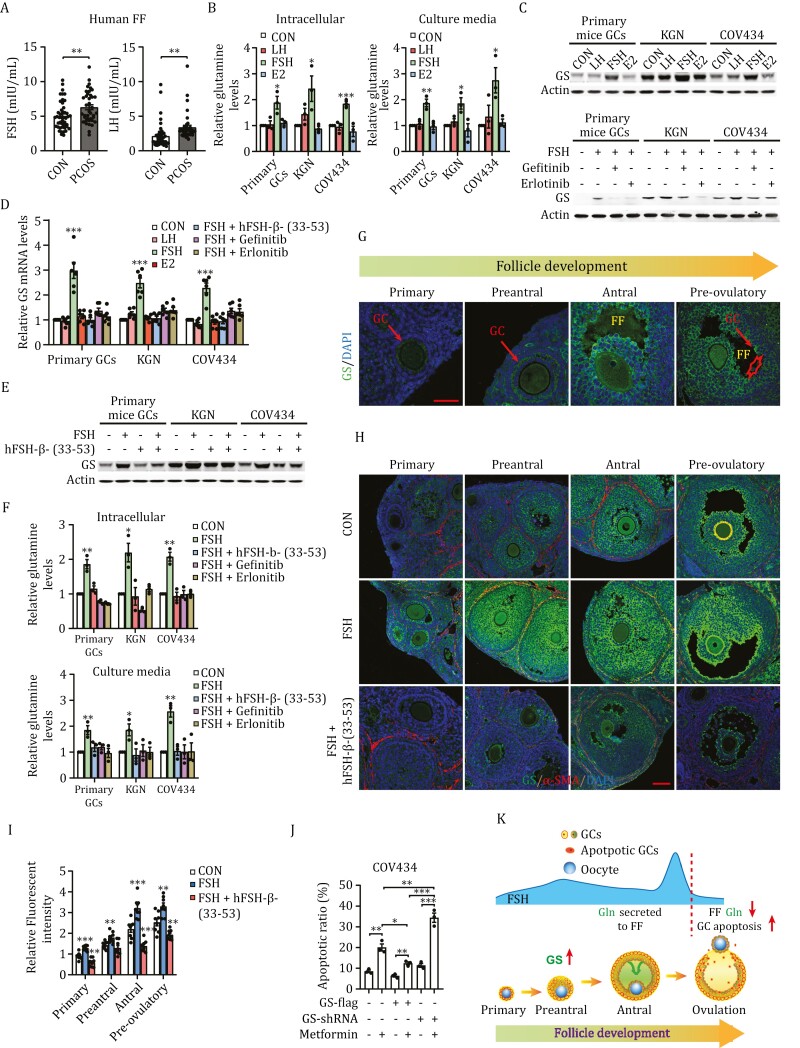
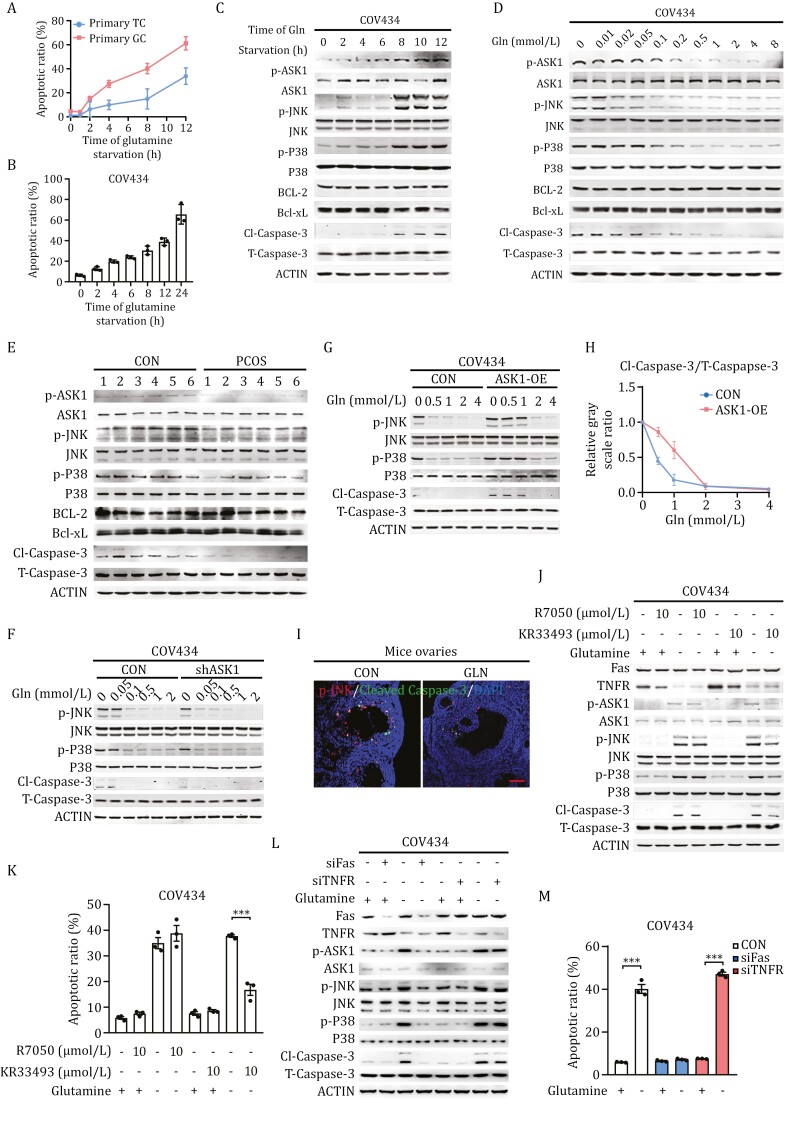
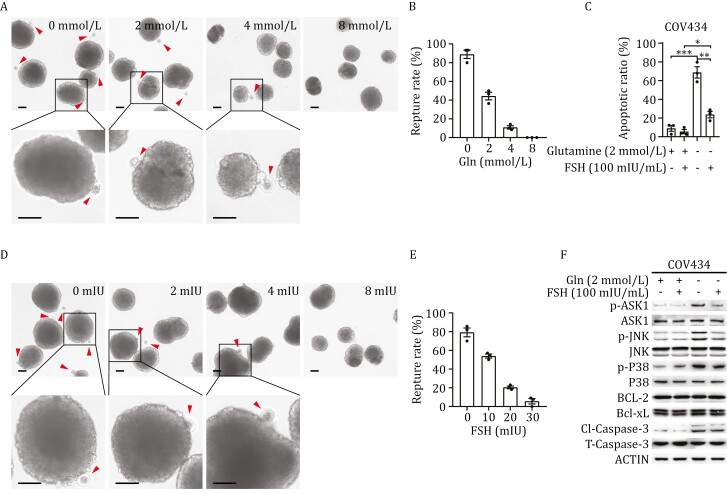
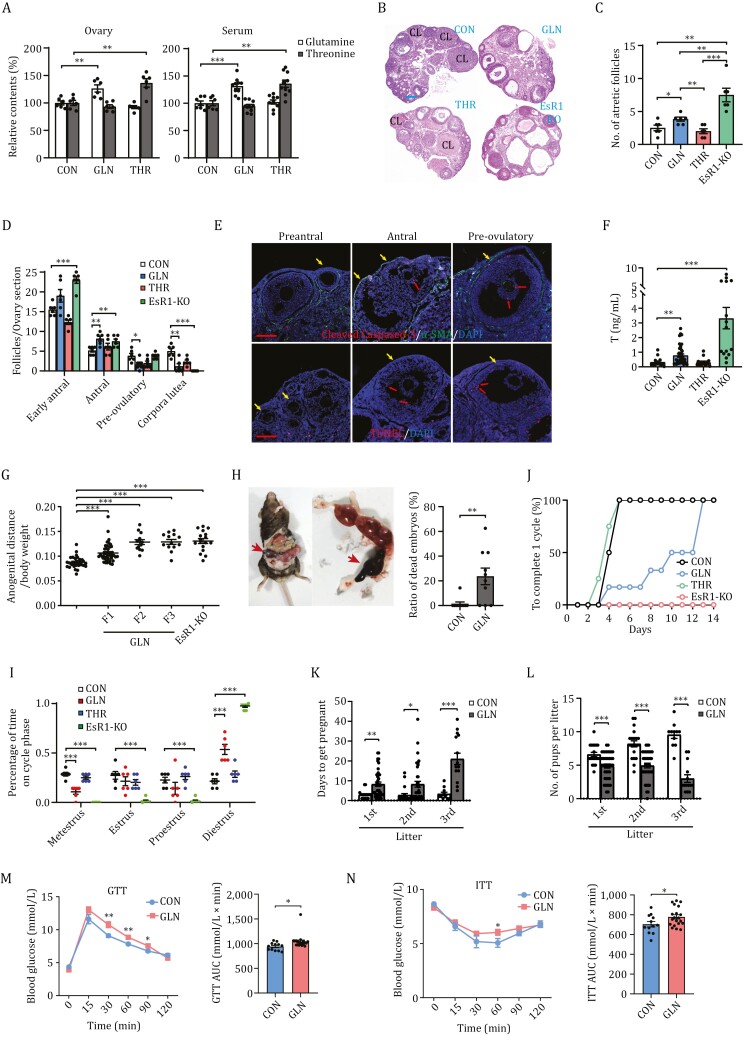
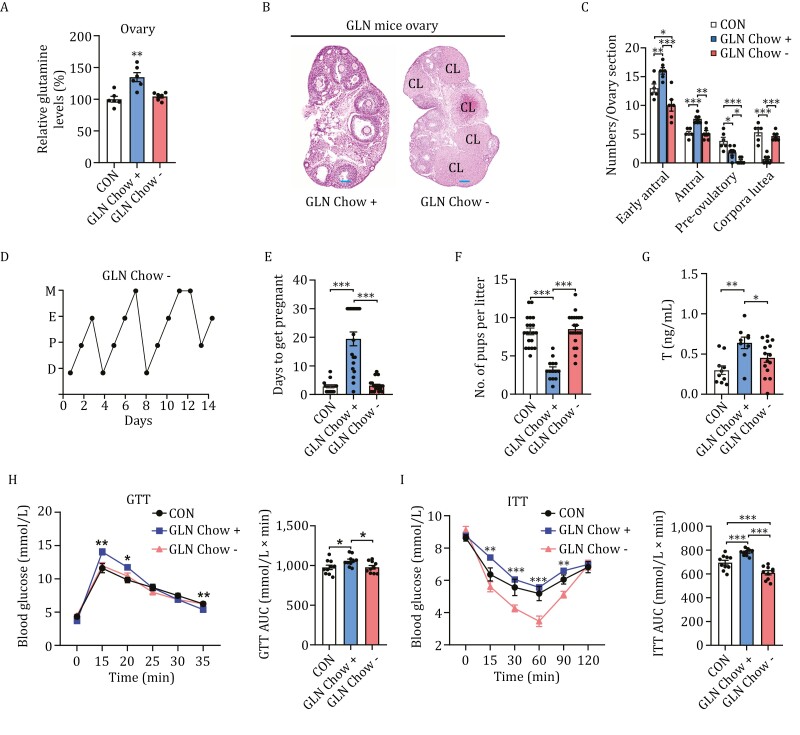
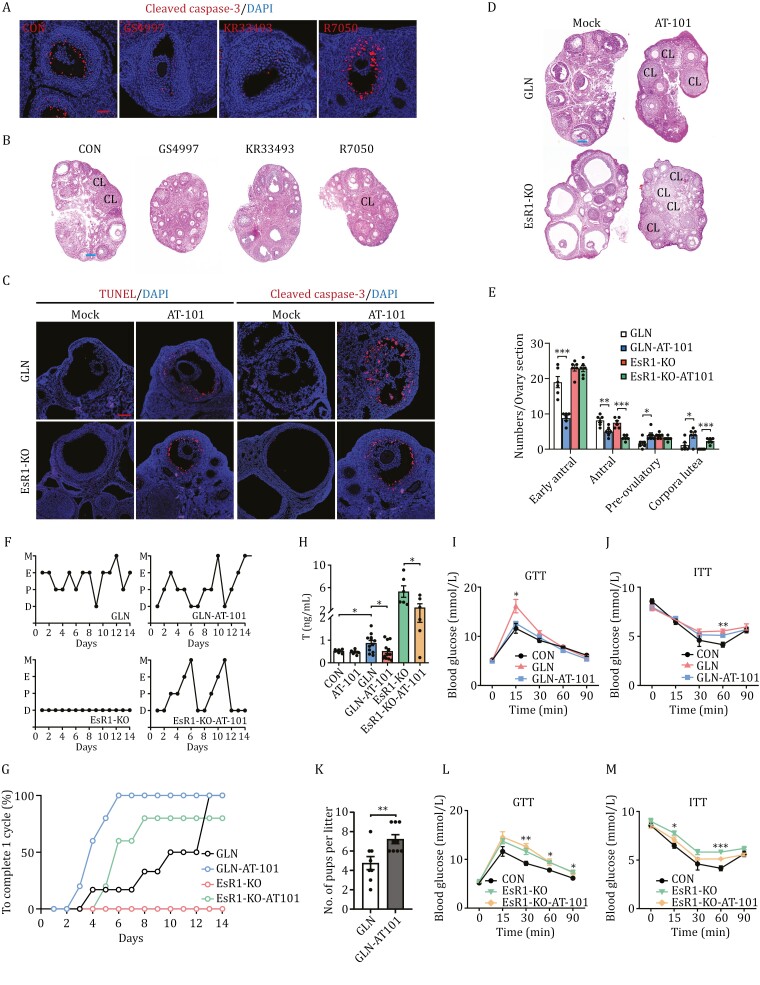
Polycystic ovary syndrome (PCOS) is the leading cause of anovulatory infertility. Inadequate understanding of the ovulation drivers hinders PCOS intervention. Herein, we report that follicle stimulating hormone (FSH) controls follicular fluid (FF) glutamine levels to determine ovulation. Murine ovulation starts from FF-exposing granulosa cell (GC) apoptosis. FF glutamine, which decreases in pre-ovulation porcine FF, elevates in PCOS patients FF. High-glutamine chow to elevate FF glutamine inhibits mouse GC apoptosis and induces hormonal, metabolic, and morphologic PCOS traits. Mechanistically, follicle-development-driving FSH promotes GC glutamine synthesis to elevate FF glutamine, which maintain follicle wall integrity by inhibiting GC apoptosis through inactivating ASK1-JNK apoptotic pathway. FSH and glutamine inhibit the rapture of cultured murine follicles. Glutamine removal or ASK1-JNK pathway activation with metformin or AT-101 reversed PCOS traits in PCOS models that are induced with either glutamine or EsR1-KO. These suggest that glutamine, FSH, and ASK1-JNK pathway are targetable to alleviate PCOS.

Keywords: FSH; PCOS; glutamine; granulosa cells; ovulation.


Conflict of interest statement

The authors declare no competing interests.

Figures

Figure 1.
Figure 1.
Granulosa cell apoptosis and FF glutamine levels are associated with ovulation outcomes. (A) High FF-facing granulosa cell apoptosis before ovulation. Mouse ovarian sections showing apoptosis of preantral, antral, and pre-ovulatory follicles (yellow arrows) using immunofluorescence (cleaved Caspase-3, upper, red arrows) and TUNEL staining (lower, red arrows) in mouse follicles. α-SMA staining (upper panel) and DAPI staining of theca cells and nuclei, respectively. Scale bars: 100 µm. (B and C) Decreased ratio of apoptotic cells in the FF of patients with PCOS. Apoptosis of GCs in the FF of patients with PCOS and healthy control subjects detected by using flow cytometry (B) and TUNEL staining (C) and then quantified (right). Scale bars: 100 µm, n = 10. (D) Apoptosis accounts for the death of floating granulosa cells in the FF. Floating FF cells from patients with PCOS (n = 6) and healthy control subjects (n = 6) were collected and assayed for markers of apoptosis (Cl-Caspase-3), necrosis (p-RIPK1 and pMLKL), ferroptosis (GPX4), and autophagy (LC3B). The bar graph showed the relative expression of Cl-Caspase-3/T-Caspase-3 (bottom left), and p-MLKL/MLKL (bottom right). (E) Higher glutamine levels were observed in the FF of patients with PCOS than in that of controls. Glutamine levels in the FF of patients with PCOS (n = 35) and healthy control subjects (n = 37) were quantified using LC–MS/MS. (F) Glutamine starvation increased apoptosis of COV434 cells. Human granulosa COV434 cells were cultured in 1640 medium (regular), 1640 medium with indicated amino acids depleted (–) or 1640 medium with supplemental of indicated extra amino acids (2 mmol/L) for 24 h and cell apoptosis was analyzed using flow cytometry (n = 3). (G and H) Decreased porcine FF glutamine levels and GC apoptosis in pre-ovulatory follicles. Glutamine levels in the FF of antral (n = 10) and pre-ovulatory (n = 10) porcine follicles detected using LC–MS/MS analysis (G). Four samples were randomly selected from each group and analyzed for cleaved Caspase-3 (Cl-Caspase-3) levels using Western blot analysis (H).
Figure 2.
Figure 2.
FSH promotes GS expression in GCs and elevates GCs glutamine synthesis and secretion. (A) Higher FSH levels in human PCOS FF. FSH levels in the FF of patients with PCOS (n = 40) and healthy control subjects (n = 46) were quantified using ELISA. (B) FSH elevates GC glutamine synthesis and secretion. Primary mouse GCs, KGN, and COV434 cells were cultured with LH, FSH, or E2 for 24 h, and the relative glutamine levels in cells and culture medium were measured (described in the Methods section, n = 3). (C and D) FSH promotes GS synthesis by activating EGFR-mediated transactivation. Primary mouse GCs, KGN, and COV434 cells were cultured with LH, FSH, or E2 (upper panel) or stimulated with FSH and treated with EGFR inhibitors gefitinib and erlotinib as indicated (lower panel). GS protein levels were detected using Western blot (C) and mRNA levels were quantified using RT-qPCR (D). (E and F) FSH-stimulated glutamine synthesis and secretion were blocked by hFSH-β-(33-53) and EGFR inhibitors. Primary mouse GCs, KGN, and COV434 cells were stimulated with FSH, FSH antagonist, hFSH-β-(33-53), or EGFR inhibitors gefitinib and erlotinib for 24 h. GS protein levels were detected using Western blot (E), and glutamine levels in the intracellular and culture media were quantified (n = 3) (F). (G) GS expression in GCs. Immunofluorescence images of mouse follicles at different stages revealed GS expression (green) in GCs that emerged in the preantral follicles and were concentrated in the FF-exposed GCs. Scale bar: 50 μm; (H and I) FSH stimulates GS expression in mice GCs. Eight-week-old female mice were injected with saline (CON), FSH (FSH), or FSH plus hFSH-β-(33-53) (FSH + hFSH-β-(33-53)). Immunofluorescence images of mouse follicles at different stages indicated that FSH upregulated GS expression (green) in GCs, whereas hFSH-β-(33-53) decreased GS expression. α-SMA staining (red) and DAPI staining (blue) were performed on theca cells and nuclei, respectively (H). Scale bar: 50 µm. The relative fluorescence intensity in the GCs was analyzed using Image J (I) (n = 8 in each group). (J) GS regulates metformin-induced apoptosis. COV434 cells were transfected with GS-flag or GS shRNA and treated with metformin for 24 h, as indicated. GS-overexpressing and GS-knockdown COV434 cells were resistant and sensitive to metformin-induced apoptosis, respectively (n = 3). (K) Schematic diagram of the FSH controls the GS and FF glutamine levels in GC during follicle development and ovulation. FSH stimulates GS expression in GC at the preantral stage and maintains its expression throughout follicular development. FF-exposed GC, which have the highest GS level, actively synthesize and secrete glutamine to the FF to nourish the oocyte and sustain follicle wall. Before ovulation, the rapid decrease in FSH levels results in low FF glutamine levels and apoptosis of GCs, starting from FF-exposed GCs. This promotes the breakup of the follicle wall, leading to successful ovulation.
Figure 3.
Figure 3.
Glutamine inhibits GC apoptosis via ASK1 apoptotic signaling pathway. (A) Glutamine starvation specifically induces apoptosis of mice granulosa cells. Primary mouse TCs and GCs were cultured in McCoy’s 5A medium and then changed to a glutamine-free 1640 medium. Cell apoptotic ratios were measured at the indicated time points using flow cytometry (n = 3). (B) Glutamine starvation induces apoptosis in granulosa cells. Flow cytometry analysis (n = 3) of the apoptotic ratio of granulosa cells at 0, 2, 4, 6, 8, 12, and 24 h after glutamine deprivation in COV434 cells. (C–H) Glutamine deprivation induces GC apoptosis by activating ASK1 signaling. ASK1 and its downstream molecular pathways, JNK and P38, were activated during glutamine deprivation in a time-dependent manner (C), and inhibited by glutamine supplementation (D), as well as in the FF floating cells of PCOS patients (E). ASK1 knockdown reversed apoptotic signaling induced by glutamine deficiency (F), whereas overexpression of ASK1 promoted apoptotic signaling in COV434 cells (G and H). (I) JNK activation in mice follicles. Immunofluorescence staining of p-JNK (red) and cleaved Caspase-3 (green) with DAPI (blue) in mouse ovaries. Scale bar: 50 μm. (J–M) Fas-signaling rather than TNFR signaling mediates granulosa cell apoptosis. Inhibition of Fas signaling by KR33493, but not TNF-α signaling by R7050, attenuates JNK and P38 phosphorylation (J) and apoptosis (K) induced by glutamine deprivation. Consistent with this, Fas-knockdown, but not TNFR-knockdown, COV434 cells inhibited JNK and P38 phosphorylation (L) and resistance to apoptosis (M) induced by glutamine deprivation (n = 3).
Figure 4.
Figure 4.
Glutamine and FSH regulates ovulation in vitro. (A and B) Glutamine inhibits mice follicular rupture in vitro. Mice follicles were cultured to mature in vitro, and were induced to ovulation, indicated by follicular rapture (enlarged below), by hCG with the presence of different levels of glutamine. Images were taken after 16 h after hCG induction. Red arrows indicate the ovulated eggs (A), and the follicular rupture ratio for each group was statistically calculated (n = 3) (B). Bars: 100 μm. (C) FSH sustains cell survival under glutamine starvation. COV434 cells were treated with or without 100 mIU FSH under glutamine-rich or glutamine-free medium for 8 h, the apoptotic rate of cells was measured with flow cytometry (n = 3). (D and E) FSH inhibits mice follicular rupture in vitro. Mice follicles were cultured to mature in vitro, and were induced to ovulation by hCG with presence of different levels of FSH. Follicular rapture was visualized 16 h after hCG induction (D), and the follicular rupture ratio for each group was statistically calculated (n = 3) (E). Bars: 100 µm. (F) FSH inhibits ASK1-JNK apoptotic signaling. COV434 cells were treated with or without 100 mIU FSH under a glutamine-rich or glutamine-free medium for 8 h, and the ASK1-JNK apoptotic signaling was detected by Western blot.
Figure 5.
Figure 5.
High-glutamine chow induces PCOS traits in mice. (A) High-amino acids chow feed increases mice ovary and serum amino acids levels. Ovaries and serum glutamine and threonine levels in mice that were fed a high-glutamine (GLN) or high-threonine chow (THR) were measured using LC–MS/MS analysis. Ovaries: n = 6 per group; serum: n = 6–10 per group. (B) High-glutamine chow induces PCOS morphology in female mice. Hematoxylin and eosin staining of ovaries from representative control (CON), high-glutamine chow (GLN), high-threonine chow (THR), and EsR1-KO mice (EsR1-KO). CL, corpus luteum. Scale bar: 100 µm. (C and D) High-glutamine chow induces fewer pre-ovulatory follicles and corpora lutea. Mean atretic follicle numbers in CON, GLN, THR, and EsR1-KO mouse ovaries (C) (n = 6 per group), and quantitative analysis of early antral follicles, antral follicles, pre-ovulatory follicles, and corpus luteum in CON, GLN, THR, and EsR1-KO mouse ovaries (D) (n = 6 per group). (E) Lower FF-facing granulosa cell apoptosis in high-glutamine fed mice (GLN) ovaries. GLN mice ovarian sections were detected for apoptosis of preantral, antral, and pre-ovulatory follicles (yellow arrows) using immunofluorescence (cleaved Caspase-3, upper, red arrows) and TUNEL staining (lower, red arrows) in high-glutamine chow-fed mouse follicles.α-SMA staining (upper panel) and DAPI staining of theca cells and nuclei, respectively. Scale bars: 100 µm. (F–L) High-glutamine chow induces PCOS traits in mice. Serum testosterone (F), ratio of anogenital distance to body weight in F1, F2, and F3 female mice and in EsR1-KO mice (G) (CON: n = 30; GLN: n = 13–44; EsR1-KO: n = 17), absorbed embryos during pregnancy (H), percentage of time on estrous cycle phases of female mice (I), days to complete one estrous cycle (J), determined for CON, GLN, THR, and EsR1-KO mice as indicated. And average time to get pregnant for the first, second, and third litter (K), and litter pup numbers for the first, second, and third litter (L) determined for CON, and GLN mice as indicated (CON: n = 11–21; GLN: n = 14–41). (M and N) High-glutamine chow impairs glucose and insulin tolerance in female mice. GTT (CON: n = 12; GLN: n = 20) (L) and ITT (CON: n = 12; GLN: n = 20) (M) of the CON and GLN mice, and the areas under the curve were statistical analyzed and presented as a bar graph, respectively.
Figure 6.
Figure 6.
Glutamine removal reverses PCOS traits in GLN mice. (A–C) Glutamine chow removal induces successful ovulation. Relative glutamine levels in mouse ovaries (A, n = 6 per group) and hematoxylin and eosin staining for ovaries assayed for normal chow-fed (CON), glutamine chow-fed (GLN chow+) mice, and mice fed glutamine chow for three months followed by normal chow feeding for one month (GLN chow-) (B). Scale bars: 100 µm (n = 6 per group; representative images are shown; CL: corpus luteum). Quantitative analysis of early antral follicles, antral follicles, pre-ovulatory follicles, and CL in CON, GLN chow+, and GLN chow- mouse ovaries (C). (D–F) Glutamine chow removal restored the regular estrous cycle and litter pup number. Representative estrous cycles (D), time to get pregnant (E, n = 20 per group), and litter pup numbers (F, n = 20 per group) of CON, GLN chow+, and GLN chow- mice were measured. (G) Glutamine chow removal decreases serum testosterone levels. Serum testosterone levels in CON (n = 10), GLN chow + (n = 9), and GLN chow- (n = 15) mice. (H and I) Glutamine chow removal alleviates mice’s glucose tolerance and insulin resistance. Glucose tolerance test (H) and insulin resistance test (I) results for CON, GLN chow+, and GLN chow- mice (n = 10 per group), and the areas under the curve were statistical analyzed and presented as bar graphs, respectively.
Figure 7.
Figure 7.
ASK1 signaling activation alleviates PCOS traits in mice PCOS models. (A) Inhibition of Fas-ASK1 death signaling decreases the apoptosis in GCs of mice ovaries. Immunofluorescence staining of cleaved caspase-3 (red) with DAPI (blue) staining of ovaries from mice treated with GS4997, KR33493, and R7050. Scale Bar: 100 µm. (B) Inhibition of Fas-ASK1 death signaling induces polycystic ovary morphology in mice. H&E staining of ovaries from mice treated with saline (CON), GS4997, KR33493, and R7050. CL: corpus luteum. Scale Bar: 100 µm. (C–E) AT-101 increases granulosa cell-specific apoptosis and ovulation in mice. TUNEL staining (C, left), immunofluorescence staining (C, right), and hematoxylin and eosin staining (D) of ovaries from GLN or EsR1-KO mice fed via oral gavage of saline (Mock) or AT-101 (AT-101). Scale bars: 100 µm. (E) Quantitative analysis of early antral follicles, antral follicles, pre-ovulatory follicles, and corpus luteum per ovary section in GLN, GLN-AT-101, EsR1-KO, and EsR1-KO-AT-101 ovaries (n = 6 per group). (F and G) AT-101 partially reverses PCOS mice model estrous cycles. Representative estrous cycles of GLN, GLN-AT-101, EsR1-KO, and EsR1-KO-AT-101 females (F) and days taken for GLN, GLN-AT-101, EsR1-KO, and EsR1-KO-AT-101 mice to complete one estrous cycle (G). (H) AT-101 decreases serum testosterone levels in GLN mice and EsR1-KO mice. Serum testosterone levels in CON, AT-101, GLN, GLN-AT-101, EsR1-KO, and EsR1-KO-AT-101 mice (n = 6–12 per group). (I and J) AT-101 treatment increases glucose tolerance and insulin sensitivity in GLN mice. GTT (I) and ITT (J) of CON, GLN, and GLN mice injected with AT-101 (CON and GLN: n = 6; GLN-AT-101: n = 5). (K) AT-101 treatment increases the number of pups in GLN mice. Litter pup numbers in GLN and GLN mice treated with AT-101 (n = 8–9). (L and M) AT-101 treatment increases glucose tolerance and insulin sensitivity in EsR1-KO mice. GTT (L) and ITT (M) of CON, EsR1-KO, and EsR1-KO mice injected with AT-101 (CON: n = 6; EsR1-KO and EsR1-AT-101: n = 5).

Similar articles

Cited by

References

    1. Azziz R, Carmina E, Chen Z. et al. Polycystic ovary syndrome. Nat Rev Dis Primers 2016;2:16057. - PubMed
    1. Bae IH, Foote RH.. Utilization of glutamine for energy and protein-synthesis by cultured rabbit follicular oocytes. Exp Cell Res 1975;90:432–6. - PubMed
    1. Barbieri RL. Metformin for the treatment of polycystic ovary syndrome. Obstet Gynecol 2003;101:785–93. - PubMed
    1. Chantranupong L, Wolfson RL, Sabatini DM.. Nutrient-sensing mechanisms across evolution. Cell 2015;161:67–83. - PMC - PubMed
    1. Das M, Djahanbakhch O, Hacihanefioglu B. et al.. Granulosa cell survival and proliferation are altered in polycystic ovary syndrome. J Clin Endocrinol Metab 2008;93:881–7. - PMC - PubMed