. 2024 Jan 2;14(1):41.
doi: 10.1038/s41598-023-50478-6.

SIRT1 as a potential key regulator for mediating apoptosis in oropharyngeal cancer using cyclophosphamide and all-trans retinoic acid

Affiliations

SIRT1 as a potential key regulator for mediating apoptosis in oropharyngeal cancer using cyclophosphamide and all-trans retinoic acid

Mahitab G Haggagy et al. Sci Rep. .

Abstract

Although cyclophosphamide (CTX) has been used for recurrent or metastatic head and neck cancers, resistance is usually expected. Thus, we conducted this study to examine the effect of adding all-trans retinoic acid (ATRA) to CTX, to increase efficacy of CTX and reduce the risk of resistance developed. In this study, we investigated the combined effect of ATRA and CTX on the expression of apoptotic and angiogenesis markers in oropharyngeal carcinoma cell line (NO3), and the possible involved mechanisms. ATRA and CTX in combination significantly inhibited the proliferation of NO3 cells. Lower dose of CTX in combination with ATRA exhibited significant cytotoxicity than that of CTX when used alone, implying lower expected toxicity. Results showed that ATRA and CTX modulated oxidative stress; increased NOx and MDA, reduced GSH, and mRNA expression of Cox-2, SIRT1 and AMPK. Apoptosis was induced through elevating mRNA expressions of Bax and PAR-4 and suppressing that of Bcl-xl and Bcl-2, parallel with increased caspases 3 and 9 and decreased VEGF, endothelin-1 and CTGF levels. The primal action of the combined regimen on inflammatory signaling highlights its impact on cell death in NO3 cell line which was mediated by oxidative stress associated with apoptosis and suppression of angiogenesis.


Conflict of interest statement

The authors declare no competing interests.

Figures
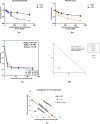
Figure 1
Figure 1
Cytotoxicity of cyclophosphamide, retinoic acid and their combination in NO3 and OEC cell lines after 48 h. (a) Surviving fraction of NO3 treated with different concentrations of cyclophosphamide. (b) Surviving fractions of NO3 treated with different concentrations of retinoic acid. (c) Combined cytotoxicity effect of 40, 80, 160 μM retinoic acid and different concentrations of cyclophosphamide (0–250 μM) in NO3 cells. (d) CompuSyn analysis of combination of cyclophosphamide (C) and retinoic acid (R) in NO3 cell line. (e) Isobologram analysis of combination of cyclophosphamide (C) and retinoic acid (R) in NO3 cell line. Values are the means ± SD of three independent experiments performed in triplicates (n = 6).
Figure 2
Figure 2
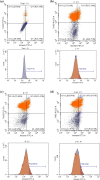
Effect of cyclophosphamide (C) (26.5 μM), Retinoic acid (R) (40 μM) and their combination on apoptosis parameters. Flow cytometry scatterplots for (a) control, (b) cyclophosphamide, (c) retinoic acid, (d) their combination, (e) quantitative analysis of the total apoptosis rate and (f) quantitative analysis of Necrosis rate. Real time mRNA expression of (g) Bax, (h) Bcl-2, (i) Bcl-xl, (j) PAR-4, in addition to (k, l) caspase 3 and 9 levels, (m, n) Bax and Bcl-2 levels using ELISA technique. Results were expressed as means ± SD of two independent experiments performed in duplicates (n = 4). Statistical significance of results was analyzed using one-way ANOVA followed by Tukey’s multiple comparison test (a) Significantly different from the control group (b) Significantly different from Cyclophosphamide treated group, (c) Significantly different from Retinoic acid treated group at P ˂ 0.05.
Figure 2
Figure 2
Effect of cyclophosphamide (C) (26.5 μM), Retinoic acid (R) (40 μM) and their combination on apoptosis parameters. Flow cytometry scatterplots for (a) control, (b) cyclophosphamide, (c) retinoic acid, (d) their combination, (e) quantitative analysis of the total apoptosis rate and (f) quantitative analysis of Necrosis rate. Real time mRNA expression of (g) Bax, (h) Bcl-2, (i) Bcl-xl, (j) PAR-4, in addition to (k, l) caspase 3 and 9 levels, (m, n) Bax and Bcl-2 levels using ELISA technique. Results were expressed as means ± SD of two independent experiments performed in duplicates (n = 4). Statistical significance of results was analyzed using one-way ANOVA followed by Tukey’s multiple comparison test (a) Significantly different from the control group (b) Significantly different from Cyclophosphamide treated group, (c) Significantly different from Retinoic acid treated group at P ˂ 0.05.
Figure 3
Figure 3
Effect of cyclophosphamide (C) (26.5 μM), Retinoic acid (R) (40 μM) and their combination on mRNA expression of inflammatory parameters. The mRNA of expression of (a) AMPK and (b) SIRT1 and (c) Cox-2. Results were expressed as means ± SD of two independent experiments performed in duplicates (n = 4). Statistical significance of results was analyzed using one way ANOVA using Tukey’s multiple comparison test. (a) Significantly different from the control group (b) Significantly different from Cyclophosphamide treated group, (c) Significantly different from Retinoic acid treated group at P ˂ 0.05.
Figure 4
Figure 4
Effect of cyclophosphamide (C) (26.5 μM), Retinoic acid (R) (40 μM) and their combination on oxidative stress parameters: (a) Nitric oxide (NOx), (b) Malondialdehyde (MDA) and (c) Glutathione (GSH) in NO3 cells. Results were expressed as means ± SD of two independent experiments performed in duplicates (n = 4). Statistical significance of results was analyzed using one way ANOVA using Tukey’s multiple comparison test. (a) Significantly different from the control group (b) Significantly different from Cyclophosphamide treated group, (c) Significantly different from Retinoic acid treated group at P ˂ 0.05.
Figure 5
Figure 5
Effect of cyclophosphamide (C) (26.5 μM), Retinoic acid (R) (40 μM) and their combination on angiogenesis; (a) VEGF and (b) ET-1 in NO3 cells. Results were expressed as means ± SD of two independent experiments performed in duplicates (n = 4). Statistical significance of results was analyzed using one way ANOVA using Tukey’s multiple comparison test. (a) Significantly different from the control group (b) Significantly different from Cyclophosphamide treated group, (c) Significantly different from Retinoic acid treated group at P ˂ 0.05.
Figure 6
Figure 6
Effect of cyclophosphamide (C) (26.5 μM), Retinoic acid (R) (40 μM) and their combination on mRNA expression of (a) PDGF and (b) CTGF. Results were expressed as means ± SD of two independent experiments performed in duplicates (n = 4). Statistical significance of results was analyzed using one way ANOVA using Tukey’s multiple comparison test. (a) Significantly different from the control group (b) Significantly different from Cyclophosphamide treated group, (c) Significantly different from Retinoic acid treated group at P ˂ 0.05.
Figure 7
Figure 7
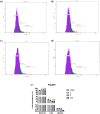
Flow cytometric cell cycle analysis. Analysis of NO3 cells (a) control, cells treated with (b) cyclophosphamide (C) (26.5 μM), (c) retinoic acid (R) (40 μM), (d) their combination. (e) Bar charts represent the percentage of cell population in G0-G1, S and G2-M phase of the cell cycle of untreated cells and after treatment with cyclophosphamide, retinoic acid and their combination. Results were expressed as means ± SD of two independent experiments performed in duplicates (n = 4). Statistical significance of results was analyzed using two-way ANOVA followed by Bonferroni test (a) Significantly different from the control group (b) Significantly different from Cyclophosphamide treated group, (c) Significantly different from Retinoic acid treated group at P ˂ 0.05.
Figure 8
Figure 8
Effect of cyclophosphamide (C) (26.5 μM), Retinoic acid (R) (40 μM) and their combination on (a) SIRT1 level using ELISA technique and (b) Western blot analysis (bands intensity and bar chart graph). β-actin served as a loading control. Original blots are presented in Supplementary Fig. S1. Results were expressed as means ± SD of two independent experiments performed in duplicates (n = 4). Statistical significance of results was analyzed using one way ANOVA using Tukey’s multiple comparison test. (a) Significantly different from the control group (b) Significantly different from Cyclophosphamide treated group, (c) Significantly different from Retinoic acid treated group at P ˂ 0.05.
Figure 9
Figure 9
Summarization of the effect of the combined regimen of CTX and ATRA compared to CTX alone in oropharyngeal carcinoma cell line (NO3) and the proposed involved apoptotic, oxidative stress and angiogenesis pathways.

Similar articles

Cited by

References

    1. Vokes EE, Weichselbaum RR, Lippman SM, Hong WK. Head and neck cancer. N. Engl. J. Med. 1993;328(3):184–194. doi: 10.1056/NEJM199301213280306. - DOI - PubMed
    1. Reed JC. Mini-review: Cellular mechanisms of disease series Bcl-2 and the regulation of programmed cell death. J. Cell Biol. 1994;124:1–6. doi: 10.1083/jcb.124.1.1. - DOI - PMC - PubMed
    1. Wagener C, et al. Induction of the death-promoting gene bax-α sensitizes cultures breast-cancer cells to drug-induced apoptosis. Int. J. Cancer. 1996;67(1):138–141. doi: 10.1002/(SICI)1097-0215(19960703)67:1<138::AID-IJC22>3.0.CO;2-9. - DOI - PubMed
    1. Yoshizaki T, et al. SIRT1 exerts anti-inflammatory effects and improves insulin sensitivity in adipocytes. Mol. Cell Biol. 2009;29(5):1363–1374. doi: 10.1128/MCB.00705-08. - DOI - PMC - PubMed
    1. Zhang R, et al. SIRT1 suppresses activator protein-1 transcriptional activity and cyclooxygenase-2 expression in macrophages. J. Biol. Chem. 2010;285(10):7097–7110. doi: 10.1074/jbc.M109.038604. - DOI - PMC - PubMed