

Spatio-temporal epidemiology and associated indicators of COVID-19 (wave-I and II) in India
- PMID: 38167962
- PMCID: PMC10761923
- DOI: 10.1038/s41598-023-50363-2
Spatio-temporal epidemiology and associated indicators of COVID-19 (wave-I and II) in India
Abstract
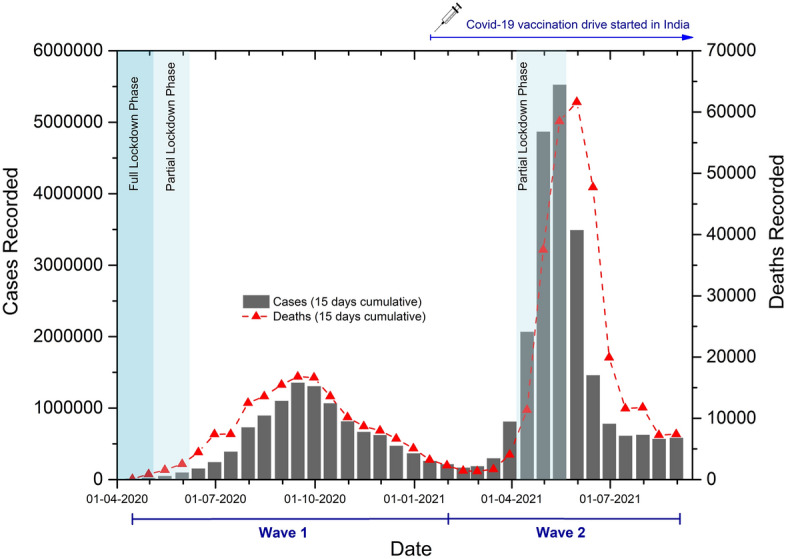
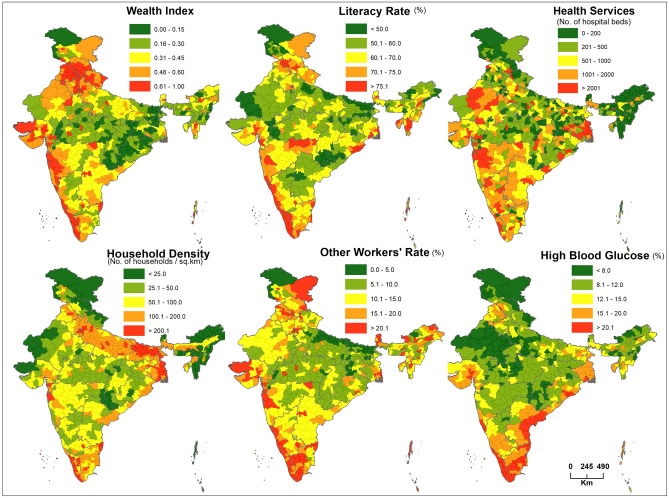
The spatio-temporal distribution of COVID-19 across India's states and union territories is not uniform, and the reasons for the heterogeneous spread are unclear. Identifying the space-time trends and underlying indicators influencing COVID-19 epidemiology at micro-administrative units (districts) will help guide public health strategies. The district-wise daily COVID-19 data of cases and deaths from February 2020 to August 2021 (COVID-19 waves-I and II) for the entire country were downloaded and curated from public databases. The COVID-19 data normalized with the projected population (2020) and used for space-time trend analysis shows the states/districts in southern India are the worst hit. Coastal districts and districts adjoining large urban regions of Mumbai, Chennai, Bengaluru, Goa, and New Delhi experienced > 50,001 cases per million population. Negative binomial regression analysis with 21 independent variables (identified through multicollinearity analysis, with VIF < 10) covering demography, socio-economic status, environment, and health was carried out for wave-I, wave-II, and total (wave-I and wave-II) cases and deaths. It shows wealth index, derived from household amenities datasets, has a high positive risk ratio (RR) with COVID-19 cases (RR: 3.577; 95% CI: 2.062-6.205) and deaths (RR: 2.477; 95% CI: 1.361-4.506) across the districts. Furthermore, socio-economic factors such as literacy rate, health services, other workers' rate, alcohol use in men, tobacco use in women, overweight/obese women, and rainfall have a positive RR and are significantly associated with COVID-19 cases/deaths at the district level. These positively associated variables are highly interconnected in COVID-19 hotspot districts. Among these, the wealth index, literacy rate, and health services, the key indices of socio-economic development within a state, are some of the significant indicators associated with COVID-19 epidemiology in India. The identification of district-level space-time trends and indicators associated with COVID-19 would help policymakers devise strategies and guidelines during public health emergencies.
© 2024. The Author(s).
Conflict of interest statement
The authors declare no competing interests.
Figures


References
-
- NIC. National Informatics Centre. Ministry of Health and Family Welfare, Government of India. https://www.mohfw.gov.in/ (Accessed 03 January 2022) (2022).
MeSH terms
LinkOut - more resources
Full Text Sources
Medical
