

Association of exposure to indoor molds and dampness with allergic diseases at water-damaged dwellings in Korea
- PMID: 38167981
- PMCID: PMC10762174
- DOI: 10.1038/s41598-023-50226-w
Association of exposure to indoor molds and dampness with allergic diseases at water-damaged dwellings in Korea
Abstract
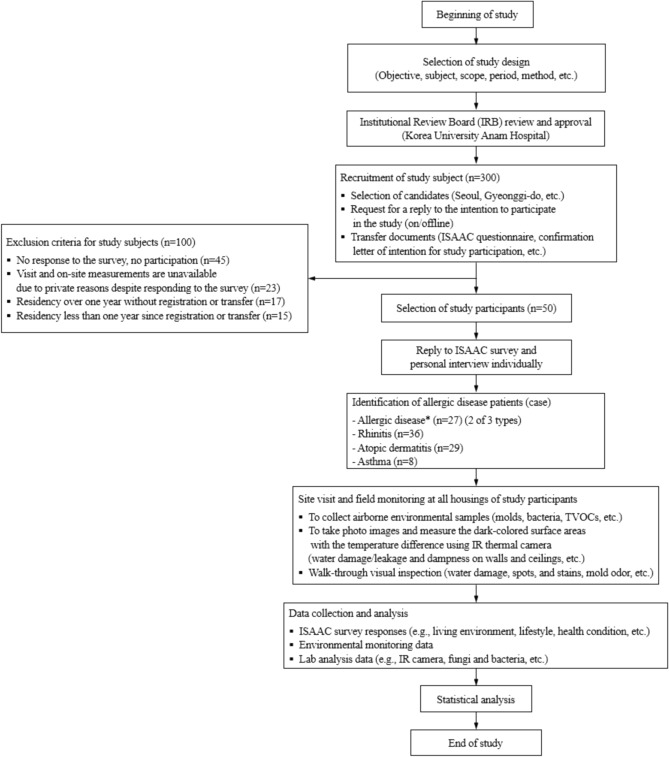
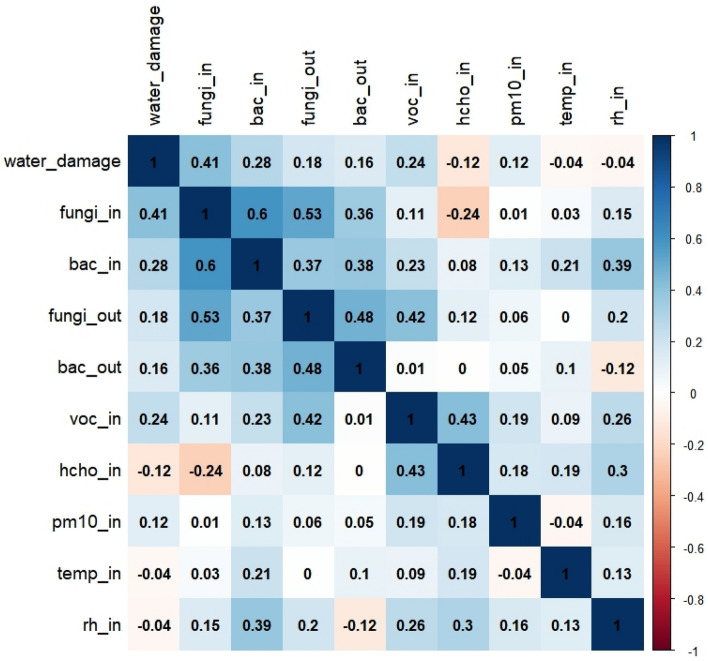
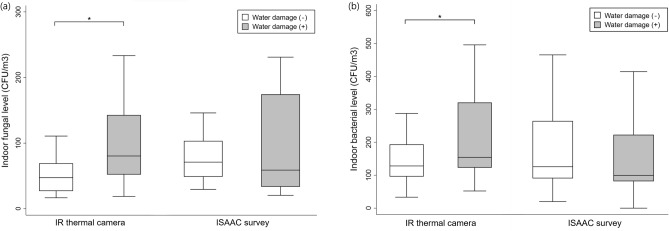
This study aims to characterize levels of molds, bacteria, and environmental pollutants, identify the associations between indoor mold and dampness exposures and childhood allergic diseases, including asthma, allergic rhinitis, atopic dermatitis, using three different exposure assessment tools. A total of 50 children with their parents who registered in Seoul and Gyeonggi-do in Korea participated in this study. We collated the information on demographic and housing characteristics, environmental conditions, and lifestyle factors using the Korean version of the International Study of Asthma and Allergies in Childhood questionnaire. We also collected environmental monitoring samples of airborne molds and bacteria, total volatile organic compounds, formaldehyde, and particulate matter less than 10 µm. We evaluated and determined water damage, hidden dampness, and mold growth in dwellings using an infrared (IR) thermal camera and field inspection. Univariate and multivariate regression analyses were performed to evaluate the associations between prevalent allergic diseases and exposure to indoor mold and dampness. Indoor mold and bacterial levels were related to the presence of water damage in dwellings, and the mean levels of indoor molds (93.4 ± 73.5 CFU/m3) and bacteria (221.5 ± 124.2 CFU/m3) in water-damaged homes were significantly higher than those for molds (82.0 ± 58.7 CFU/m3) and for bacteria (152.7 ± 82.1 CFU/m3) in non-damaged dwellings (p < 0.05). The crude odds ratios (ORs) of atopic dermatitis were associated with < 6th floor (OR = 3.80), and higher indoor mold (OR = 6.42) and bacterial levels (OR = 6.00). The crude ORs of allergic diseases, defined as a group of cases who ever suffered from two out of three allergic diseases, e.g., asthma and allergic rhinitis, and allergic rhinitis were also increased by 3.8 and 9.3 times as large, respectively, with water damage (+) determined by IR camera (p < 0.05). The adjusted OR of allergic rhinitis was significantly elevated by 10.4 times in the water-damaged dwellings after adjusting age, sex, and secondhand smoke. Therefore, a longitudinal study is needed to characterize dominant mold species using DNA/RNA-based sequencing techniques and identify a causal relationship between mold exposure and allergic diseases in the future.
© 2024. The Author(s).
Conflict of interest statement
The authors declare no competing interests.
Figures

Similar articles
-
Respiratory Diseases in University Students Associated with Exposure to Residential Dampness or Mold.Int J Environ Res Public Health. 2016 Nov 18;13(11):1154. doi: 10.3390/ijerph13111154. Int J Environ Res Public Health. 2016. PMID: 27869727 Free PMC article.
-
Asthma, allergic rhinitis and atopic dermatitis in association with home environment - The RHINE study.Sci Total Environ. 2022 Dec 20;853:158609. doi: 10.1016/j.scitotenv.2022.158609. Epub 2022 Sep 8. Sci Total Environ. 2022. PMID: 36089044
-
Asthma, allergic rhinitis and eczema among parents of preschool children in relation to climate, and dampness and mold in dwellings in China.Environ Int. 2019 Sep;130:104910. doi: 10.1016/j.envint.2019.104910. Epub 2019 Jun 18. Environ Int. 2019. PMID: 31226554
-
Adverse human health effects associated with molds in the indoor environment.J Occup Environ Med. 2003 May;45(5):470-8. doi: 10.1097/00043764-200305000-00006. J Occup Environ Med. 2003. PMID: 12762072 Review.
-
Respiratory and allergic health effects of dampness, mold, and dampness-related agents: a review of the epidemiologic evidence.Environ Health Perspect. 2011 Jun;119(6):748-56. doi: 10.1289/ehp.1002410. Epub 2011 Jan 26. Environ Health Perspect. 2011. PMID: 21269928 Free PMC article. Review.
References
-
- Hwang E-S, Jung J-S, Shim I-K, Lee J-S, Lee J-C. Seasonal airborne fungal concentration and distribution in apartment buildings. J. Korean Soc Living Environ. Syst. 2019;26:825–833. doi: 10.21086/ksles.2019.12.26.6.825. - DOI
-
- Ginestet S, Aschan-Leygonie C, Bayeux T, Keirsbulck M. Mould in indoor environments: The role of heating, ventilation and fuel poverty: A French perspective. Build. Environ. 2020;169:106577. doi: 10.1016/j.buildenv.2019.106577. - DOI
-
- Lie SK, Vestøl GI, Høibø O, Gobakken LR. Surface mould growth on wooden claddings: Effects of transient wetting, relative humidity, temperature and material properties. Wood Mat. Sci. Eng. 2019;14:129–141. doi: 10.1080/17480272.2018.1424239. - DOI
