. 2024 Jan 2;15(1):109.
doi: 10.1038/s41467-023-44175-1.

Integrated multi-omics analyses identify anti-viral host factors and pathways controlling SARS-CoV-2 infection

Affiliations

Integrated multi-omics analyses identify anti-viral host factors and pathways controlling SARS-CoV-2 infection

Jiakai Hou et al. Nat Commun. .

Abstract

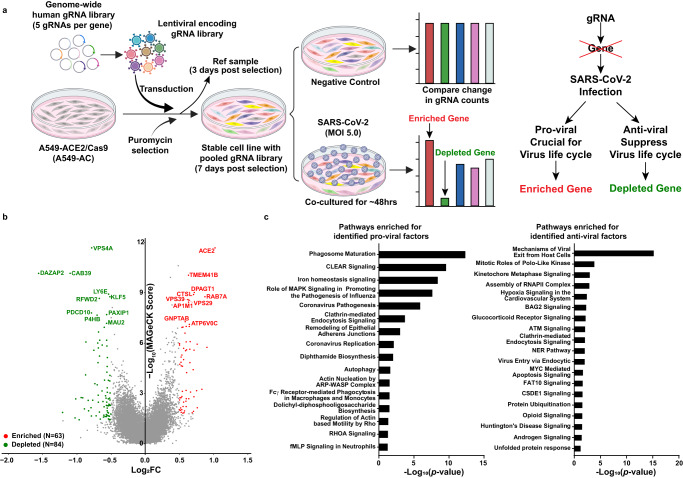
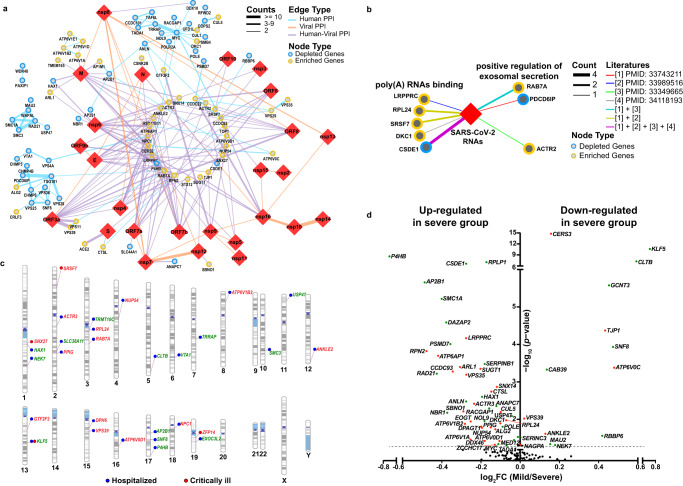
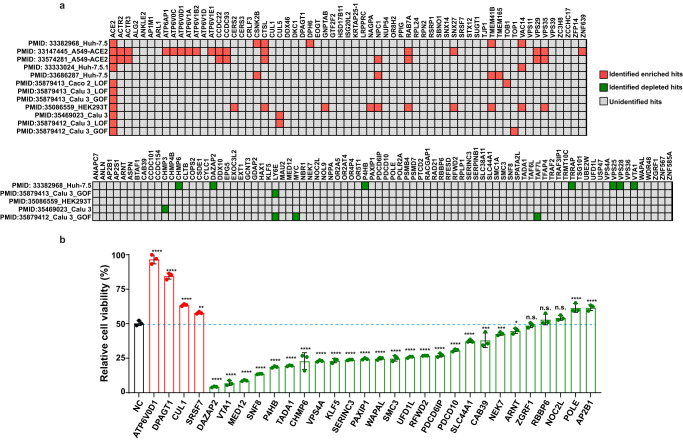
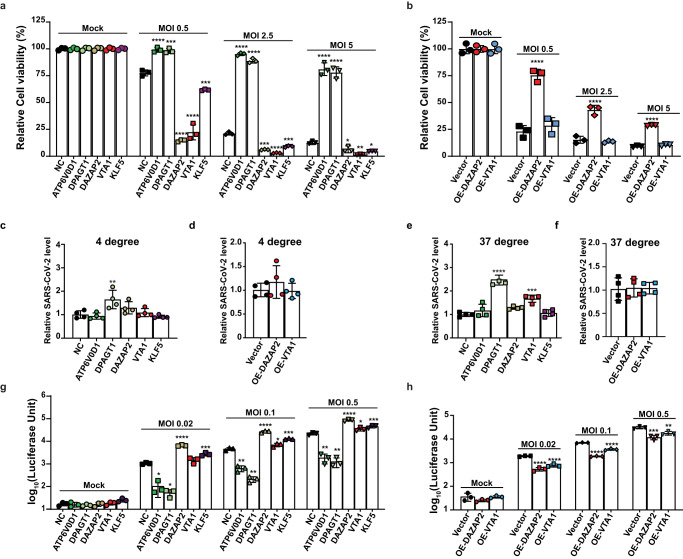
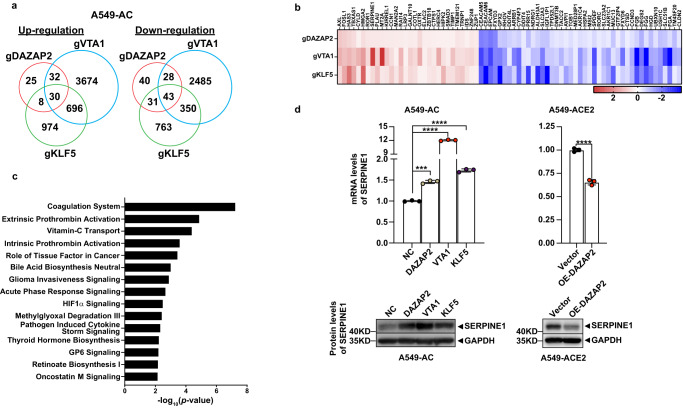
Host anti-viral factors are essential for controlling SARS-CoV-2 infection but remain largely unknown due to the biases of previous large-scale studies toward pro-viral host factors. To fill in this knowledge gap, we perform a genome-wide CRISPR dropout screen and integrate analyses of the multi-omics data of the CRISPR screen, genome-wide association studies, single-cell RNA-Seq, and host-virus proteins or protein/RNA interactome. This study uncovers many host factors that are currently underappreciated, including the components of V-ATPases, ESCRT, and N-glycosylation pathways that modulate viral entry and/or replication. The cohesin complex is also identified as an anti-viral pathway, suggesting an important role of three-dimensional chromatin organization in mediating host-viral interaction. Furthermore, we discover another anti-viral regulator KLF5, a transcriptional factor involved in sphingolipid metabolism, which is up-regulated, and harbors genetic variations linked to COVID-19 patients with severe symptoms. Anti-viral effects of three identified candidates (DAZAP2/VTA1/KLF5) are confirmed individually. Molecular characterization of DAZAP2/VTA1/KLF5-knockout cells highlights the involvement of genes related to the coagulation system in determining the severity of COVID-19. Together, our results provide further resources for understanding the host anti-viral network during SARS-CoV-2 infection and may help develop new countermeasure strategies.


Conflict of interest statement

W.P. served as an advisor for Fresh wind biotechnologies. X.X. and P.-Y.S. have filed a patent on the reverse genetic system and reporter SARS-CoV-2. The remaining authors declare no competing interests.

Figures

Fig. 1
Fig. 1. Discovery of host factors controlling SARS-CoV-2 infection.
a A schematic diagram of the functional CRISPR/Cas9 dropout screen based on virus-induced cytopathic effect (CPE). A549-AC cells were transduced with a genome-wide human gRNA library (five gRNAs per gene) and followed by puromycin selection. After 3-day puromycin selection, 30 million pooled cells were collected as the reference sample. On day 7 after selection, pooled A549-AC cells were infected with recombinant SARS-CoV-2 at MOI = 5 for 48 h. Pooled A549-AC cells without viral treatment were severed as the controls. The changes in gRNA distribution between the virus-infected samples and controls were determined. b A volcano plot showing top candidates for pro-viral and anti-viral host factors. The gene-level MAGeCK scores and the changes in gRNA distribution between A549-AC cells with and without viral infection were calculated. The log2 fold change of the second-best gRNA for each gene was selected for data representation. Genes whose gRNAs were significantly enriched or depleted in the infected group (P value < 0.05 and |log2FC | ≥0.5) were labeled as red and green dots, respectively. The top ten enriched/depleted (pro-viral/anti-viral) genes based on MAGeCK scores were indicated. P values were calculated from the negative-binomial model. Two one-sided P values were provided to test whether gRNA was positively or negatively selected. Adjusted P value was calculated by using the Benjamini–Hochberg procedure. c Ingenuity Pathway Analysis of identified host factors for SARS-CoV-2 infection. Enriched pathways for pro-viral factors (enriched, left panel) and anti-viral factors (depleted, right panel) with statistical significance (P value < 0.05) were illustrated. P values for each gene set were calculated by using a Right-Tailed Fisher’s Exact Test and exact P values were provided in the source data file.
Fig. 2
Fig. 2. Integrative analysis revealing virus-host interactome networks and potential clinical relevance of identified host factors.
a Protein-protein interactome (PPI) networks between viral proteins and host factors are identified by the dropout screen. 229 interactions between 26 SARS-CoV-2 proteins (red diamonds) and 147 human proteins (circles; depleted hits: blue; enriched hits: yellow) were found. The color of the edge indicates the type of interaction (blue: host-host PPI; orange: viral-viral PPI; purple: host-viral PPI) and the thickness of the edge indicates the count number of published datasets. b RNA-protein interactome networks between the viral RNA and host factors identified by the dropout screen. SARS-CoV-2 viral RNA was indicated as the red diamond; identified host factors were represented as circles (enriched hits: yellow; depleted hits: blue). The interaction between RNA and identified host factors was indicated as different edge types (colors: literature ID; thickness: count number of published manuscripts). c Gene variations in multiple identified host factors are associated with disease severity in COVID-19 patients. The Genome-Wide Association Study (GWAS) between variants of identified host factors and clinical features was performed by using the COVID-19-hgGWAS meta-analyses. “Hospitalized” indicates that single nucleotide polymorphisms (SNPs) of identified host factors were related to hospitalized COVID-19 patients, which were labeled with blue dots. “Critically ill” indicates SNPs of identified host factors were related to COVID-19 patients with severe respiratory symptoms, which were labeled with red dots. The names of enriched genes and depleted genes were labeled in red and green, respectively. d A volcano plot showing the changes in mRNA expression of identified host factors in epithelial cells from COVID-19 patients with and without severe illness. COVID-19 patients with mild symptoms or hospitalized in the ward were stratified in the mild group, whereas COVID-19 patients with severe symptoms or hospitalized in the intensive care unit (ICU) were stratified in the severe group. The fold change of gene expression was calculated. P values for each gene expression in different groups were calculated by Wilcoxon rank-sum’s post hoc test. Identified pro-viral factors and anti-viral factors which are differentially expressed (P < 0.05) in these two groups were highlighted with red and green dots, respectively.
Fig. 3
Fig. 3. Validation of host factors identified from the CRISPR dropout screen.
a Performance of identified host factors in previously reported SARS-CoV-2 screens. For each dataset, enriched and depleted hits that meet the listed criteria were marked as red and green squares, respectively. Others that fail to be identified in the listed datasets were marked as grey squares. b Effects of perturbation of top 30 hits on the CPE caused by SARS-CoV-2 infection. Four pro-viral and 26 anti-viral factors were selected for validation. A set of A549-AC cell lines expressing gene-specific gRNAs were infected with recombinant SARS-CoV-2 at MOI = 2.5. The percentages of viable cells were measured at 48 h post-infection. Data were normalized using the viability of corresponding cells at mock conditions. Statistical significance between cells expressing gene-specific gRNAs and non-targeting gRNA (NC) was determined by one-way ANOVA with repeated measurements. At least two independent experiments were performed, and samples were triplicated in each independent experiment. Data were analyzed using one-way ANOVA followed by Dunnett’s post hoc test and were presented as mean values  ±  SD; n  =  3 biologically independent samples. Exact P values were provided in the source data file. *P < 0.05; **P < 0.01; ***P < 0.001; ****P < 0.0001. n.s. not significant.
Fig. 4
Fig. 4. Impacts of top-ranking host factors on virion entry and replication pathways.
a, b Effects of perturbation of top-ranking host factors on CPE caused by SARS-CoV-2 infection at different infection conditions. For gene-specific knockout (KO) effect (a), two pro-viral factors (ATP6V0D1, DPAGT1) and three anti-viral factors (DAZAP2, VTA1, KLF5) were selected. For gene-specific overexpression (OE) effect (b), two anti-viral factors (DAZAP2, VTA1) were selected. Genetically modified A549-AC cells were infected with recombinant SARS-CoV-2 at MOI = 0.5, 2.5, and 5 for 48 h. A549-AC cells expressing a non-targeting gRNA (NC) or the GFP vector served as control cells for the KO and OE experiments, respectively. Data were normalized using the viability of corresponding cells at mock conditions. At least two independent experiments were performed. Data were analyzed using one-way ANOVA followed by Dunnett’s post hoc test and were presented as mean values  ±  SD; n  =  3 biologically independent samples. cf Effects of perturbation of top-ranking host factors on SARS-CoV-2 attachment and entry. Genetically modified A549-AC cells were infected with recombinant SARS-CoV-2 at MOI = 1. To evaluate the changes in the viral attachment (c, d), the infection was performed at 4 °C for 1 h; whereas to evaluate the changes in viral entry (e, f), the infection was performed at 37 °C for 1 h. The levels of RNAs encoding viral N protein and ACTB mRNAs were determined by RT-PCR. Viral RNA levels were normalized using the expression of ACTB mRNA. At least two independent experiments were performed. Data were analyzed using one-way ANOVA followed by Dunnett’s post hoc test and were presented as mean values  ±  SD; n  = 4 biologically independent samples. g, h Effects of perturbation of top-ranking host factors on SARS-CoV-2 replication. A549-AC cells with gene-specific KO (g) or OE (h) were infected with SARS-CoV-2-Nluc at MOI = 0.02, 0.1, and 0.5. The luciferase signals were measured 24 h post-infection. Statistical significances between KO/OE cells and control cells at each infection condition were determined by one-way ANOVA with repeated measurements. At least two independent experiments were performed, and samples were triplicated in each independent experiment. At least two independent experiments were performed. Data were analyzed using one-way ANOVA followed by Dunnett’s post hoc test and were presented as mean values  ±  SD; n  =  3 biologically independent samples. Exact P values were provided in the source data file. *P < 0.05; **P < 0.01; ***P < 0.001; ****P < 0.0001.
Fig. 5
Fig. 5. Molecular impacts of perturbing top-ranking anti-viral host factors.
The transcriptomic profiles of DAZAP2/VTA1/KLF5-KO A549-AC cells and corresponding control cells were characterized by RNA-Seq. a A Venn diagram illustrating the degree of overlapped upregulated DEGs (left panel) and downregulated DEGs (right panel) identified from three types of KO cell lines. The numbers of DEGs that were significantly upregulated or downregulated in each type of KO cell lines ( | Log2FC | >0.25 and FDR < 0.25; compared with control cells) were indicated. b Heatmaps demonstrating mRNA expression changes of 73 shared DEGs among three types of KO cell lines. c Ingenuity Pathway Analysis of results from the shared DEGs among three types of KO cell lines. The top 15 canonical pathways displaying statistical significance were listed. P values for each gene set were calculated by using a Right-Tailed Fisher’s Exact Test. d Upregulation of SERPINE1 in DAZAP2/VTA1/KLF5-KO A549-AC cells and downregulation of SERPINE1 in DAZAP2-OE A549-ACE2 cells. mRNA levels of SERPINE1 (upper panel) and protein levels of SERPINE1 (lower panel) were detected by real-time PCR and western blot, respectively. At least two independent experiments were performed. Data were analyzed using one-way ANOVA followed by Dunnett’s post hoc test or unpaired T test with two tails and were presented as mean values  ±  SD; n  =  3 biologically independent samples. Exact P values were provided in the source data file. ***P < 0.001; ****P < 0.0001.

Update of

Similar articles

Cited by

References

    1. Johns Hopkins University Coronavirus Resource Center. Mortality analyses. https://coronavirus.jhu.edu/data/mortality (2023).
    1. Lu R, et al. Genomic characterisation and epidemiology of 2019 novel coronavirus: implications for virus origins and receptor binding. Lancet. 2020;395:565–574. doi: 10.1016/S0140-6736(20)30251-8. - DOI - PMC - PubMed
    1. Huang HY, et al. Landscape and progress of global COVID-19 vaccine development. Hum. Vaccin. Immunother. 2021;17:3276–3280. doi: 10.1080/21645515.2021.1945901. - DOI - PMC - PubMed
    1. Gordon, D. E. et al. Comparative host-coronavirus protein interaction networks reveal pan-viral disease mechanisms. Science370, eabe9403 10.1126/science.abe9403 (2020). - PMC - PubMed
    1. Chen Z, et al. Interactomes of SARS-CoV-2 and human coronaviruses reveal host factors potentially affecting pathogenesis. EMBO J. 2021;40:e107776. doi: 10.15252/embj.2021107776. - DOI - PMC - PubMed

Publication types

Substances