. 2024 Jan 2;15(1):112.
doi: 10.1038/s41467-023-44373-x.

Gut microbiota facilitate chronic spontaneous urticaria

Affiliations

Gut microbiota facilitate chronic spontaneous urticaria

Lei Zhu et al. Nat Commun. .

Abstract

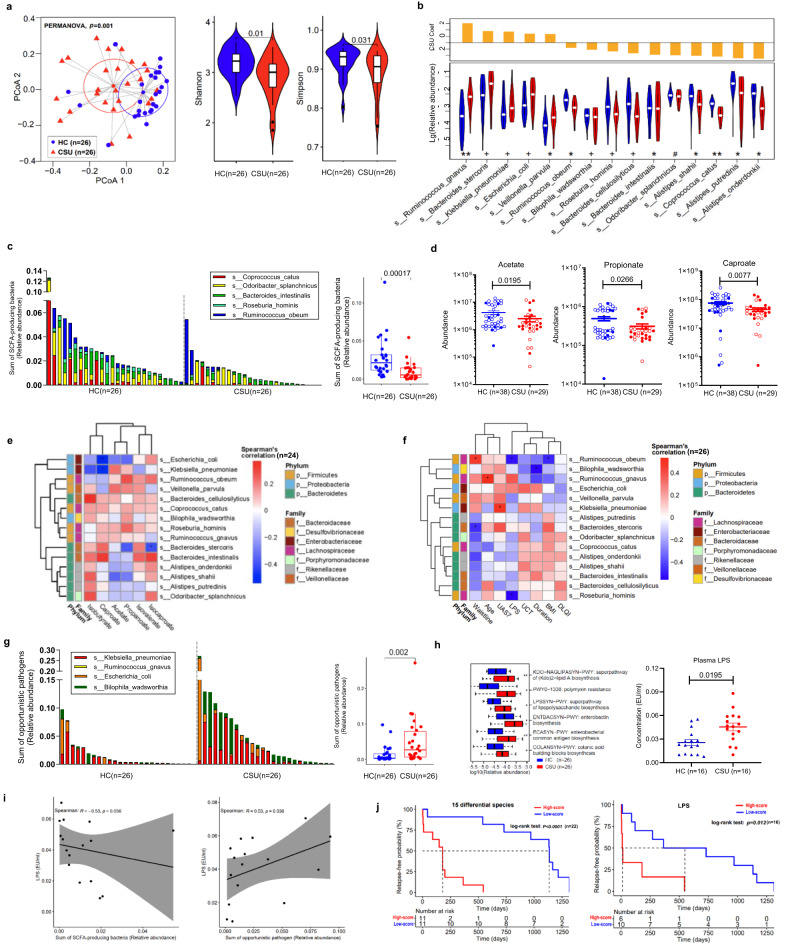
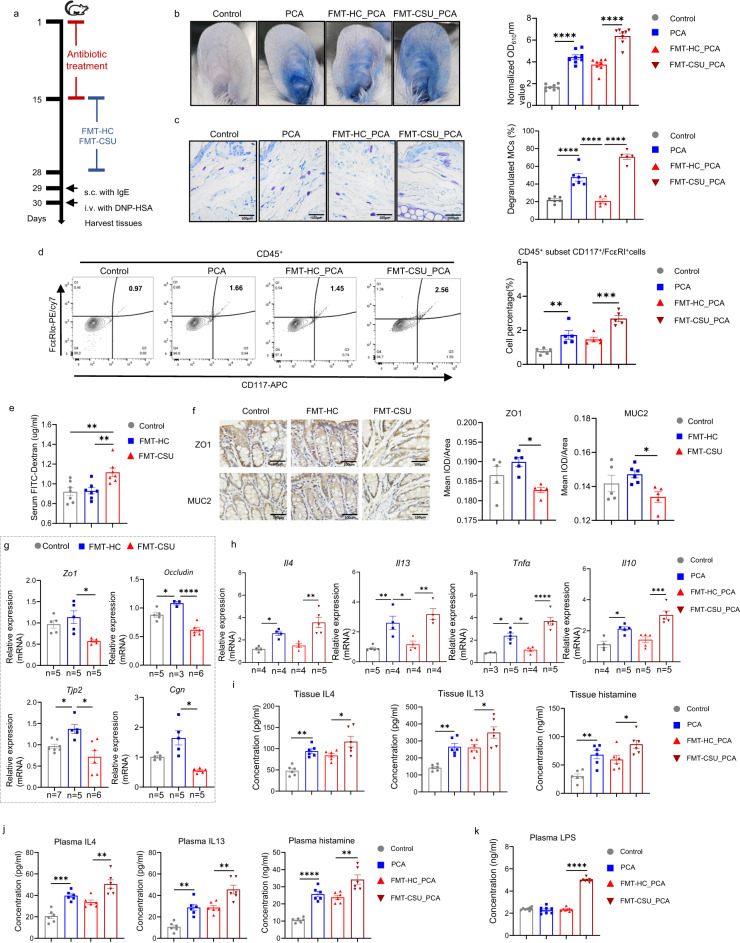
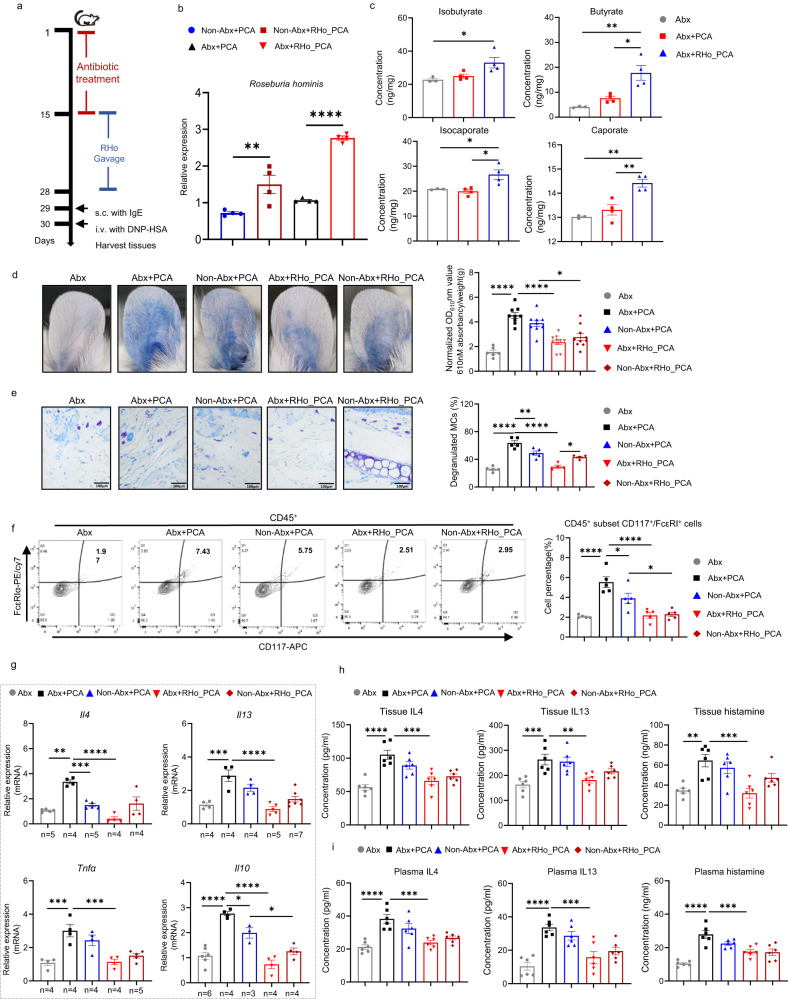
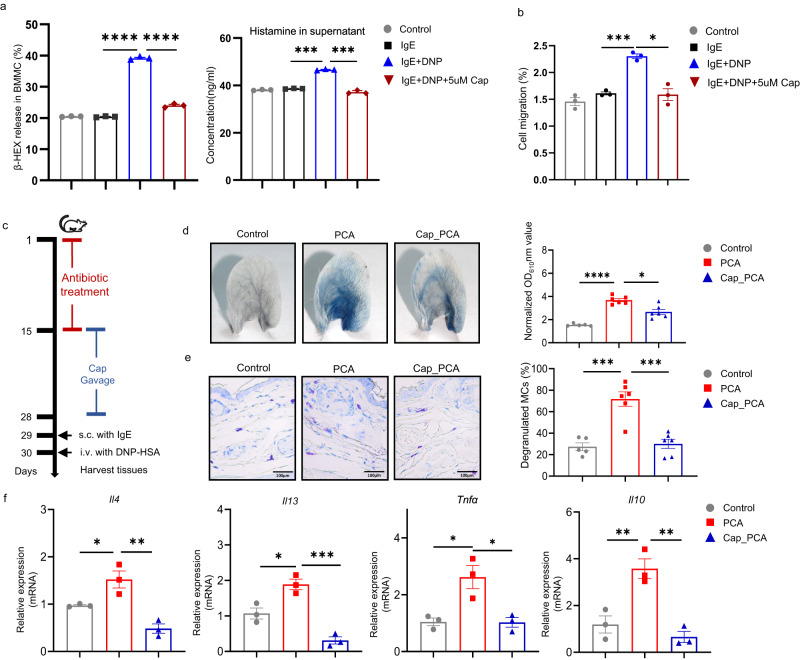
Chronic spontaneous urticaria (CSU) comes with gut dysbiosis, but its relevance remains elusive. Here we use metagenomics sequencing and short-chain fatty acids metabolomics and assess the effects of human CSU fecal microbial transplantation, Klebsiella pneumoniae, Roseburia hominis, and metabolites in vivo. CSU gut microbiota displays low diversity and short-chain fatty acids production, but high gut Klebsiella pneumoniae levels, negatively correlates with blood short-chain fatty acids levels and links to high disease activity. Blood lipopolysaccharide levels are elevated, link to rapid disease relapse, and high gut levels of conditional pathogenic bacteria. CSU microbiome transfer and Klebsiella pneumoniae transplantation facilitate IgE-mediated mast cell(MC)-driven skin inflammatory responses and increase intestinal permeability and blood lipopolysaccharide accumulation in recipient mice. Transplantation of Roseburia hominis and caproate administration protect recipient mice from MC-driven skin inflammation. Here, we show gut microbiome alterations, in CSU, may reduce short-chain fatty acids and increase lipopolysaccharide levels, respectively, and facilitate MC-driven skin inflammation.


Conflict of interest statement

M.Ma is or recently was a speaker and/or advisor for and/or has received research funding from Astria, Allakos, Alnylam, Amgen, Aralez, ArgenX, AstraZeneca, BioCryst, Blueprint, Celldex, Centogene, CSL Behring, Dyax, FAES, Genentech, GIInnovation, GSK, Innate Pharma, Kalvista, Kyowa Kirin, Leo Pharma, Lilly, Menarini, Moxie, Novartis, Pfizer, Pharming, Pharvaris, Roche, Sanofi/Regeneron, Shire/Takeda, Third Harmonic Bio, UCB, and Uriach. All other authors declare no competing interests.

Figures

Fig. 1
Fig. 1. CSU comes with reduced gut microbiome diversity, lower levels of SCFA-producing gut bacteria, higher levels of conditional pathogenic gut bacteria, decreased blood levels of SCFAs, and increased blood levels of LPS, which drive disease relapse.
a PCoA presents β-diversities based on Bray–Curtis dissimilarity determined by PERMANOVA, and α-diversity by Shannon and Simpson indices. HC vs CSU. b The 15 differential species identified by MaAsLin2 with BH correction. #P < 0.2, +P < 0.1, *P < 0.05, **P < 0.01. c Comparison of SCFA-producing bacteria between HC and CSU. d Abundance of acetate, propionate, and caproate through targeted metabolomics. e Spearman’s correlation between SCFAs and differential species. f Spearman’s correlation between differential species and clinical characteristics of CSU. The blocks in red or blue denote positive and negative correlation, respectively. The color gradient represents the strength of correlation. g Abundance of opportunistic pathogens was compared between HC and CSU. h LPS-related metabolic pathways and comparison of LPS level between HC and CSU. i Spearman’s correlations between plasma LPS and sum of SCFA-producing bacteria or opportunistic pathogens. The line represents center of overall linear fit, with gray areas standing for the standard error of 95% confidence interval. j Relapse-free analysis based on the 15 differential species or plasma LPS by log-rank test. The data are presented as mean ± SEM. P values were provided in Source Data File for b, e, and f. Two-tailed Wilcoxon test were used for a right, c, g right and h left. Two-tailed t tests were used for d, h right. The shape and whiskers of violin plot respectively represent density distribution and overall range of the data in a and b. The center and bounds of box respectively represent median, the lower quartile (Q1) and the upper quartile (Q3) were in ac, g, and h. The whiskers denote the lower quartile minus 1.5 times the IQR and the upper quartile plus 1.5 times the IQR in c, g and h. SCFAs short-chain fatty acids, HC healthy controls, CSU chronic spontaneous urticaria, BMI body mass index, UAS7 weekly urticaria activity score, DLQI Dermatology Life Quality Index, UCT Urticaria Control Test. Source data are provided as a Source Data file.
Fig. 2
Fig. 2. The microbiome of CSU increases mast cell-driven skin inflammation, intestinal permeability, and blood LPS level.
a FMT mice model experimental design. b Representative ear images and the quantification of Evans blue dye (n = 8/group. Control vs PCA, P < 0.0001; FMT-HC_PCA vs FMT-CSU_PCA, P < 0.0001). c Representative images of MCs (×400 magnificent) and the percentages of degranulated MCs in mouse ear. Control (n = 6) vs PCA (n = 6), P < 0.0001; PCA vs FMT-HC_PCA (n = 5), P < 0.0001; FMT-HC_PCA vs FMT-CSU_PCA (n = 5), P < 0.0001. d Representative images of flow cytometry and the percentages of MCs in mouse skin (n = 5/group. Control vs PCA, P = 0.0071; FMT-HC_PCA vs FMT-CSU_PCA, P = 0.0008). e The amount of FITC-dextran detected in serum (n = 7/group. Control vs FMT-CSU, P = 0.0053; FMT-HC vs FMT-CSU, P = 0.0075). f Representative images of immunohistochemistry (×400 magnificent) and the quantification of ZO1 and MUC2 in mouse colon. FMT-HC vs FMT-CSU, P = 0.0132 (ZO1), and 0.0371 (MUC2). g mRNA expression of Zo1, Occludin, Tjp2 and Cgn in mouse colon. FMT-HC vs FMT-CSU, P = 0.0421 (Zo1), <0.0001 (Occludin), P = 0.0228 (Tjp2), and 0.0215 (Cgn), respectively. Control vs FMT-HC, P = 0.0263 (Occludin), 0.0360 (Tjp2). h mRNA expression of Il4, Il13, Tnfα and Il10 in ear skin (Control vs PCA, P = 0.0388, 0.0050, 0.0109, and 0.0191; FMT-HC_PCA vs FMT-CSU_PCA, P = 0.0018,0.0020, <0.0001, and 0.0002 for Il4, Il13, Tnfα and Il10, respectively; PCA vs FMT-HC_PCA, P = 0.0235 (Il13), 0.0215 (Tnfα). i Levels of IL4, IL13, and histamine in mouse ear skin (n = 6/group. Control vs PCA, P = 0.0019, 0.0033, and 0.0032; FMT-HC_PCA vs FMT-CSU_PCA, P = 0.0321, 0.0410, and 0.0405 for IL4, IL13, and histamine, respectively) and j plasma detected by ELISA (n = 6/group. Control vs PCA, P = 0.0003, 0.0012, and <0.0001; FMT-HC_PCA vs FMT-CSU_PCA, P = 0.0012, 0.0023, and 0.0019 for IL4, IL13, and histamine, respectively). k Plasma LPS detected by ELISA (n = 8/group. FMT-HC_PCA vs FMT-CSU_PCA, P < 0.0001). *P < 0.05, **P < 0.01, ***P < 0.001, ****P < 0.0001, based on either one-way ANOVAs with Tukey’s multiple comparisons test (bf, g, Zo1/Occludin/Tjp2, hk) or Brown–Forsythe and Welch ANOVA test (g, CGN). The data are presented as mean ± SEM of three independent experiments. Control: Solvents; PCA: Solvents+ IgE/DNP-HSA; FMT-HC_PCA: FMT from healthy control + IgE/DNP-HSA; FMT-CSU_PCA: FMT from CSU patients+ IgE/DNP-HSA. FMT fecal microbial transplantation, MCs mast cells. The numbers of biologically independent samples used in g and h is depicted in the figure. Source data are provided as a source data file.
Fig. 3
Fig. 3. Roseburia hominis attenuates mast cell-driven skin inflammation.
a Roseburia hominis administration experimental design. b Abundance of Roseburia hominis by RT-PCR. (n = 4/group. Non-Abx+PCA vs Non-Abx+RHo_PCA, P = 0.0050; Abx+PCA vs Abx+RHo_PCA, P < 0.0001). c Abundance of SCFAs was tested by targeted metabolomics from cecal content of mice. Abx (n = 3) vs Abx+RHo_PCA (n = 4), P = 0.0316 (Isobutyrate), 0.0034 (butyrate), 0.0390 (isocaporate), and 0.0014 (caporate), respectively. Abx+PCA (n = 4) vs Abx+RHo_PCA (n = 4), P = 0.0116 (butyrate), 0.0140 (isocaporate), and 0.0036 (caporate), respectively. d Representative ear images and the quantification of Evans blue dye. Abx (n = 6) vs Abx+PCA (n = 9), P < 0.0001; Abx+PCA vs Abx+RHo_PCA (n = 10), P < 0.0001; Non-Abx_PCA (n = 9) vs Non-Abx+RHo_PCA (n = 10), P = 0.0106. e Representative images (×400 magnification) and the percentages of degranulated MCs in mouse skin. Abx (n = 5) vs Abx+PCA (n = 5), P < 0.0001; Abx+PCA vs Non-Abx+PCA (n = 5), P = 0.0042; Abx+PCA vs Abx+RHo_PCA (n = 4), P < 0.0001; Abx+RHo_PCA vs Non-Abx+RHo_PCA (n = 4), P = 0.0157. f Representative images of flow cytometry and the percentage of MCs in skin (n = 5/group. Abx vs Abx+PCA, P < 0.0001; Abx+PCA vs Non-Abx+PCA, P = 0.0376; Abx+PCA vs Abx+RHo_PCA, P < 0.0001; Non-Abx+PCA vs Non-Abx+RHo_PCA, P = 0.0408). g mRNA expression of Il4, Il13, Tnfα and Il10 in mouse ear skin (n for each group was provided in Source Data. Abx vs Abx+PCA: P = 0.0011 (Il4), 0.0002 (Il13), 0.0004 (Tnfα), and <0.0001 (Il10), respectively; Abx+PCA vs Non-Abx+PCA, P = 0.0005 (Il4), and 0.0333 (Il10), respectively. Abx+PCA vs Abx+RHo_PCA, P < 0.0001 (Il4 and Il13), 0.0005 (Tnfα), and <0.0001 (Il10), respectively. Non-Abx+PCA vs Non-Abx+RHo_PCA, P = 0.0434 (Il10). h Levels of IL4, IL13, and histamine in mouse ear skin (n = 6/group. Abx vs Abx+PCA, P < 0.0001, 0.0009, and 0.0021; Abx+PCA vs Abx+RHo_PCA, P = 0.0002, 0.0077, and 0.0008, for IL4,IL13,and histamine, respectively) and i plasma detected by ELISA (n = 6/group. Abx vs Abx+PCA, all P < 0.0001; Abx+PCA vs Abx+RHo_PCA, P = 0.0004, 0.0005, and 0.0007, for IL4, IL13, and histamine, respectively). Abx:drinking water with Abx; Abx+PCA: drinking water with Abx+ IgE/DNP-HSA; Non-Abx+PCA: drinking water with solvents + IgE/DNP-HSA; Abx+RHo_PCA: drinking water with Abx + gavage with RHo + IgE/DNP-HSA; Non-Abx+RHo_PCA: drinking water with solvents+ gavage with RHo + IgE/DNP-HSA. One-way ANOVAs with Tukey’s multiple comparisons test was used for b, c, df right, gi. The data are presented as mean ± SEM of three independent experiments. *P < 0.05, **P < 0.01, ***P < 0.001, ****P < 0.0001. Abx antibiotics, RHo roseburia hominis. The number of biologically independent samples used in g is depicted in the figure. Source data are provided as a Source Data file (347/350).
Fig. 4
Fig. 4. SCFAs attenuate mast cell-driven skin inflammation and mast cell function.
a Release of β-hexosaminidase (left: n = 3/group. IgE vs IgE+DNP, IgE+DNP vs IgE+DNP+5uM Cap, both P < 0.0001) as well as concentration of histamine (right: n = 3/group. IgE vs IgE+DNP, P = 0.0006; IgE+DNP vs IgE+DNP+5uM Cap, P = 0.0005) from BMMCs. b Cell migration of BMMCs (n = 3/group, IgE vs IgE+DNP, P = 0.0007; IgE+DNP vs IgE+DNP+5uM Cap, P = 0.0245). c Caproate administration PCA mice model experimental design. d Representative ear images after PCA and the quantification of Evans blue dye. Control (n = 5) vs PCA (n = 6), P < 0.0001; PCA vs Cap_PCA (n = 6), P = 0.0115. e Representative images and the percentages of degranulated MCs in mouse ear. Control (n = 5) vs PCA (n = 6), P = 0.0001; PCA vs Cap_PCA (n = 6), P = 0.0001. f mRNA expression of Il4, Il13, Tnfα and Il10 in mouse ear skin (n = 3/group. Control vs PCA, P = 0.0392, 0.0133, 0.0136, and 0.0070; PCA vs Cap_PCA, P = 0.0020, 0.0005, 0.0128, and 0.0025 for Il4, Il13, Tnfα, and Il10, respectively). Control: gavage with solvents; PCA: gavage with solvents+IgE/DNP-HSA; Cap_PCA: gavage with caproate+IgE/DNP-HSA. One-way ANOVAs with Tukey’s multiple comparisons test was used for ac, e and f or Brown–Forsythe and Welch ANOVA test for d. The data are presented as mean ± SEM of three independent experiments. *P < 0.05, **P < 0.01, ***P < 0.001, ****P < 0.0001. Source data are provided as a Source Data file.
Fig. 5
Fig. 5. Klebsiella pneumoniae and LPS exacerbate mast cell-driven skin inflammation.
a Klebsiella pneumoniae administration experimental design. b Representative ear images and quantification of Evans blue dye. Control (n = 9) vs PCA (n = 8), P < 0.0001; FMT-HC_PCA (n = 8) vs FMT-CSU_PCA (n = 8), P = 0.0027; FMT-HC_PCA vs KPn_PCA (n = 10), P < 0.0001; FMT-CSU_PCA vs KPn_PCA, P = 0.0314. c Representative images of toluidine blue staining (×400 magnification) and the percentages of degranulated MCs in mouse ear. Control (n = 5) vs PCA (n = 5), P = 0.0018; PCA vs FMT-HC_PCA (n = 5), P = 0.0174; FMT-HC_PCA vs FMT-CSU_PCA (n = 4); P = 0.0028, FMT-HC_PCA vs KPn_PCA (n = 5), P = 0.0012. d mRNA expression of Il4, Il13 in ear skin. Il4: PCA vs FMT-CSU_PCA, P = 0.0150; PCA vs KPn_PCA, P = 0.0002; FMT-HC_PCA vs FMT-CSU_PCA, P < 0.0001. FMT-HC_PCA vs KPn_PCA, P < 0.0001. Il13: PCA vs KPn_PCA, P = 0.0088; FMT-HC_PCA vs KPn_PCA, P = 0.0002; FMT-HC_PCA vs FMT-CSU_PCA, P = 0.0247. e Levels of IL4, IL10, LPS in mouse plasma. IL4: Control (n = 6) vs KPn_PCA (n = 6), P = 0.0250; FMT-HC_PCA (n = 7) vs FMT-CSU_PCA (n = 7), P = 0.0139. IL10: FMT-HC_PCA (n = 6) vs FMT-CSU_PCA (n = 8), P = 0.0371. LPS: PCA (n = 5) vs FMT-CSU_PCA (n = 8), P = 0.0426; PCA vs KPn_PCA (n = 8), P = 0.0080; FMT-HC_PCA (n = 6) vs FMT-CSU_PCA (n = 8), P = 0.0469; FMT-HC_PCA vs KPn_PCA (n = 8), P = 0.0099. f β-hexosaminidase release in BMMCs (n = 3/group. Control vs IgE+DNP, P = 0.0170; IgE vs IgE+DNP, P = 0.0170; IgE+DNP vs IgE+DNP + 100 ng/ml LPS, P = 0.0251). g LPS administration experimental design. h Representative ear images and the quantification of Evans blue dye. Control (n = 5) vs PCA (n = 10), P < 0.0001; PCA vs LPS_PCA (n = 10), P = 0.0260. i Representative images of toluidine blue staining (×400 magnification) and the percentages of degranulated MCs in ear. Control (n = 6) vs PCA (n = 5), P = 0.0036; PCA vs LPS_PCA (n = 5), P = 0.0006. j mRNA expression of Il4, Il13, Tnfα and Il10 in mouse ear skin. Control vs PCA, P = 0.0145 (Il4), and 0.0015 (Il13). PCA vs LPS_PCA, P = 0.0360 (Il4), 0.0024 (Il13), 0.0147 (Tnfα), and 0.0050 (Il10). Control: Solvents; FMT-HC_PCA: FMT from healthy control + IgE/DNP-HSA; FMT-CSU_PCA: FMT from CSU patients + IgE/DNP-HSA; KPn_PCA: Gavage with KPn+IgE/DNP-HSA; LPS_PCA: Gavage with LPS+IgE/DNP-HSA. One-way ANOVAs with Tukey’s multiple comparisons test One-way ANOVA was used for ad, e IL4/LPS, fj. Brown–Forsythe and Welch ANOVA test was used for e IL10. The data are presented as mean ± SEM of three independent experiments. *P < 0.05, **P < 0.01, ***P < 0.001, ****P < 0.0001. KPn Klebsiella pneumonia, LPS lipopolysaccharides. The number of biologically independent samples used in d and j is depicted in the figure. Source data are provided as a Source Data file.
Fig. 6
Fig. 6. TLR4 plays an important role in LPS exacerbated mast cell-driven skin inflammation.
a LPS administration on Tlr4+/+ and Tlr4−/− mice experimental design. b Representative ear images and the quantification of Evans blue dye. Control (n = 6) vs PCA (n = 9), P = 0.0004; PCA vs Tlr4+/+-LPS_PCA (n = 9), P = 0.0203; Tlr4+/+-LPS_PCA vs Tlr4−/−-LPS_PCA (n = 7), P = 0.0006. c Representative images of toluidine blue staining (×400 magnification) and the percentages of degranulated MCs in mouse ear skin. Control (n = 4) vs PCA (n = 5), P = 0.0002; PCA vs Tlr4+/+-LPS_PCA (n = 5), P = 0.0110; Tlr4+/+-LPS_PCA vs Tlr4−/−-LPS_PCA (n = 5), P < 0.0001. d Representative images of flow cytometry and the percentage of activated MCs in mouse ear skin (n = 5/group. Control vs PCA, P = 0.0009; Tlr4+/+-LPS_PCA vs Tlr4-/--LPS_PCA, P = 0.0439). e mRNA expression of Il4, Il13 and Tnfα in mouse ear skin (Il4: Control vs PCA, P = 0.0030; PCA vs Tlr4+/+-LPS_PCA, P = 0.0094; Tlr4+/+-LPS_PCA vs Tlr4−/−-LPS_PCA, P < 0.0001. Il13: PCA vs Tlr4+/+-LPS_PCA, P = 0.0007; Tlr4+/+-LPS_PCA vs Tlr4−/−-LPS_PCA, P = 0.0005. Tnfα: Tlr4+/+-LPS_PCA vs Tlr4−/−-LPS_PCA, P = 0.0007. f Levels of IL4, IL13, histamine in mouse ear skin (Control, n = 5; PCA, Tlr4+/+-LPS_PCA, Tlr4−/−-LPS_PCA, n = 6/group. Control vs PCA, P = 0.0181 (IL4), and 0.0006 (IL13); PCA vs Tlr4+/+-LPS_PCA, P = 0.0152 (IL-4), 0.0076 (IL-13), and 0.0166 (histamine); Tlr4+/+-LPS_PCA vs Tlr4−/−-LPS_PCA, P = 0.0017 (IL4), 0.0003 (IL13), and <0.0001 (histamine), respectively) and g plasma detected by ELISA (Control, n = 6 for IL4, n = 5 for IL13 and histamine; PCA, Tlr4+/+-LPS_PCA, Tlr4−/−-LPS_PCA, n = 6/group. Control vs PCA, P = 0.0132 (IL4), 0.0105 (IL13), 0.0011 (histamine), respectively; PCA vs Tlr4+/+-LPS_PCA, P = 0.0001(IL-4), 0.0297(IL-13), and 0.0378 (histamine), respectively; Tlr4+/+-LPS_PCA vs Tlr4−/−-LPS_PCA, P < 0.0001 (IL4), 0.0003 (IL13), and <0.0001 (histamine), respectively. h β-hexosaminidase release, cell migration and concentration of histamine in BMMCs from Tlr4+/+ and Tlr4−/− mice treated with LPS (n = 3/group). Tlr4+/+IgE+DNP vs Tlr4−/−IgE+DNP, Tlr4+/+IgE+DNP + 10 ng/ml LPS vs Tlr4−/−IgE+DNP + 10 ng/ml LPS, Tlr4+/+IgE+DNP + 100 ng/ml LPS vs Tlr4−/−IgE+DNP + 100 ng/ml LPS, all P < 0.0001 for β-hexosaminidase and histamine release; Tlr4+/+IgE+DNP vs Tlr4−/−IgE+DNP, P = 0.0001 for cell migration. One-way ANOVAs with Tukey’s multiple comparisons test was used for bd right, eg. Two tailed t test was used for h. The data are presented as mean ± SEM of three independent experiments. *P < 0.05, **P < 0.01, ***P < 0.001, ****P < 0. 0001.The number of biologically independent samples used in e and g is depicted in the figure. Source data are provided as a Source Data file.
Fig. 7
Fig. 7. Cefoperazone/sulbactam reduces mast cell activation in Klebsiella pneumoniae-exacerbated PCA reaction.
a Experimental design of cefoperazone/sulbactam treated Klebsiella pneumoniae transplanted mice. b Representative ear images and the quantification of Evans blue dye. Control (n = 4) vs KPn_PCA (n = 7), P < 0.0001; KPn_PCA vs KPn_CPZ/SBT_PCA (n = 7), P = 0.0006. c Representative images of toluidine blue (×400 magnification) and the percentages of degranulated MCs in ear. Control (n = 3) vs KPn_PCA (n = 4), P = 0.0021; KPn_PCA vs KPn_CPZ/SBT_PCA (n = 4), P = 0.0164. d mRNA expression of Il4, Il13, Tnfα and Il10 in mouse ear skin. Control vs KPn_PCA, P = 0.0034 (Il4), 0.0003 (Il13), 0.0003 (Tnfα), and 0.0185 (Il10), respectively; KPn_PCA vs KPn_CPZ/SBT_PCA, P = 0.0037 (Il4), 0.0002 (Il13), 0.0064 (Tnfα), and 0.0080 (Il10), respectively. e Plasma level of LPS detected by ELISA. Control (n = 4) vs KPn_PCA (n = 6), P = 0.0003; KPn_PCA vs KPn_CPZ/SBT_PCA (n = 6), P = 0.0010. f Schematic of gut microbiota facilitating chronic spontaneous urticaria. One-way ANOVAs with Tukey’s multiple comparisons test was used for b right, c right, d and e. The data are presented as mean ± SEM of three independent experiments. *P < 0.05, **P < 0.01, ***P < 0.001, ****P < 0.0001. CPZ/SBT cefoperazone/sulbactam. The number of biologically independent samples used in d is depicted in the figure. Source data are provided as a Source Data file.

Similar articles

Cited by

References

    1. Kolkhir P, et al. Urticaria. Nat. Rev. Dis. Prim. 2022;8:61. doi: 10.1038/s41572-022-00389-z. - DOI - PubMed
    1. Fricke J, et al. Prevalence of chronic urticaria in children and adults across the globe: Systematic review with meta-analysis. Allergy. 2020;75:423–432. doi: 10.1111/all.14037. - DOI - PubMed
    1. Zhang X, et al. Prevalence and risk factors of chronic urticaria in China: a nationwide cross-sectional study. Allergy. 2022;77:2233–2236. doi: 10.1111/all.15287. - DOI - PubMed
    1. Gonçalo M, et al. The global burden of chronic urticaria for the patient and society. Br. J. Dermatol. 2021;184:226–236. doi: 10.1111/bjd.19561. - DOI - PubMed
    1. Giménez-Arnau AM, et al. Consensus on the definition of control and remission in chronic urticaria. J. Investig. Allergol. Clin. Immunol. 2022;32:261–269. doi: 10.18176/jiaci.0820. - DOI - PubMed

Publication types

Supplementary concepts

LinkOut - more resources