. 2024 Jan 2;15(1):61.
doi: 10.1038/s41467-023-44095-0.

Microbial co-occurrences on catheters from long-term catheterized patients

Affiliations

Microbial co-occurrences on catheters from long-term catheterized patients

Taylor M Nye et al. Nat Commun. .

Abstract

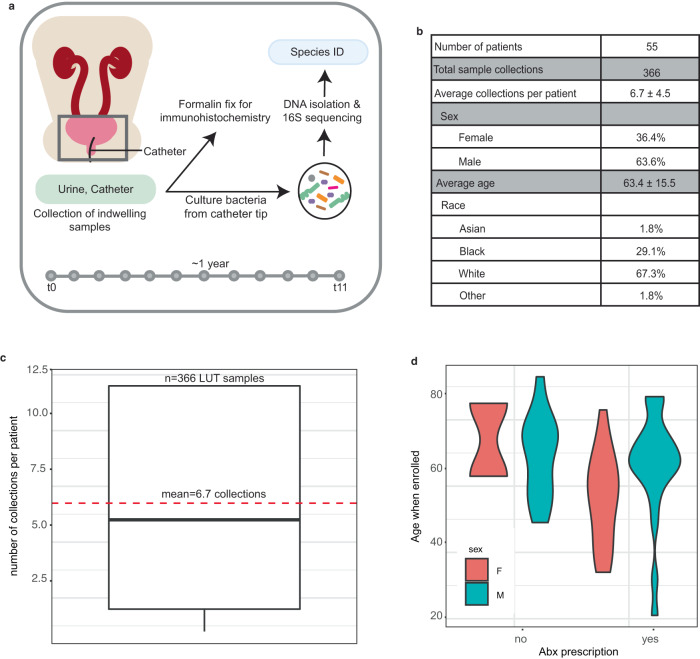
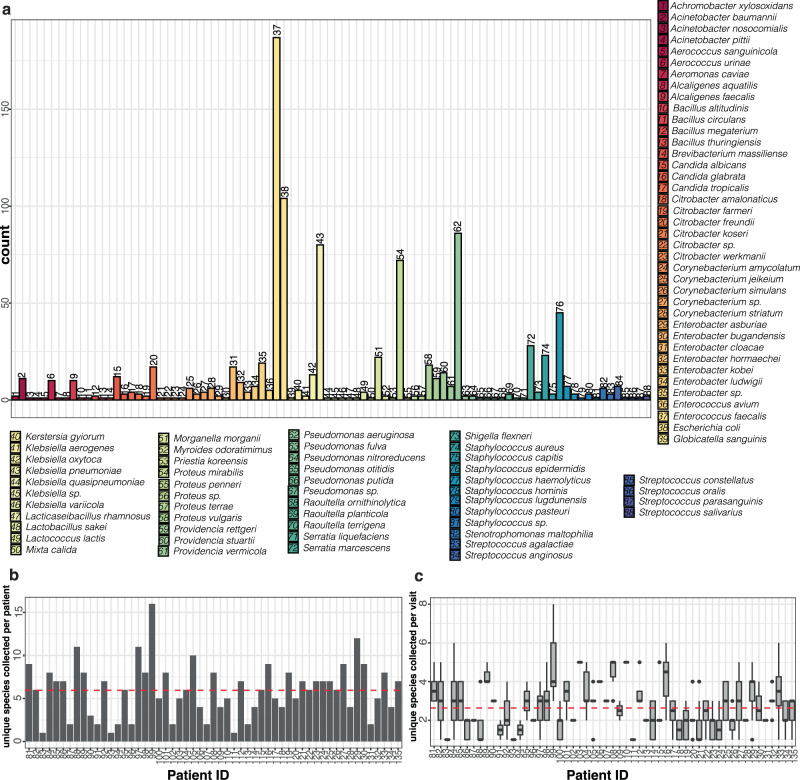
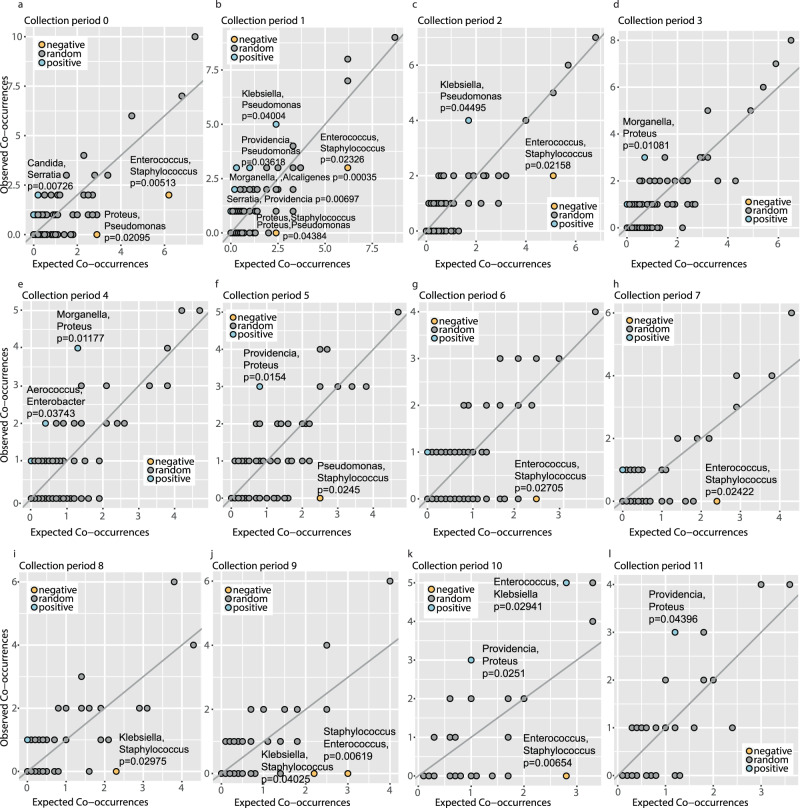
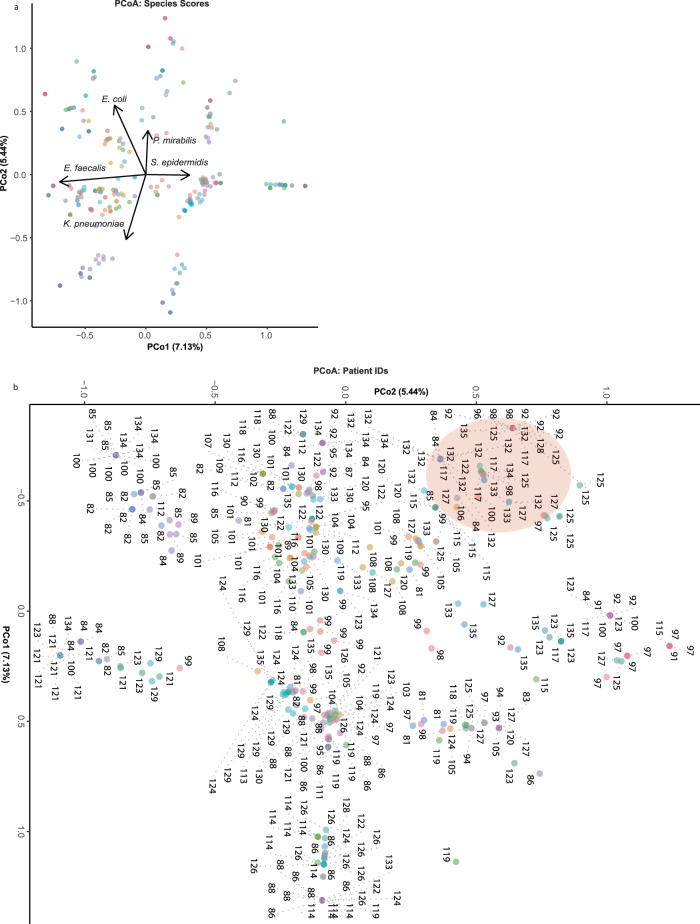
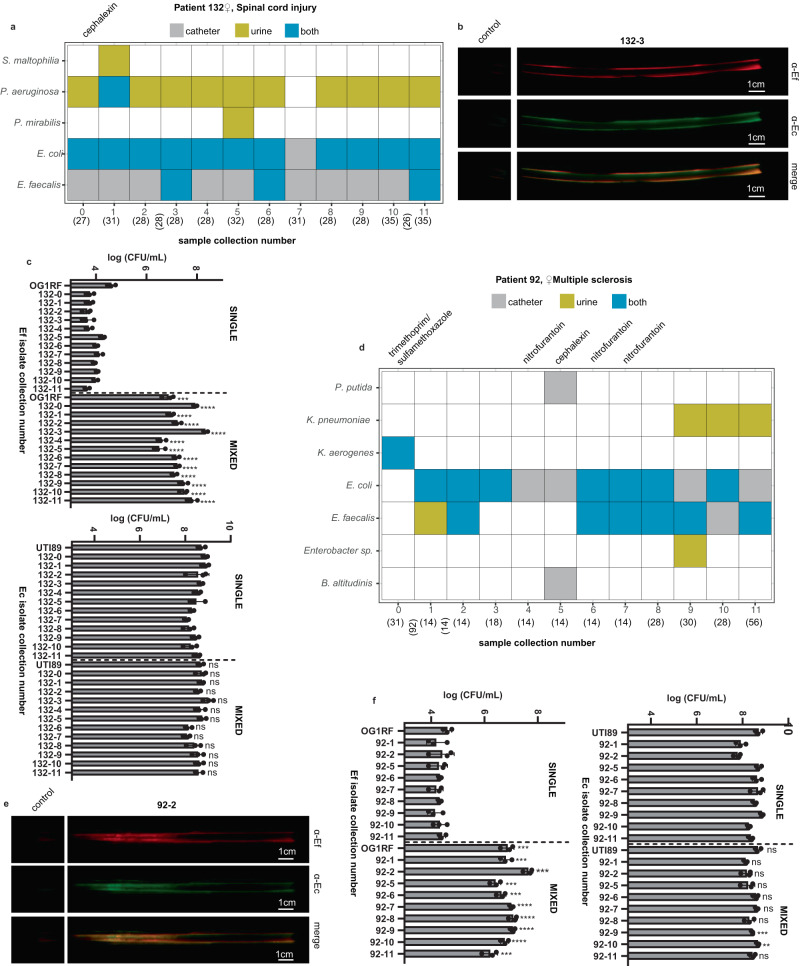
Catheter-associated urinary tract infections (CAUTIs), a common cause of healthcare-associated infections, are caused by a diverse array of pathogens that are increasingly becoming antibiotic resistant. We analyze the microbial occurrences in catheter and urine samples from 55 human long-term catheterized patients collected over one year. Although most of these patients were prescribed antibiotics over several collection periods, their catheter samples remain colonized by one or more bacterial species. Examination of a total of 366 catheter and urine samples identify 13 positive and 13 negative genus co-occurrences over 12 collection periods, representing associations that occur more or less frequently than expected by chance. We find that for many patients, the microbial species composition between collection periods is similar. In a subset of patients, we find that the most frequently sampled bacteria, Escherichia coli and Enterococcus faecalis, co-localize on catheter samples. Further, co-culture of paired isolates recovered from the same patients reveals that E. coli significantly augments E. faecalis growth in an artificial urine medium, where E. faecalis monoculture grows poorly. These findings suggest novel strategies to collapse polymicrobial CAUTI in long-term catheterized patients by targeting mechanisms that promote positive co-associations.


Conflict of interest statement

The authors declare no competing interests.

Figures

Fig. 1
Fig. 1. Identifying the temporal microbial community composition from the urine and catheters of long-term catheterized patients.
a Study design. Catheter and urine samples were collected approximately monthly from long-term catheterized patients during catheter exchange. A portion of the catheter was fixed in formalin for immunohistochemistry. The microbes from the catheter and urine samples were cultured and identified via a 16 S sequencing approach. b Patient demographics. c Boxplot of average collections per patient included in the cohort. The bottom and top ends of the gray rectangle indicate the lower and upper quartile for the number of collections per patient, respectively, with the median indicated within the rectangle. The whiskers indicate the minimum number of collections per patient that are not outliers (within 1.5x the interquartile range). Average (mean) collection periods per patient is indicated by a dashed red line. d Violin plots representing patient age and antibiotic use over the course of the study.
Fig. 2
Fig. 2. Multiple genera detected per patient in long-term-catheterized patient cohort.
a Count data of the indicated genera detected in the catheter and urine samples in the long-term catheterization cohort. b The frequency of indicated genera detected over sample collection periods for patients with 9 or more collection periods. Higher frequencies are indicated in yellow while lower frequencies are in black. c The site of collected genera isolated from long-term catheterized patients. Each individual collection period is listed in order (0–11) for the indicated patients. The genera identified by 16 S sequencing is indicated on the y axis. Genera isolated from urine are colored yellow, from a catheter are colored in gray, and from both catheter and urine are colored in blue. If a genus is not present during a collection period, it is white. d Detected genera, indicated by colored key, by patient over all collection periods. Source data are provided as a Source Data file.
Fig. 3
Fig. 3. The polymicrobial community composition of long-term catheterized patients averages 5–6 species per patient but only 2–3 species per collection period and are dominated by species that are frequently uropathogenic.
a Number of occurrences of indicated species per patient per collection period detected in the catheter and/or urine samples in the long-term catheterization cohort. Numbers above bars correspond to numbered species key. b The number of unique species identified per patient. Average (mean) of species identified across all patients (n = 55) is indicated by a dashed red line. c Boxplots of the number of unique species identified per patient per collection period. The bottom and top ends of the gray rectangle indicate the lower and upper quartile for the number of species identified per collection, respectively, with the median indicated within the rectangle. The whiskers indicate the maximum and minimum species detected that are not outliers (within 1.5× the interquartile range). For patients with 2 or fewer collection periods, the number of unique species identified are indicated by dots. Average (mean) of species identified across all collection periods (n = 366) is indicated by a dashed red line. Source data are provided as a Source Data file.
Fig. 4
Fig. 4. Identification of positive and negative pairwise species co-occurrences from lower urinary tract samples of long-term catheterized patients.
al Number of expected co-occurrences (x axis) and observed co-occurrences between each pair of genera during the indicated collection period. Negative pairwise genera co-occurrences are indicated in gold, positive in blue, and random interactions are in gray. For each significant interaction with an expected co-occurrence greater than 0, the pairwise genera interaction and significance are indicated. The significance is based on the probability that two species co-occur at a frequency greater or less than the observed co-occurrence frequency, which can be used as P values. Source data are provided as a Source Data file.
Fig. 5
Fig. 5. Principal Coordinate Analysis of microbial community composition for each individual collection period.
PCoA of microbial community composition, based on presence/absence data of all species identified in the long-term catheterized patient cohort for each individual collection period. Points represent individual collection periods that are colored by patient ID. a Species scores are indicated by arrows in the PCoA. b Patient IDs are noted for each point, with dashed gray lines extending to patient ID number where points overlap. The cluster of points representing all 12 Patient 132 collection periods is shaded in red. Some individual collection points overlap on the plot where community composition was very similar/identical. Source data are provided as a Source Data file.
Fig. 6
Fig. 6. E. faecalis and E. coli co-localize on patient catheters and E. coli clinical isolates augment growth of E. faecalis clinical isolates in AUM.
Clinical isolates collected from Patient 132 (a) and Patient 92 (d). Collection period is indicated on the x axis with the duration of the period in parenthesis (days). The duration (days) of missed collection periods due to hospitalization or other causes are listed in vertical parenthesis between collection periods. Species detected within the patient are indicated on the y axis, with gray denoting the species isolated from the catheter, yellow from the urine, and blue from the catheter and the urine at the given collection point. The antibiotics prescribed over the collection period are indicated at the top of each column. Immunohistochemistry staining of formalin-fixed catheter portion incubated with the indicated primary antibodies for selected catheters 132-3 (b) and 92-2 (e). Growth (log CFU/mL) of clinical E. faecalis (EF) or E. coli (Ec) isolates collected at the same collection period from Patient 132 (c) and Patient 92 (f), respectively, in monocultures (SINGLE) or mixed (MIXED) cultures in AUM. Growth of prototypical strains E. faecalis OG1RF with E. coli UTI89 are included. Data are presented as the mean values with error bars indicating the standard deviation from n = 3 biological replicates. Comparisons conducted using a two-sided unpaired t test. *P ≤ 0.05, **P < 0.01, ***P < 0.001, ****P < 0.0001, ns indicates not significant.

References

    1. Magill SS, et al. Changes in prevalence of health care-associated infections in U.S. hospitals. New Engl. J. Med. 2018;379:1732–1744. doi: 10.1056/NEJMoa1801550. - DOI - PMC - PubMed
    1. Scott, R. D. The Direct medical costs of healthcare-associated infections in U.S. hospitals and the benefits of prevention. In Division of Healthcare Quality Promotion, National Center for Preparedness, Detection, and Control of Infectious Diseases, Centers for Disease Control and Prevention (eds Polock, D. A. & Stone, P. W.) (2009). https://www.cdc.gov/hai/pdfs/hai/scott_costpaper.pdf.
    1. Yang X, et al. Disease burden and long-term trends of urinary tract infections: a worldwide report. Front. Public Health. 2022;10:888205. doi: 10.3389/fpubh.2022.888205. - DOI - PMC - PubMed
    1. Hooton TM. Uncomplicated urinary tract infection. New Engl. J. Med. 2012;366:1028–1037. doi: 10.1056/NEJMcp1104429. - DOI - PubMed
    1. Flores-Mireles AL, Walker JN, Caparon M, Hultgren SJ. Urinary tract infections: epidemiology, mechanisms of infection and treatment options. Nat. Rev. Microbiol. 2015;13:269–284. doi: 10.1038/nrmicro3432. - DOI - PMC - PubMed

Publication types