. 2024 Jan 2;15(1):117.
doi: 10.1038/s41467-023-44411-8.

The evolution of centriole degradation in mouse sperm

Affiliations

The evolution of centriole degradation in mouse sperm

Sushil Khanal et al. Nat Commun. .

Abstract

Centrioles are subcellular organelles found at the cilia base with an evolutionarily conserved structure and a shock absorber-like function. In sperm, centrioles are found at the flagellum base and are essential for embryo development in basal animals. Yet, sperm centrioles have evolved diverse forms, sometimes acting like a transmission system, as in cattle, and sometimes becoming dispensable, as in house mice. How the essential sperm centriole evolved to become dispensable in some organisms is unclear. Here, we test the hypothesis that this transition occurred through a cascade of evolutionary changes to the proteins, structure, and function of sperm centrioles and was possibly driven by sperm competition. We found that the final steps in this cascade are associated with a change in the primary structure of the centriolar inner scaffold protein FAM161A in rodents. This information provides the first insight into the molecular mechanisms and adaptive evolution underlying a major evolutionary transition within the internal structure of the mammalian sperm neck.


Conflict of interest statement

The authors declare no competing interests.

Figures
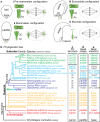
Fig. 1
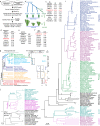
Fig. 1. Sperm proximal centriole degradation evolved after the separation of families Cricetidae and Muridae.
a The sperm centriole evolutionary cascade hypothesis. Each panel depicts the spermatozoan head and neck morphology (left), the spermatozoan centrioles (middle, in green), and the zygotic centriolar configuration (right). (i) Stage 1: the pre-mammalian centriolar configuration. Spermatozoon with a ball-shaped head, centrally inserted neck (tail attached below the head base center), and canonical proximal (PC) and distal centrioles (DC). Centriole-dependent zygote with two centrosomes emanating asters. (ii) Stage 2: the mammalian centriolar configuration. Sperm competition improved sperm behavior at this stage. Spermatozoon with a paddle-shaped head, centrally inserted neck, and canonical proximal and distal centrioles. Centriole-dependent zygote with two centrosomes emanating asters. (iii) Stage 3: the Eumuroida (subgroup of murids) centriolar configuration. The cost of increased miscarriage rates eliminated the need for zygotic centrioles at this stage. Spermatozoon with a sickle-shaped head, neck attached to the base either centrally or off-center (tail attached asymmetrically, below the head base), and canonical proximal and distal centrioles. Centriole-independent embryonic development. (iv) Stage 4: the murid (house mouse) centriolar configuration. Spermatozoan centrioles were freed from the functional constraints imposed by the centriole’s role in the embryo, allowing for innovation in sperm morphology. Spermatozoon with a sickle-shaped head, lateral head-neck attachment (tail attached to the side of the head, parallel to the base), and remnant centrioles. Centriole-independent embryonic development. be A summary of rodent evolution, depicting their phylogenetic tree (b), proximal centriolar structure (c), head shape (d), and neck attachment (e). No PC, proximal centriolar structure not observed; uk, unknown; canon presence of a structurally canonical proximal centriole; sickle, sickle-shaped head; paddle, paddle-shaped head; lateral, neck attachment on one side of the head; O-C base, off-center neck attachment to the base of the head; base, neck attachment near the center of the base of the head.
Fig. 2
Fig. 2. The primary structure of FAM161A is under selective pressure in rodents.
a Calculated extended identity ratios. Hs Homo sapiens, Mm Mus musculus, Bt Bos taurus, Oc Oryctolagus cuniculus. b Phylogenetic tree showing the evolutionary position of the four mammals used in the extended identity ratio calculations and their proximal (PC) and distal (DC) centriolar structures. c The top 10 identity ratio (IR) hits and their extended identity ratios (EIR). Extended identity ratios were calculated for proteins near the FAM161A genomic location (d), proteins influenced by sperm competition (e), and sperm distal centriolar proteins (f). Rodent phylogenetic tree (g) with FAM161A sequence identity relative to human FAM161A (h). Percent identity is also shown as average ± SD for individual clades. *P < 0.05, **P < 0.01 (unpaired, two-tailed t test; exact p-values are provided in the figure and Source Data File); ns not significant. (i) Bayesian phylogeny of FAM161A inferred using nucleotide sequences of mammalian species. (j) Bayesian phylogeny of FAM161A inferred using nucleotide sequences of Myomorpha species. The scale bars in i and j represent the number of nucleotide substitutions per site.
Fig. 3
Fig. 3. Murids express an evolutionarily novel FAM161A isoform in the testes.
a Exon organization of FAM161A isoform types 1, 2, and 3. ID of predicted FAM161A isoforms and corresponding numbers of amino acids in humans and house mice. b–f Western blot analysis of FAM161A in house mouse and rat eyes (b), U2OS and 3T3 cells (c), bovine and human testes (d), and house mouse and rat testes (e). Numbers to the right of each blot pair indicate FAM161A isoform types. f Diagrammatic representation of Mus musculus FAM161A with protein domains, positively (+) selected sites identified by CodeML M8 modeling, and negatively (−) selected sites identified by FEL. All western blot images shown are representative of at least three independent experiments.
Fig. 4
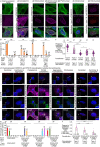
Fig. 4. Human and house mouse FAM161A isoforms have different microtubule and POC5 interactions.
a Expression analysis of human FAM161A (hFAM161A) type 2 (second panel from left), house mouse FAM161A (mFAM161A) type 2 (middle three panels), mFAM161A type 3 (second panel from right), and the combination of mFAM161A types 2 and 3 (right panel) in U2OS cells. b Quantification showing the percentage of cells exhibiting each of the various expression patterns observed during expression analysis of hFAM161A type 2, mFAM161A type 2, mFAM161A type 3, and the combination of mFAM161A types 2 and 3. C, “Cytoplasmic”; I, “Intranuclear”; I + P, “Mix intranuclear-perinuclear”; P, “Perinuclear”. c Quantification of FAM161A colocalization with tubulin. ****P < 0.0001, ***P < 0.001, **P < 0.01, *P < 0.05 (unpaired, two-tailed t test; exact p-values are provided in the Source Data File); ns not significant, n number of cells, scale bars are 8 µm. The data shown are the representative images and compiled quantification from three independent experiments. Data are presented as box and whisker plots, where upper and lower bounds show interquartile range, the line within the box shows the median, and whiskers show minimum and maximum data points. d Co-overexpression of FAM161A isoforms and POC5 in U2OS cells. The inset in the bottom left corner shows a zoomed view of the site of the centriole, and the inset in the bottom right corner shows a zoomed view of non-centriolar POC5 locations in the cell. Scale bars are 8 µm, inset scale bar is 1 µm. e Quantification showing the percentage of cells exhibiting the various expression patterns observed during expression analysis of hFAM161A type 2, mFAM161A type 2, and mFAM161A type 3. Ce, “Centriolar”; Ce+A, “Centriolar + Aggregate”; C, “Cytoplasmic”; Pc, “Partial Cytoplasmic”; A + C, “Aggregate + Cytoplasmic”; P, “Perinuclear”. f Quantification of FAM161A colocalization with POC5. Statistical analysis used was unpaired, two-tailed t test. Source data are provided in the Source Data File.
Fig. 5
Fig. 5. Cricetidae and Muridae species share an evolutionarily novel FAM161A localization in their spermatozoa.
Rod protein localization in mature spermatozoan necks of house mice (a), deer mice (b), and prairie voles (c). Tubulin is used as a marker for the centriole and axoneme. PC proximal centriole, DC distal centriole, Ax axoneme. Scale bars are 1 µm. The images shown are representative of three independent experiments.
Fig. 6
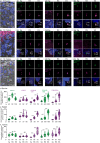
Fig. 6. Bovines, rabbits, and humans share a conserved centriole remodeling program.
a–a A single seminiferous tubule section showing various stages of spermatogenesis in bovines (ai), rabbits (bi), and humans (ci). The white dotted line indicates the basal lamina boundary. Throughout the paper: BL basal lamina, Sg spermatogonia, Sc spermatocyte, RS round spermatid; Es elongated spermatid, Lu lumen. Scale bars are 8 μm. Representative images of various rod proteins at various stages of spermatogenesis in bovines (aii–iv), rabbits (bii–iv), and humans (cii–iv). Scale bars are 2 μm. Quantification of total centriolar localization, including various proximal and distal centriolar proteins at various stages of sperm development in bovines (d), rabbits (e), and humans (f). The data was generated from three independent experiments. C1/2, centrioles 1 and 2; PC proximal centriole, DC distal centriole, Bt Bos Taurus (bovine), Oc Oryctolagus cuniculus (rabbit), Hs Homo sapiens (human), n, sample size. The two centrioles in Sg are labeled as C1 and C2 since the proximal and distal centrioles are not phenotypically distinguishable at this stage. The white arrow marks the “V”-shaped rods or filled-in “V” shape. The graphs are presented as box and whisker plots, where upper and lower bounds show interquartile range, the line within the box shows the median, and whiskers show minimum and maximum data points. ****P < 0.0001, ***P < 0.001, **P < 0.01, *P < 0.05 (unpaired, two-tailed t test; exact p-values are provided in the Source Data File); ns not significant, n number of cells. Data shown are the representative images and compiled quantification from at least three independent experiments. Source data are provided in the Source Data File.
Fig. 7
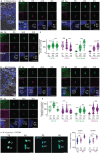
Fig. 7. Unlike the deer mouse remodeling program, the house mouse centriole degradation program begins in elongated spermatids.
a, c A single seminiferous tubule section showing various stages of spermatogenesis in deer mice (ai) and house mice (ci). The white dotted line indicates the basal lamina boundary. BL basal lamina, Sg spermatogonia, Sc spermatocyte, RS round spermatid, Es elongated spermatid, Lu lumen. Scale bars are 8 μm. Representative images of various rod proteins at various stages of spermatogenesis in deer mice (aii–iv) and house mice (cii–iv). b, d Quantification of the combined proximal and distal centriolar localization of various proteins at various stages of sperm development in deer mice (b) and house mice (d). e STORM imaging of house mouse testes with POC5 and CETN1 staining in spermatogonia/spermatocytes (Sg) and round spermatids (RS) (left panels). Measurements of centriolar length as determined using STORM imaging (right panel). Scale bars are 0.4 μm. The data were generated from three independent experiments; n number of cells in b and d, and number of centrioles in e. The graphs are presented as box and whisker plots, where upper and lower bounds show interquartile range, the line within the box shows the median, and the whiskers show minimum and maximum data points. ****P < 0.0001, ***P < 0.001, **P < 0.01, *P < 0.05 (unpaired, two-tailed t-test; exact p-values are provided in the Source Data File). Source data are provided in the Source Data File.

Similar articles

Cited by

References

    1. Azimzadeh J. Evolution of the centrosome, from the periphery to the center. Curr. Opin. Struct. Biol. 2021;66:96–103. doi: 10.1016/j.sbi.2020.10.020. - DOI - PubMed
    1. Winey M, O’Toole E. Centriole structure. Philos. Trans. R. Soc. Lond. B Biol. Sci. 2014;369:20130457. doi: 10.1098/rstb.2013.0457. - DOI - PMC - PubMed
    1. Junker AD, et al. Basal bodies bend in response to ciliary forces. Mol. Biol. Cell. 2022;33:ar146. doi: 10.1091/mbc.E22-10-0468-T. - DOI - PMC - PubMed
    1. Avidor-Reiss T, Fishman EL. It takes two (centrioles) to tango. Reproduction. 2019;157:R33–R51. doi: 10.1530/REP-18-0350. - DOI - PMC - PubMed
    1. Parker GA. Sperm competition and its evolutionary consequences in the insects. Biol. Rev. 1970;45:525–567. doi: 10.1111/j.1469-185X.1970.tb01176.x. - DOI

Publication types