. 2024 Jan 2;15(1):140.
doi: 10.1038/s41467-023-44341-5.

Mapping causal links between prefrontal cortical regions and intra-individual behavioral variability

Affiliations

Mapping causal links between prefrontal cortical regions and intra-individual behavioral variability

Farshad Alizadeh Mansouri et al. Nat Commun. .

Abstract

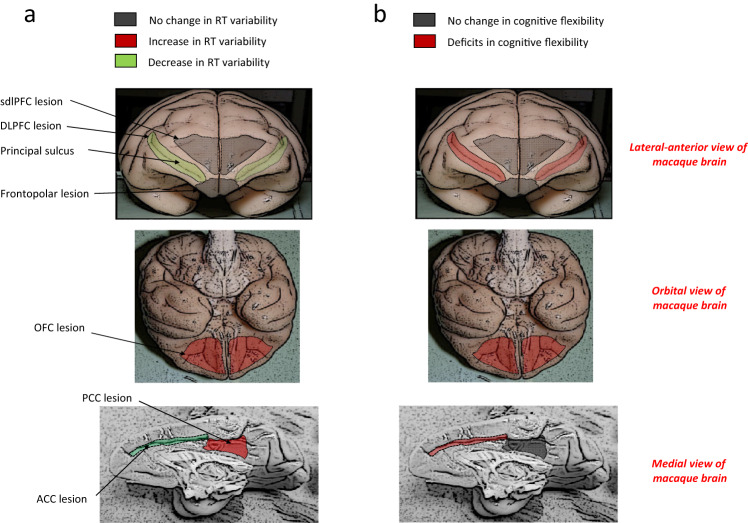
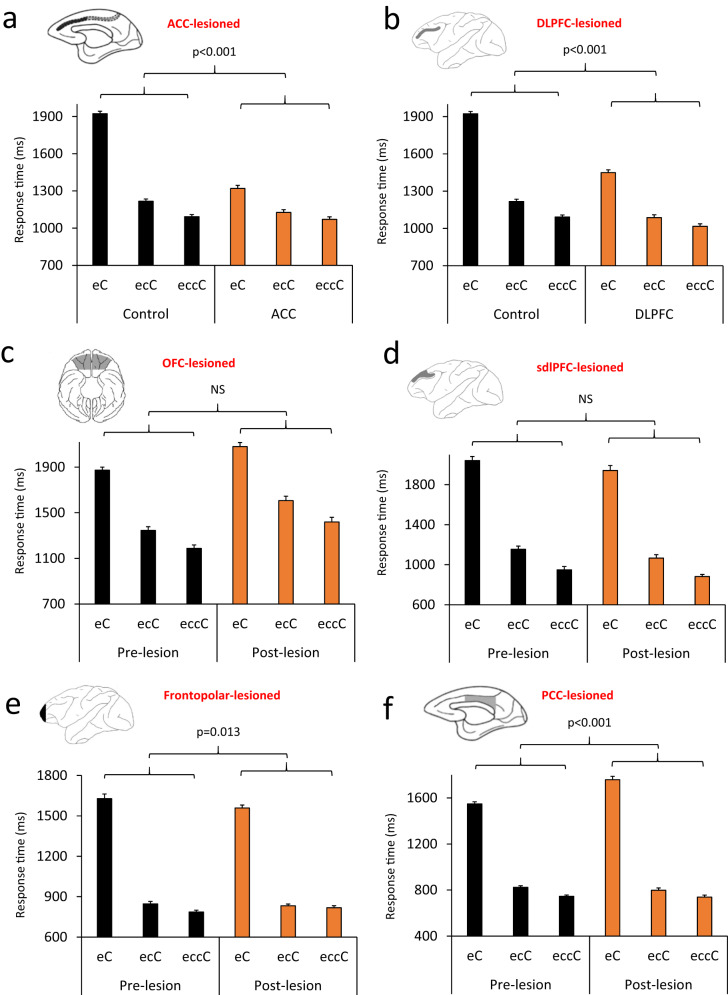
Intra-individual behavioral variability is significantly heightened by aging or neuropsychological disorders, however it is unknown which brain regions are causally linked to such variabilities. We examine response time (RT) variability in 21 macaque monkeys performing a rule-guided decision-making task. In monkeys with selective-bilateral lesions in the anterior cingulate cortex (ACC) or in the dorsolateral prefrontal cortex, cognitive flexibility is impaired, but the RT variability is significantly diminished. Bilateral lesions within the frontopolar cortex or within the mid-dorsolateral prefrontal cortex, has no significant effect on cognitive flexibility or RT variability. In monkeys with lesions in the posterior cingulate cortex, the RT variability significantly increases without any deficit in cognitive flexibility. The effect of lesions in the orbitofrontal cortex (OFC) is unique in that it leads to deficits in cognitive flexibility and a significant increase in RT variability. Our findings indicate remarkable dissociations in contribution of frontal cortical regions to behavioral variability. They suggest that the altered variability in OFC-lesioned monkeys is related to deficits in assessing and accumulating evidence to inform a rule-guided decision, whereas in ACC-lesioned monkeys it results from a non-adaptive decrease in decision threshold and consequently immature impulsive responses.


Conflict of interest statement

The authors declare no competing interests.

Figures

Fig. 1
Fig. 1. Computerized versions of the WCST and intended lesion extent.
a In the Wisconsin Card Sorting Test (WCST), each trial commenced with sample onset at the center of the screen and after monkeys touched the sample and released their hand, three test items were presented on the left, right and bottom of the sample. A correct application of the matching rule led to the arrival of a reward. If monkeys did not match based on the currently relevant rule (touched one of the non-matching items) or did not respond within the response window, an error signal was presented and no reward was delivered. b The schematic diagrams show the extent of intended lesions in different groups of monkeys. Red regions show the extent of intended lesion (all lesions were bilateral). The details of lesion extent in each group are explained in the online Methods section. The lesion extents were largely as planned as assessed by microscopic inspection of post-mortem histological sections (see Supplementary Information for figures and discussions of lesion extent in individual animals) in all groups (except for in the posterior cingulate cortex group wherein coronal magnetic resonance images were inspected). Numerals: distance in mm from the interaural plane.
Fig. 2
Fig. 2. Selective lesions in the DLPFC, ACC or OFC modulate intra-individual response time (RT) variability.
a The coefficient of response time variability (RT-COV) was significantly smaller in the ACC-lesioned monkeys, compared to Control group (F(1140) = 35.66). b The RT-COV of individual monkeys in 15 post-lesion sessions is shown for Control (red color) and ACC-lesioned monkeys (black color). The values for each monkey appear with a distinct marker shape. c The RT-COV was significantly smaller in the DLPFC-lesioned monkeys, compared to Control group (F(1140) = 4.26). d The RT-COV of individual monkeys in 15 post-lesion sessions is shown for Control (red color) and DLPFC-lesioned monkeys (black color). e The RT-COV is shown in the pre-lesion and post-lesion testing for the OFC-lesioned monkeys. RT-COV became significantly larger in the OFC-lesioned monkeys (F(1,42) = 12.56). f The RT-COV of individual monkeys in 15 pre-lesion (red color) and 15 post-lesion (black color) sessions is shown for OFC-lesioned monkeys. The cC sequence corresponds to a correct trial preceded by another correct trial. Data are presented as mean values ± SEM. The p value shows the main effect of Lesion factor in the ANOVA. All comparisons were two-sided. Dorsolateral prefrontal cortex (DLPFC), anterior cingulate cortex (ACC), orbitofrontal cortex (OFC).
Fig. 3
Fig. 3. Consequence of selective lesions in the sdlPFC, frontopolar cortex or PCC on intra-individual behavioral variability.
a For sdlPFC-lesioned monkeys, there was no significant difference in RT-COV between the pre-lesion and post-lesion testing (F(1,42) = 0.96). b The RT-COV of individual monkeys in 15 pre-lesion (red color) and 15 post-lesion (black color) sessions is shown for sdlPFC-lesioned monkeys. The values for each monkey appear with a distinct marker shape. c For frontopolar-lesioned monkeys, there was no significant difference in RT-COV between the pre-lesion and post-lesion testing (F(1,56) = 0.082). d The RT-COV of individual monkeys in 15 pre-lesion (red color) and 15 post-lesion (black color) sessions is shown for frontopolar-lesioned monkeys. e For PCC-lesioned monkeys, there was a significant difference in RT-COV between the pre-lesion and post-lesion testing, which appeared as a larger RT-COV (behavioral variability) following PCC lesion (F(1,42) = 30.31). f The RT-COV of individual monkeys in 15 pre-lesion (red color) and 15 post-lesion (black color) sessions is shown for PCC-lesioned monkeys. The p value and NS (Non-significant) indicate the main effect of Lesion factor in the ANOVA. Data are presented as mean values ± SEM. All comparisons were two-sided. Superior dorsal-lateral prefrontal cortex (sdlPFC), posterior cingulate cortex (PCC).
Fig. 4
Fig. 4. Consequence of selective brain lesions on behavioral variability in error trials.
af The coefficient of response time variability (RT-COV) is shown in correct (cC) and error (cE) trials. a In ACC-lesioned monkeys, the RT-COV was decreased in both cC and cE trials, however the difference between cC and cE trials was significantly attenuated, which was mainly due to changes in cE trials (F(1140) = 4.25). b In DLPFC-lesioned monkeys, the RT-COV was decreased in both cC and cE trials, however the difference between cC and cE trials was not significantly affected (F(1140) = 1.42). c In OFC-lesioned monkeys, the RT-COV was significantly increased and the difference between cC and cE trials was significantly attenuated, however this was mainly due to changes in cC trials (F(1,42) = 7.80). d In sdlPFC-lesioned monkeys, there was no significant change in overall RT-COV or its difference between cC and cE trials (F(1,42) = 0.07). e In Frontopolar-lesioned monkeys, the RT-COV was significantly larger in error (cE) trials in both before and after the lesion, however the difference between cC and cE trials was not significantly affected (F(1,56) = 3.83). f In PCC-lesioned monkeys, the RT-COV was significantly larger in error trials in both before and after the lesion, however the difference between cC and cE trials was not affected (F(1,42) = 1.71). The p value shows the interaction between the Lesion and Response-type (cC/cE) factors in the ANOVA. Dorsolateral prefrontal cortex (DLPFC), anterior cingulate cortex (ACC), orbitofrontal cortex (OFC), superior dorsal-lateral prefrontal cortex (sdlPFC), posterior cingulate cortex (PCC). NS Non-significant. Data are presented as mean values ± SEM. All comparisons were two-sided.
Fig. 5
Fig. 5. Dissociations in the involvement of six cortical regions in intra-individual RT variability.
a The effects of the bilateral lesion in different brain areas on the RT variability. Red and green colors indicate significant effects, which appeared as increased and decreased RT-COV, respectively. Gray color indicates no significant effect. All lesions were bilateral; however, the lesion extent is shown only on one hemisphere for ACC and PCC. b The effects of the bilateral lesion in different areas on the cognitive flexibility. Red and gray colors indicate significant impairment and no deficits, respectively. Dorsolateral prefrontal cortex (DLPFC), anterior cingulate cortex (ACC), orbitofrontal cortex (OFC), superior dorsal-lateral prefrontal cortex (sdlPFC), posterior cingulate cortex (PCC).
Fig. 6
Fig. 6. Response time (RT) at different levels of evidence for rule-guided actions.
a Monkeys’ RT is shown in eC (a correct trial preceded by an error trial; e = error, C = correct), ecC and eccC trial sequences. RT was calculated in the current correct trial (upper case C) depending on the history (lower case letters). In Control monkeys, RT was the longest in eC trials, when the lowest level of evidence exists to guide rule-based action selection, however it was shorter in ecC and eccC trials. Compared to Control monkeys, ACC-lesioned monkeys had a shorter RT in all trial types (F(1140) = 105.69), however the difference in RT between Control and ACC-lesioned monkeys was the largest in eC trials (the lowest level of evidence). b A similar pattern of evidence-dependent modulation of RT was seen in the DLPFC-lesioned monkeys (F(1140) = 105.39). c Evidence-dependent modulation of RT was seen in OFC-lesioned monkeys, however their RT was longer at all evidence levels in the post-lesion testing (F(1,42) = 33.32). d Evidence-dependent modulation of RT was seen in sdlPFC-lesioned monkeys, however their RT was shorter at all evidence levels in the post-lesion testing (F(1,42) = 4.19). Evidence-dependent modulation of RT was seen in frontopolar-lesioned (F(1,56) = 0.86) (e) and PCC-lesioned monkeys (F(1,42) = 7.77) (f). The p value shows the interaction between the Lesion and Evidence (eC/ecC/eccC) factors in the ANOVA. Data are presented as mean values ± SEM. All comparisons were two-sided. Dorsolateral prefrontal cortex (DLPFC), anterior cingulate cortex (ACC), orbitofrontal cortex (OFC), superior dorsal-lateral prefrontal cortex (sdlPFC), posterior cingulate cortex (PCC).
Fig. 7
Fig. 7. Drifting model predicting the consequence of lesions in ACC, DLPFC and OFC on RT variability.
The two cases of drifting model performance in which the rate of evidence accumulation is the highest (a) and the lowest (b). The black and red oblique lines represent the drift rate for Control and ACC-lesioned monkeys, respectively. The explanation is given for ACC-lesioned monkeys, but can also be considered for the DLPFC-lesioned monkeys. The abscissae and ordinate represent the time and the amount of accumulated evidence for a particular response, respectively. The model assumes that the evidence for each response is accumulated constantly toward the decision threshold and a response is made when the accumulated evidence reaches the threshold. We assume that the decision threshold is significantly lower in the ACC-lesioned monkeys (D-ACC: red dotted line) as compared with that in the control monkeys (D-control: blue dotted line). The distance between the two same-color vertical lines indicates the magnitude of RT difference (bidirectional horizontal arrows) within a session. The difference depicted for the ACC-lesioned group (the light red region) is smaller than the difference for the Control group (the light blue region). This scheme is consistent with the results presented in Figs. 2a and 6a. c The black and red oblique lines represent the drift rate before and after OFC lesion, respectively when the rate of evidence accumulation is the highest (c) and the lowest (d). Decision threshold in OFC-lesioned monkeys (D-OFC) is shown with blue dotted line. We assume that the evidence accumulation is significantly impaired after OFC lesion, which would manifest as slower drift rates (red lines) at different levels of available evidence, compared to the pre-lesion state (black lines). The RT difference after OFC lesion (the light red region) is larger than the difference before OFC lesion (the light blue region). This scheme is consistent with the results presented in Figs. 2e, and 6c. Refer to Supplemental material: ‘Computational background of Fig. 7’ for the computational background. Dorsolateral prefrontal cortex (DLPFC), anterior cingulate cortex (ACC), orbitofrontal cortex (OFC).

Similar articles

Cited by

References

    1. De Felice S, Holland CA. Intra-individual variability across fluid cognition can reveal qualitatively different cognitive styles of the aging brain. Front. Psychol. 2018;9:1973. doi: 10.3389/fpsyg.2018.01973. - DOI - PMC - PubMed
    1. Dixon RA, et al. Neurocognitive markers of cognitive impairment: exploring the roles of speed and inconsistency. Neuropsychology. 2007;21:381–399. doi: 10.1037/0894-4105.21.3.381. - DOI - PubMed
    1. MacDonald SW, Nyberg L, Backman L. Intra-individual variability in behavior: links to brain structure, neurotransmission and neuronal activity. Trends Neurosci. 2006;29:474–480. doi: 10.1016/j.tins.2006.06.011. - DOI - PubMed
    1. Stuss DT, Murphy KJ, Binns MA, Alexander MP. Staying on the job: the frontal lobes control individual performance variability. Brain. 2003;126:2363–2380. doi: 10.1093/brain/awg237. - DOI - PubMed
    1. Weissman DH, Roberts KC, Visscher KM, Woldorff MG. The neural bases of momentary lapses in attention. Nat. Neurosci. 2006;9:971–978. doi: 10.1038/nn1727. - DOI - PubMed

Publication types