. 2024 Jan 2;15(1):168.
doi: 10.1038/s41467-023-44057-6.

Mic19 depletion impairs endoplasmic reticulum-mitochondrial contacts and mitochondrial lipid metabolism and triggers liver disease

Affiliations

Mic19 depletion impairs endoplasmic reticulum-mitochondrial contacts and mitochondrial lipid metabolism and triggers liver disease

Jun Dong et al. Nat Commun. .

Abstract

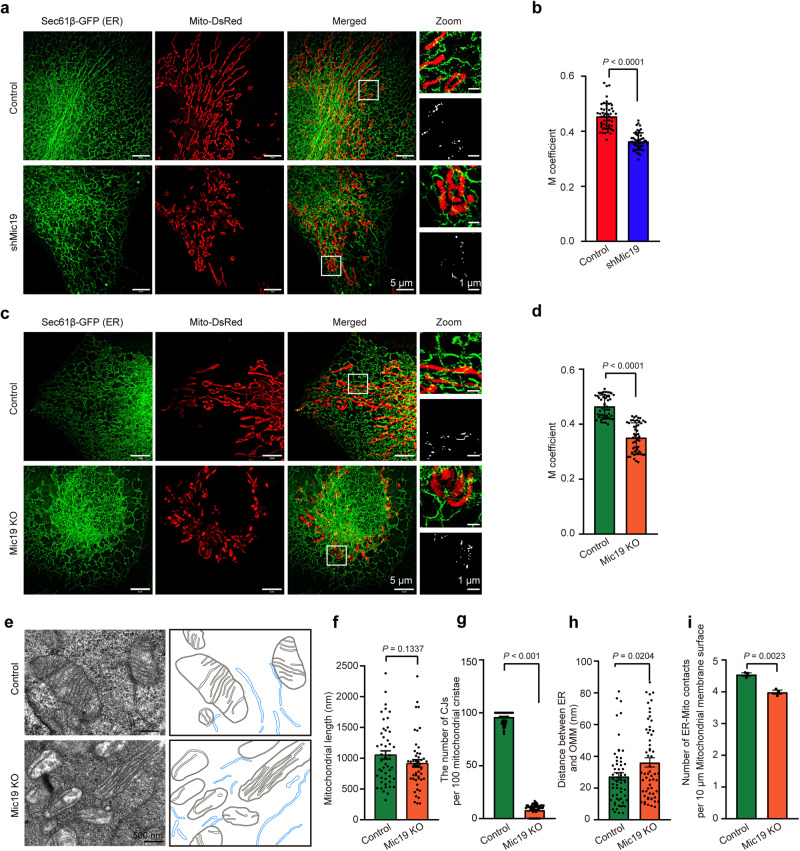
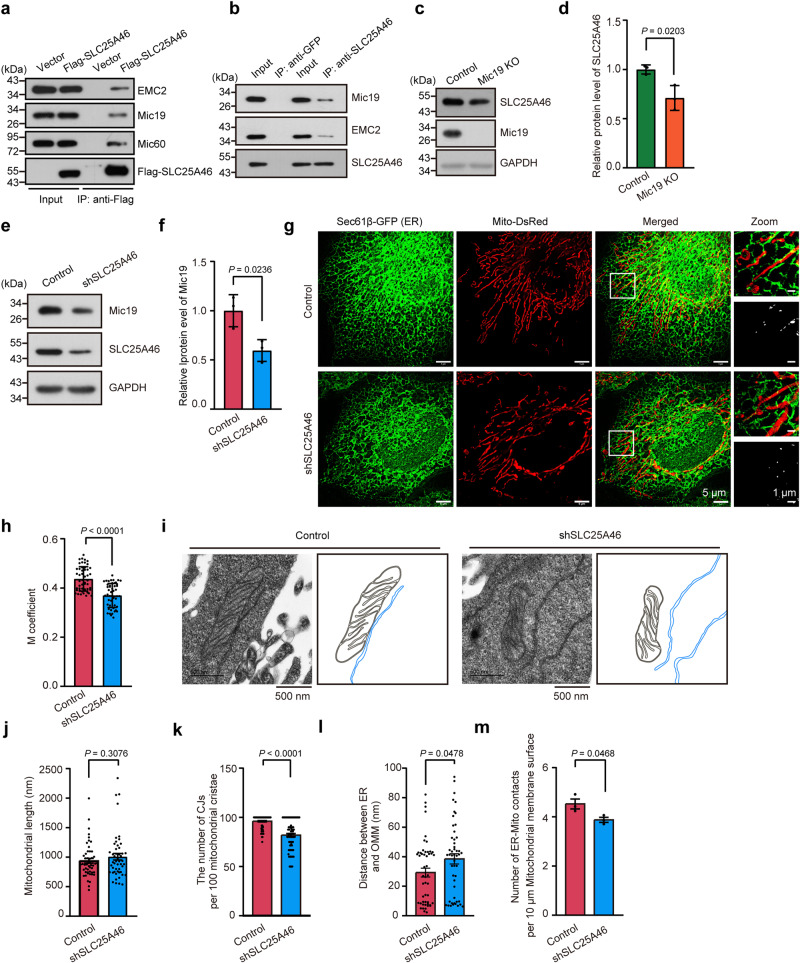
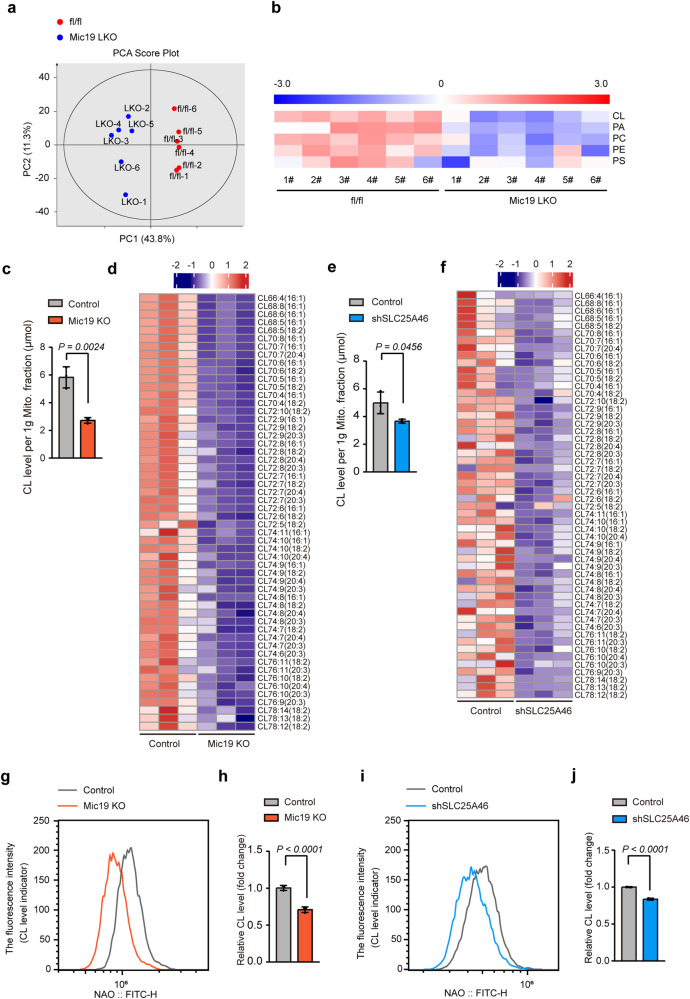
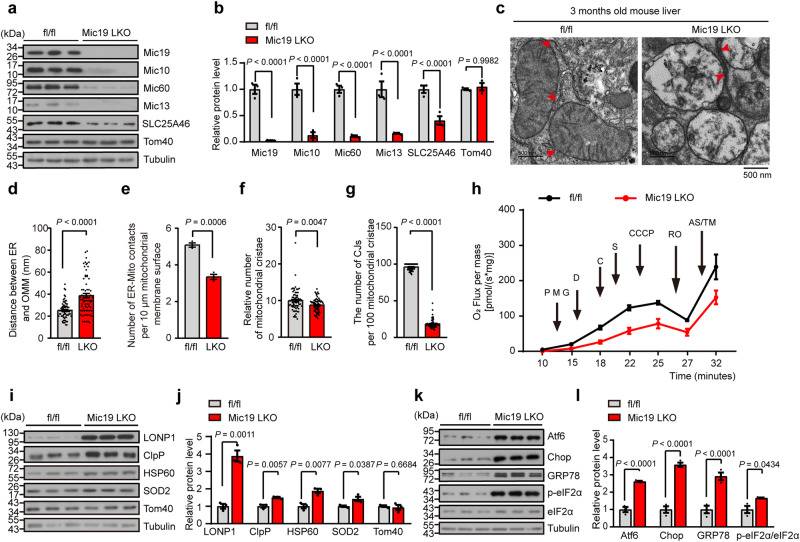
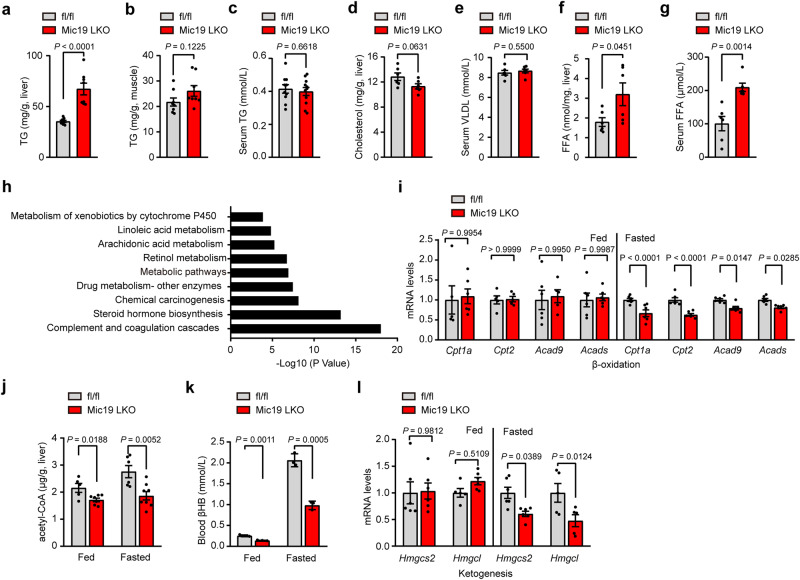
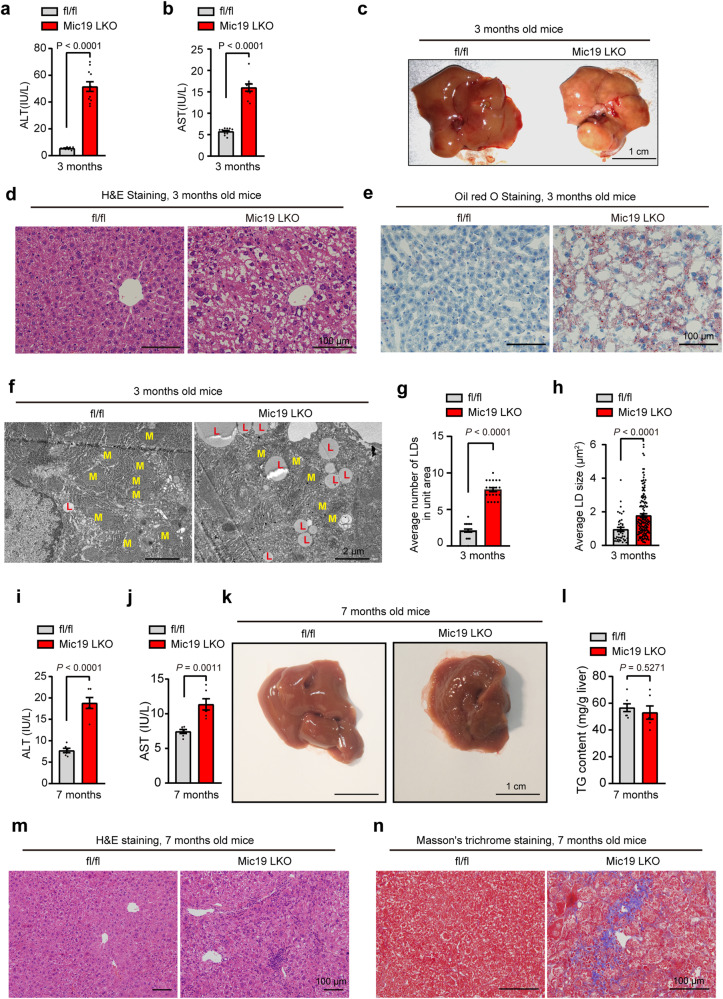
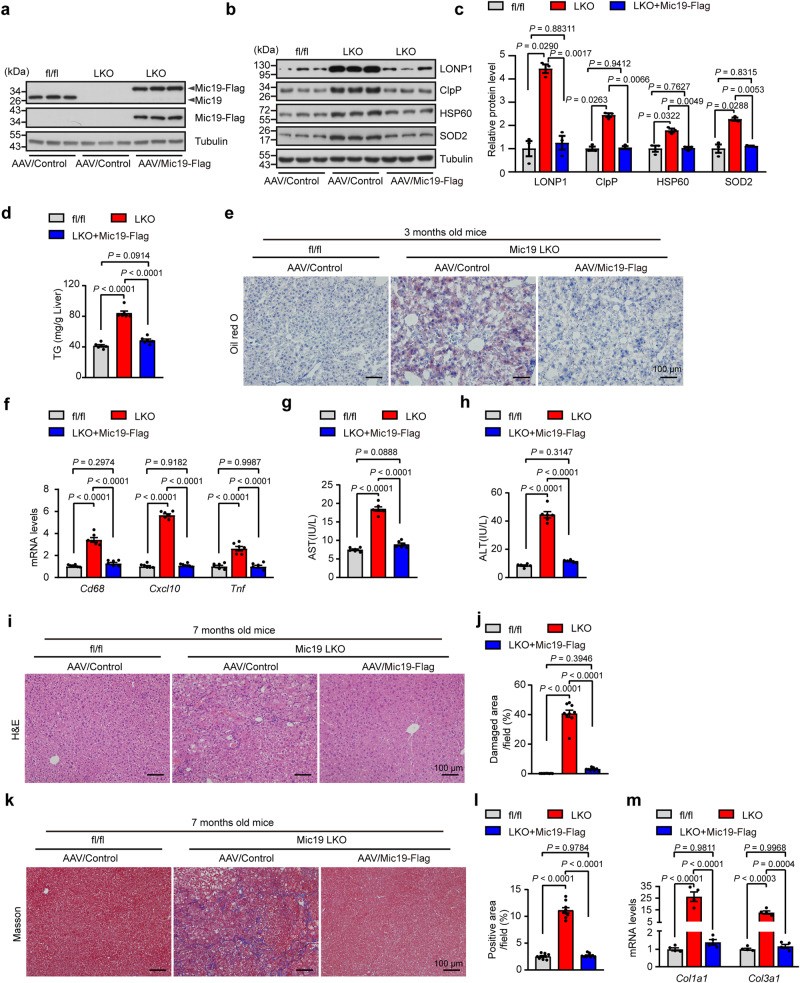
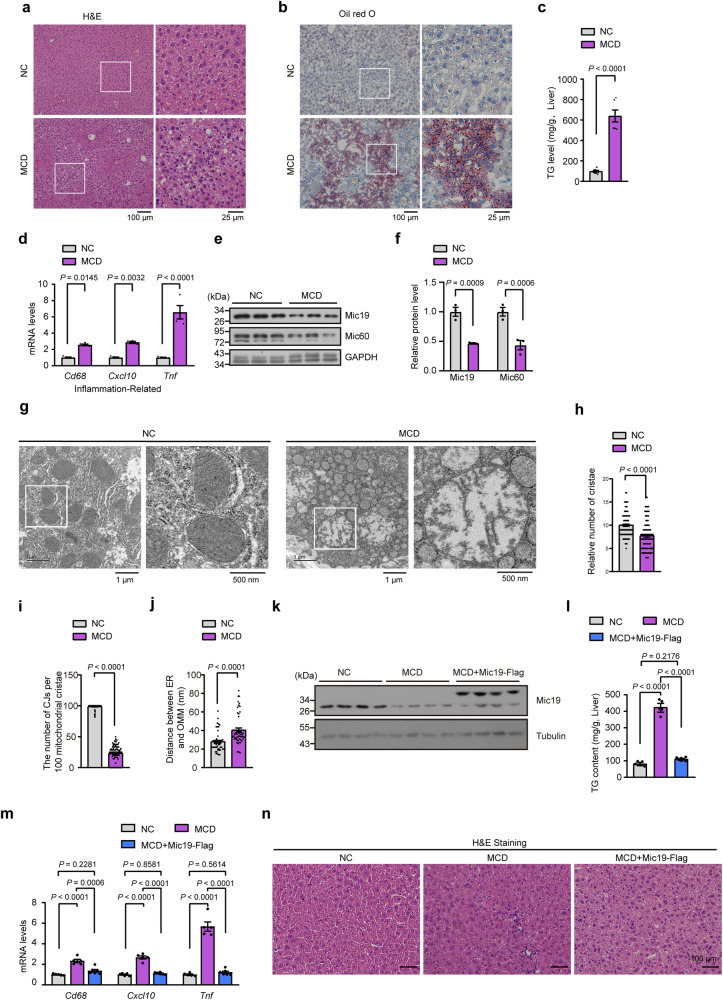
Endoplasmic reticulum (ER)-mitochondria contacts are critical for the regulation of lipid transport, synthesis, and metabolism. However, the molecular mechanism and physiological function of endoplasmic reticulum-mitochondrial contacts remain unclear. Here, we show that Mic19, a key subunit of MICOS (mitochondrial contact site and cristae organizing system) complex, regulates ER-mitochondria contacts by the EMC2-SLC25A46-Mic19 axis. Mic19 liver specific knockout (LKO) leads to the reduction of ER-mitochondrial contacts, mitochondrial lipid metabolism disorder, disorganization of mitochondrial cristae and mitochondrial unfolded protein stress response in mouse hepatocytes, impairing liver mitochondrial fatty acid β-oxidation and lipid metabolism, which may spontaneously trigger nonalcoholic steatohepatitis (NASH) and liver fibrosis in mice. Whereas, the re-expression of Mic19 in Mic19 LKO hepatocytes blocks the development of liver disease in mice. In addition, Mic19 overexpression suppresses MCD-induced fatty liver disease. Thus, our findings uncover the EMC2-SLC25A46-Mic19 axis as a pathway regulating ER-mitochondria contacts, and reveal that impairment of ER-mitochondria contacts may be a mechanism associated with the development of NASH and liver fibrosis.


Conflict of interest statement

The authors declare no conflict of interest.

Figures

Fig. 1
Fig. 1. Mic19 depletion decreases ER-mitochondria contacts.
a, b HeLa cells stably expressing mito-DsRed (a mitochondrial marker, red) and Sec61β-GFP (an ER marker, green) were infected with control (scrambled shRNA) or shMic19 lentiviral particles. 5 days later, these cells were imaged by HIS-SIM (High Sensitivity Structured Illumination Microscope) to analyze the co-localization of mitochondria and ER a. Co-localization of ER and mitochondria in “b” was further quantified by ImageJ software (b). n = 50 mitochondria examined over 3 independent experiments. c, d Control and Mic19 KO HeLa cells stably expressing Mito-DsRed and Sec61β-GFP were analyzed as described in “a” and “b”. n = 50 mitochondria examined over 3 independent experiments. ei ER-mitochondria contacts in control or Mic19 KO HeLa cells were analyzed by transmission electron microscopy (TEM). Insets are mitochondrial membrane (dark gray) and ER membrane (blue) annotated with different colors (e). The mitochondrial length (f, n = 50 mitochondria), the number of cristae junctions (CJs) per 100 mitochondrial cristae (g, n = 100 mitochondria cristae), the distance between ER and OMM (h, n = 60 mitochondria) and the number of ER-Mito contacts per 10 μm mitochondrial membrane surface i were further analyzed by ImageJ software (n = 3 independent experiments). Data in b, d are presented as mean ± SD. Data in fi are presented as mean ± SEM. Statistical significance was assessed by two-tailed Student’s t-test. P values are indicated in the figure. Source data are provided as a Source Data file.
Fig. 2
Fig. 2. Mic19 is involved in the interaction between mitochondria and ER by EMC2-SLC25A46-Mic19 axis.
a 293 T cells were transiently transfected with empty vector (control) or vector coding for Flag-SLC25A46. After 36 h transfection, cell lysates were used for co-immunoprecipitation with anti-Flag M2 affinity gel at 4 °C overnight. Immunoblot analysis with antibodies against Flag, SLC25A46, Mic19, Mic60, or EMC2 (n = 3 independent experiments). b Liver lysates were used for co-immunoprecipitation with anti-GFP or SLC25A46 at 4 °C overnight, followed by immunoblot analysis with antibodies against Mic19, SLC25A46 or EMC2 (n = 3 independent experiments). cf Control and Mic19 KO (c) or control and shSLC25A46 (d) HeLa cell lysates were analyzed by Western blotting with indicated antibodies. Representative immunoblots were from n = 3 independent experiments. Relative SLC25A46 (d) or Mic19 (f) protein levels were further evaluated by densitometry analysis using ImageJ software. g, h HeLa cells stably expressing Mito-DsRed (a mitochondrial marker, red) and Sec61β-GFP (an ER marker, green) were infected with control (scrambled shRNA) or shSLC25A46 lentiviral particles. 5 days later, cells were imaged by HIS-SIM to analyze the co-localization between mitochondria and ER (g). Co-localization (Manders coefficient) of ER and mitochondria was further quantified by ImageJ software (h). n = 50 mitochondria examined over 3 independent experiments. im ER-mitochondria contacts in control or shSLC25A46 HeLa cells are analyzed by transmission electron microscopy (TEM) (i). Insets are mitochondrial membrane (dark gray) and ER membrane (blue). The mitochondrial length (j, n = 50), the number of cristae junctions (CJs) per 100 mitochondrial cristae (30 mitochondria were analyzed) (k, n = 92 mitochondrial cristae), the distance between ER and OMM (l, n = 50) and the number of ER-Mito contacts per 10 μm mitochondrial membrane surface (m, n = 3) were further analyzed by ImageJ software (n = 3 independent experiments). Data in d, f, and h are presented as mean ± SD. Data in jm are presented as mean ± SEM, statistical significance was assessed by two-tailed Student’s t-test. P values are indicated in the figure. Source data are provided as a Source Data file.
Fig. 3
Fig. 3. Abnormal crosstalk between mitochondria and ER leads to decreased cardiolipin in mitochondria.
a, b Phospholipids analysis of hepatic mitochondrial fractions using lipidomics from livers of control (Mic19flox/flox) and Mic19 LKO (liver-specific Mic19 knockout) mice at 3 months old (n = 6 mice per group). The principal components analysis (PCA) was shown (a). Z score values of phospholipids from different mice were analyzed and significance were exhibited by a heat map (b). When the levels of metabolites were lower than the average level of the whole samples, the Z-score in this sample was shown as negative. In order to show the relative abundance of phospholipids, the heatmap was shown as blue (negative Z-score) and red (positive Z-score) color. cf Cardiolipin (CL) analysis of mitochondrial fractions using lipidomics from control, Mic19 KO and shSLC25A46 cells. The total cardiolipin content was shown (c, e). Z score values of cardiolipin from control, Mic19 KO, or shSLC25A46 cells were analyzed and significance were exhibited by a heat map (d, f). When the levels of CL were lower than average level of the whole samples, the Z-score in this sample was shown as negative. In order to show the relative abundance of CL, the heatmap was shown as blue (negative Z-score) and red (positive Z-score) color. Results were representative of 3 independent experiments. Data are presented as mean ± SD, two-tailed Student’s t-test. Adjustments were made for multiple comparisons. g, h Control and Mic19 KO HeLa cells were stained with NAO, followed with flow cytometric analysis to measure the level of Cardiolipin (CL) (g). 3 independent experiments were performed. Data with error bars are shown as mean ± SD (h). Statistical significance was assessed by two-tailed Student’s t-test. i, j HeLa cells were infected with control (scrambled shRNA) or shSLC25A46 lentiviral particles. 5 days later, cells were stained with NAO, and CL level was measured by flow cytometric analysis (i). 3 independent experiments were performed. Data are presented as mean ± SD, statistical significance was assessed by two-tailed Student’s t-test. P values are indicated in the figure. Source data are provided as a Source Data file.
Fig. 4
Fig. 4. Mic19 LKO leads to UPRmt and ER stress in mice.
a, b Western blotting analysis of livers extracts isolated from 3-month-old Mic19flox/flox and Mic19 LKO mice using the indicated antibodies (a). Relative protein levels (the indicated protein level/Tubulin level) were further evaluated by densitometry analysis using ImageJ software (b). n = 3 mice examined over 3 independent experiments. Data are presented as mean ± SEM, statistical significance was assessed by two-way ANOVA. cg Hepatic mitochondria of controls and Mic19 LKO mice aged at 3 months were analyzed by transmission electron microscopic (TEM), and the representative images were displayed (c). The distance between ER and outer mitochondrial membrane (OMM) (d, n = 70), the number of ER-Mito contacts per 10 μm Mitochondrial membrane surface (e, n = 3), the number of mitochondrial cristae (f, n = 70), and the number of mitochondrial cristae junctions (CJs) per 100 mitochondrial cristae (g, n = 70) were quantified and analyzed, respectively. Data are shown as mean ± SEM; statistical analysis was performed by two-tailed Student’s t-test. h Fresh Mic19flox/flox and Mic19 LKO mice liver tissues (4 mg) were homogenized in MiR05 buffer. The oxygen consumption was measured with Oroboros O2k system with the sequential addition of substrates, uncoupled, and inhibitors. n = 3 mice examined over 3 independent experiments. The data are presented as mean ± SEM. Substrates are as follows: CI (PMG, pyruvate + malate + glutamate), D (i.e., ADP), CII (S, succinate), and CIV (AS/TM, ascorbate + TMPD). The uncoupler is CCCP (U). Inhibitors are as follows: CI (RO, rotenone). il Livers extracts isolated from 3-month-old Mic19flox/flox and Mic19 LKO mice were analyzed by Western blotting analysis using the indicated antibodies (i, k). Relative protein levels (the indicated protein level/Tubulin level) were further evaluated by densitometry analysis using ImageJ software (j, l). n = 3 mice examined over 3 independent experiments. Data are presented as mean ± SEM, statistical significance was assessed by two-way ANOVA. P values are indicated in the figure. Source data are provided as a Source Data file.
Fig. 5
Fig. 5. Mic19 LKO affects fatty acid metabolism in mice.
ac TG levels in liver (a), skeletal muscle (b), serum (c) of Mic19flox/flox (n = 8 mice) or Mic19 LKO mice (n = 11 mice) aged at 3 months were detected. Data are expressed as mean ± SEM obtained from 3 independent experiments. Two-tailed Student’s t-test was conducted for statistical analysis. dg Cholesterol level in livers (d), very low-density lipoprotein (VLDL) level in serums (e), free fatty acid (FFA) level in serum (g) and liver (f) of Mic19flox/flox (control) or Mic19 LKO mice aged at 3 months were detected. (n = 6 mice per group). Data are expressed as mean ± SEM obtained from at least three independent experiments. Statistical significance was further assessed by two-tailed Student’s t-test. h Global gene expression by RNA-seq of Mic19flox/flox (control) or Mic19 LKO mice at 3 months old (n = 3 mice per group). Gene ontology (GO) and KEGG pathway enrichment analysis of the downregulated genes compared to control mice obtained from RNA-seq results were performed. Statistical significance was evaluated by Fisher’s exact test. Adjustments were made for multiple comparisons. i, l Relative mRNA level of fatty acid β-oxidation related genes (Cpt1a, Cpt2, Acad9, Acads) (i) and genes (Hmgcs2, Hmgcl) involved in ketogenesis (l) in livers isolated from fed and 24-h-fasted Mic19flox/flox (control) or Mic19 LKO mice (n = 6 mice per group) were measured by quantitative RT-PCR analysis. The mRNA levels of target genes were normalized to that of GAPDH. Data are presented as mean ± SEM; statistical analysis was assessed using two-way ANOVA. j, k Acetyl-CoA level in livers (j, n = 5 in control mice or n = 8 in Mic19 LKO mice) and blood β-hydroxybutyric acid (βHB) levels (k, n = 3 mice) from fed and 24-h-fasted Mic19flox/flox (control) or Mic19 LKO mice aged at 3 months were detected. Data are shown as mean ± SEM. Statistical significance was evaluated by two-way ANOVA. P values are indicated in the figure. Source data are provided as a Source Data file.
Fig. 6
Fig. 6. Mic19 LKO causes NAFLD in mice.
a, b Serum alanine aminotransferase (ALT) (a) and aspartate aminotransferase (AST) (b) activities of Mic19flox/flox (control, n = 9) or Mic19 LKO mice (n = 11 in Mic19 LKO mice) at 3 months old were analyzed. Data are shown as the mean ± SEM, statistical significance was performed by two-tailed Student’s t-test. c Representative images of livers from littermate 3-month-old male Mic19flox/flox (control) and Mic19 LKO mice. d, e Liver sections from Mic19flox/flox (control) or Mic19 LKO mice aged 3 months with a normal diet were analyzed by H&E staining (d) or Oil red O staining (e). Representative images were displayed. All data are representative of 3 independent experiments. fh Mitochondrial ultrastructure in liver sections from Mic19flox/flox (control) or Mic19 LKO mice were analyzed by TEM analysis (f, n = 6 mice). The yellow “M” indicates mitochondria. The red “L”indicates lipid. The number (g, n = 20) and size (h, n = 42 in control, n = 154 in Mic19 LKO mice) of lipid droplets (LD) were calculated and analyzed by ImageJ software. Data are presented as mean ± SEM; statistical analysis was determined using two-tailed Student’s t-test. i, j Serum ALT (i) and AST (j) activities of Mic19flox/flox (control) or Mic19 LKO mice (n = 6 mice per group) at 7 months old were detected. Data are shown as the mean ± SEM, statistical significance was evaluated by two-tailed Student’s t-test. k Representative images of livers from littermate 7-month-old male Mic19flox/flox (control) and Mic19 LKO mice. l Hepatic triglyceride (TG) levels from Mic19flox/flox (control) or Mic19 LKO mice (n = 6 mice) aged 7 months were measured. Data are expressed as mean ± SEM and two-tailed Student’s t-test was conducted for statistical analysis. m, n Liver tissues from Mic19flox/flox (control) or Mic19 LKO mice aged 7 months were fixed with formaldehyde, and the liver sections were used for H&E (m) and Masson’s trichrome staining (n). All data are representative of 3 independent experiments. P values are indicated in the figure. Source data are provided as a Source Data file.
Fig. 7
Fig. 7. Mic19 re-expression ameliorates liver injury in Mic19 LKO mice.
ac The male 8-week-old Mic19 LKO mice were injected with 1×10¹¹ adeno-associated virus expressing control or Mic19-Flag via tail vein. At 3 months old, the mice were euthanized. Liver lysates were analyzed by Western blotting analysis with indicated antibodies (a, b). Relative protein levels to Tubulin) were evaluated by using ImageJ software (c). n = 3 mice. Data are presented as mean ± SEM, statistical significance was assessed by two-way ANOVA. d, e Hepatic TG levels (d) and Oil red O staining (e) were detected from Mic19flox/flox (control), Mic19 LKO, or Mic19 re-expression Mic19 LKO mice (n = 6 mice per group). Data are shown as mean ± SEM, statistical significance was assessed by one-way ANOVA. All data are representative of 3 independent experiments. fh Relative liver mRNA levels of inflammatory cytokines, serum ALT (g), and serum AST (h) from 3-month-old Mic19flox/flox (control), Mic19 LKO, or Mic19 re-expression Mic19 LKO mice (n = 6 mice) to GAPDH were determined. Data are presented as mean ± SEM; statistical analysis was assessed using two-way ANOVA. il The male 8-week-old Mic19 LKO mice were injected with 1 × 1011 adeno-associated virus expressing control or Mic19-Flag via tail vein. At 7 months old, the mice were euthanized. Liver damaged areas in H&E staining images (i, j) and Masson’s trichrome staining images (k, l) were analyzed and quantified by ImageJ software. n = 9 fields examined over 3 independent experiments. Results shown were representative of 3 independent experiments. Data are shown as mean ± SEM, statistical significance was assessed by one-way ANOVA. m Quantitative RT-PCR analysis of collagen related genes (Col1a1, Col3a1) in liver tissues from 7-month-old Mic19flox/flox (control), Mic19 LKO, or Mic19 re-expression Mic19 LKO mice (n = 4 mice per group). Data are presented as the mean ± SEM, statistical significance was evaluated by two-way ANOVA. P values are indicated in the figure. Source data are provided as a Source Data file.
Fig. 8
Fig. 8. Mouse models with MCD-induced fatty liver disease show low hepatic levels of Mic19.
a, b The male2-month-old C57BL/6 mice were fed with normal (control) or a methionine and choline-deficient (MCD) diet for 5 weeks. The H&E (a) and Oil red O staining (b) were shown. Results were representative of 3 independent experiments. c Hepatic TG levels were detected from normal (control, n = 6 mice) or MCD mice (n = 7 mice). Data are shown as mean ± SEM, statistical significance was assessed by two-tailed Student’s t-test. df Relative mRNA level of inflammatory genes (d, n = 4 mice per group) and the protein level of Mic19, Mic60 (f, n = 3 mice per group) in normal (control) and MCD mice to GAPDH were measured by quantitative RT-PCR analysis or Western blotting analysis. Data are presented as mean ± SEM. Statistical significance was further calculated by two-way ANOVA. gj Mitochondrial ultrastructure images in the liver of normal (control) or MCD mice were displayed by TEM (g). The number of mitochondrial cristae (h, n = 90 mitochondria), the number of mitochondrial cristae junctions (CJs) per 100 mitochondrial cristae (i, n = 90 mitochondrial cristae), and the distance between ER and OMM (j, n = 51 mitochondria) were analyzed by ImageJ software. Data are presented as mean ± SEM, and P value was measured using two-tailed Student’s t-test. k The 8-week-old C57BL/6 male mice were injected with a control or with adeno-associated viruses encoding Mic19-Flag and then were fed with MCD for 5 weeks. The liver lysates were analyzed by Western blotting with antibodies against Mic19, Tubulin (n = 4 mice per group). ln Hepatic TG levels (l), relative mRNA level of inflammatory genes to GAPDH (m), and H&E staining (n) were detected from normal (NC), MCD, or Mic19 overexpression mice (n = 6 mice per group). Data are shown as mean ± SEM, statistical significance was assessed by one-way ANOVA or two-way ANOVA. P values are indicated in the figure. Source data are provided as a Source Data file.

References

    1. Mannella CA. Structure and dynamics of the mitochondrial inner membrane cristae. Biochim. Biophys. Acta. 2006;1763:542–548. doi: 10.1016/j.bbamcr.2006.04.006. - DOI - PubMed
    1. Cogliati S, et al. Mitochondrial cristae shape determines respiratory chain supercomplexes assembly and respiratory efficiency. Cell. 2013;155:160–171. doi: 10.1016/j.cell.2013.08.032. - DOI - PMC - PubMed
    1. Darshi M, et al. ChChd3, an inner mitochondrial membrane protein, is essential for maintaining crista integrity and mitochondrial function. J. Biol. Chem. 2011;286:2918–2932. doi: 10.1074/jbc.M110.171975. - DOI - PMC - PubMed
    1. Frey TG, Mannella CA. The internal structure of mitochondria. Trends Biochem. Sci. 2000;25:319–324. doi: 10.1016/S0968-0004(00)01609-1. - DOI - PubMed
    1. Lemmer IL, Willemsen N, Hilal N, Bartelt A. A guide to understanding endoplasmic reticulum stress in metabolic disorders. Mol. Metab. 2021;47:101169. doi: 10.1016/j.molmet.2021.101169. - DOI - PMC - PubMed

Publication types