. 2024 Jan 2;15(1):51.
doi: 10.1038/s41467-023-44360-2.

Multi-omic and functional analysis for classification and treatment of sarcomas with FUS-TFCP2 or EWSR1-TFCP2 fusions

Affiliations

Multi-omic and functional analysis for classification and treatment of sarcomas with FUS-TFCP2 or EWSR1-TFCP2 fusions

Julia Schöpf et al. Nat Commun. .

Abstract

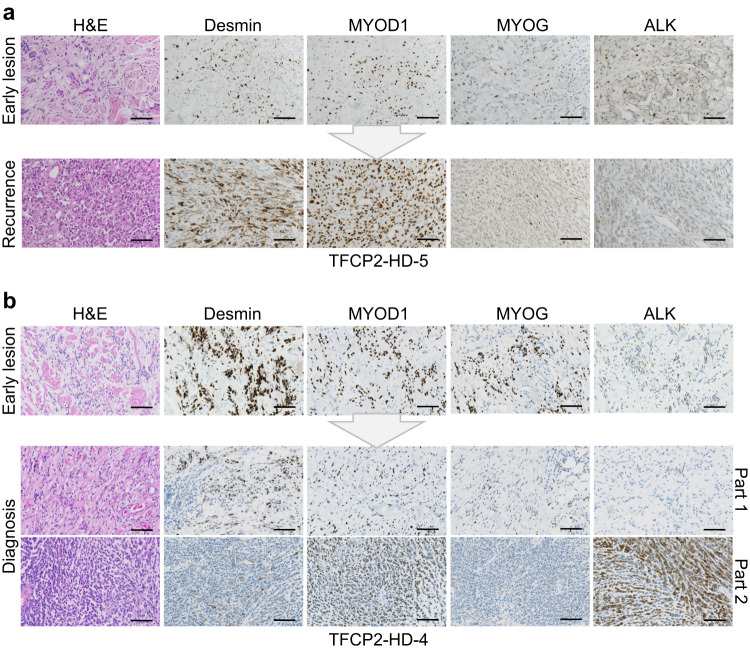
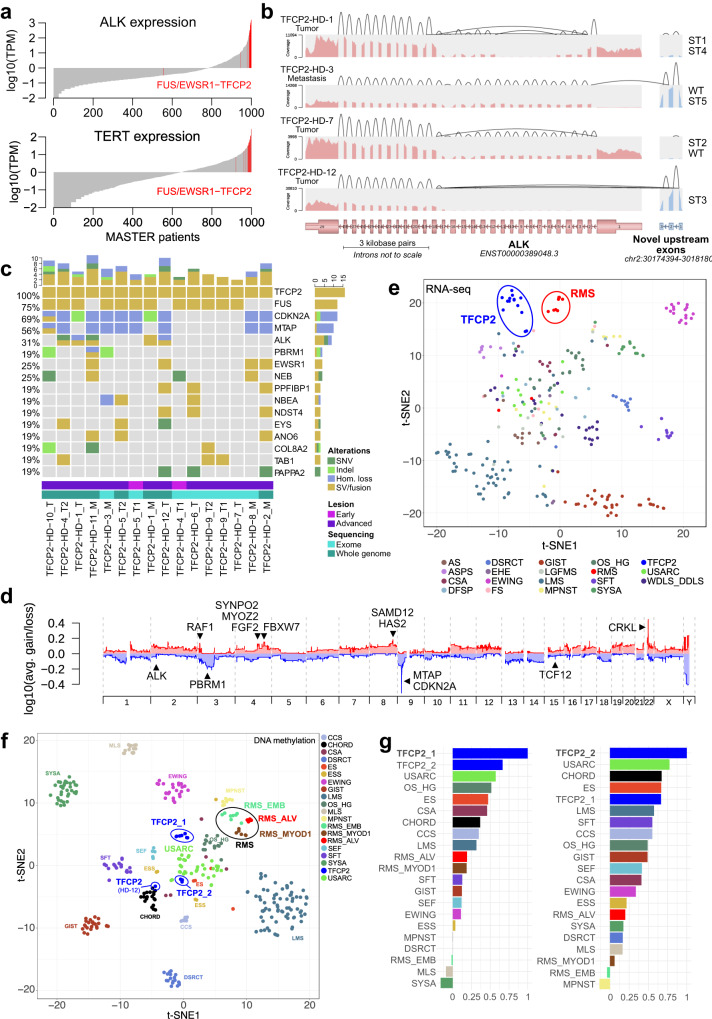
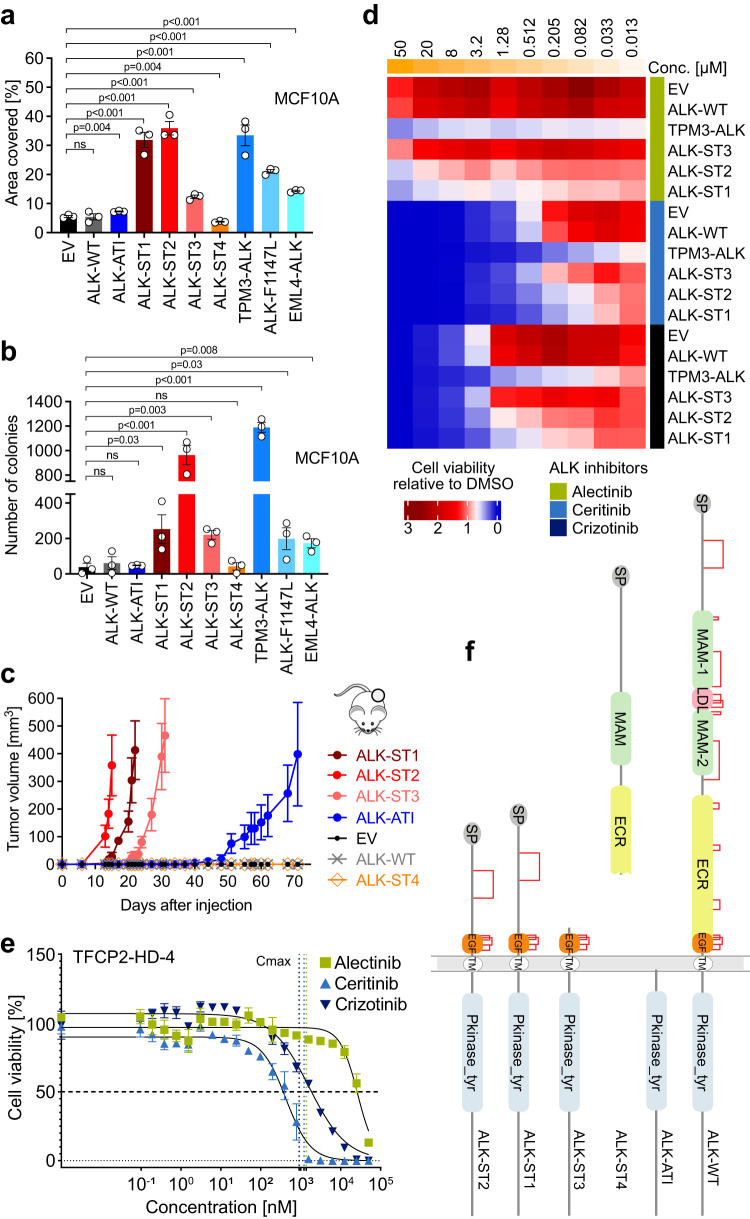
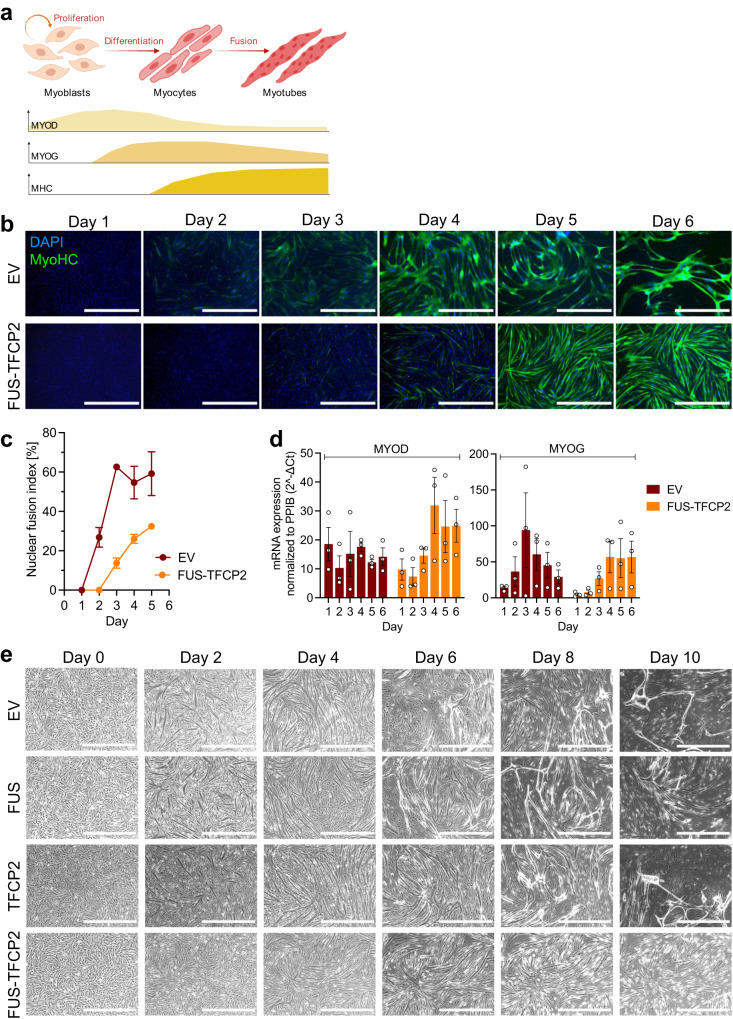
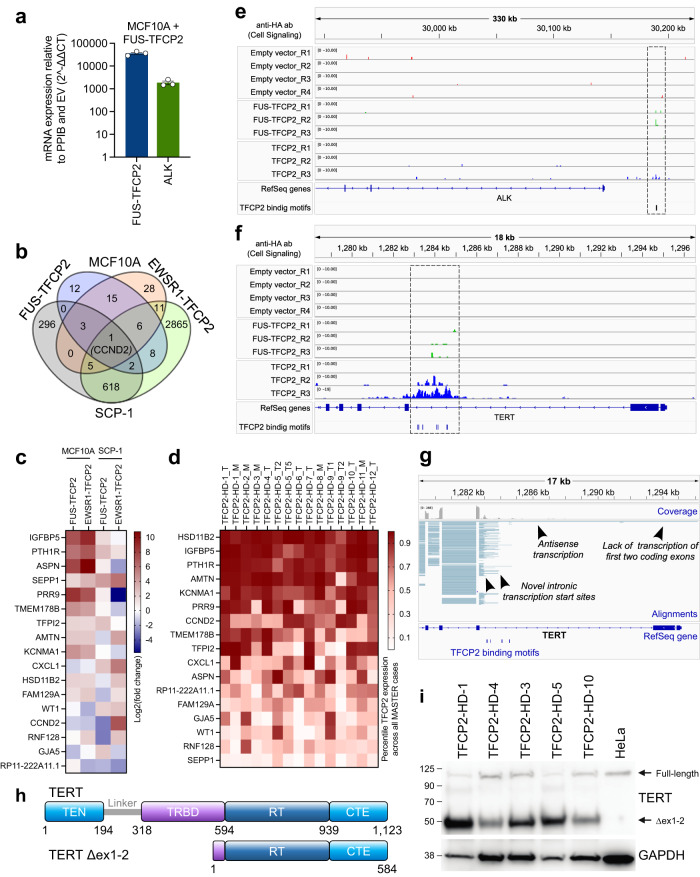
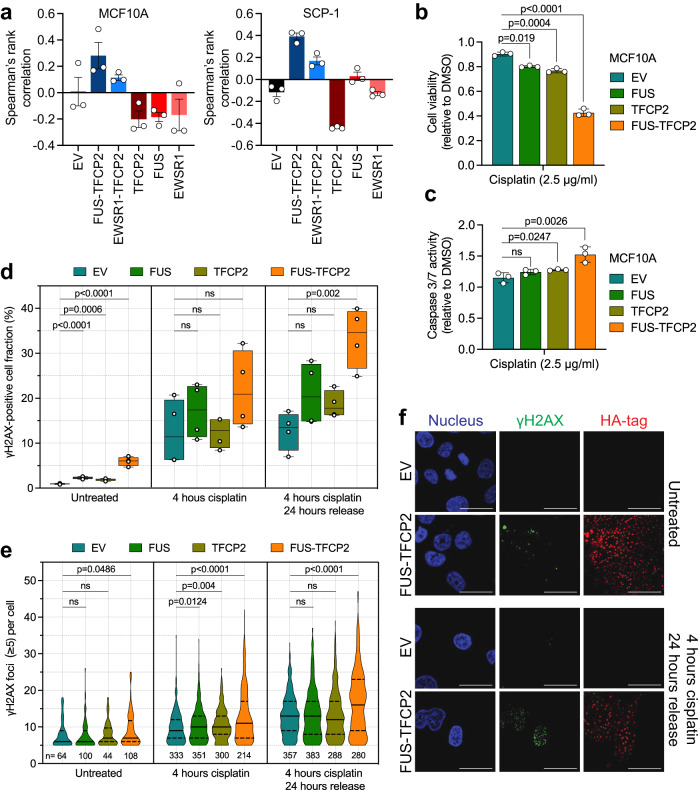
Linking clinical multi-omics with mechanistic studies may improve the understanding of rare cancers. We leverage two precision oncology programs to investigate rhabdomyosarcoma with FUS/EWSR1-TFCP2 fusions, an orphan malignancy without effective therapies. All tumors exhibit outlier ALK expression, partly accompanied by intragenic deletions and aberrant splicing resulting in ALK variants that are oncogenic and sensitive to ALK inhibitors. Additionally, recurrent CKDN2A/MTAP co-deletions provide a rationale for PRMT5-targeted therapies. Functional studies show that FUS-TFCP2 blocks myogenic differentiation, induces transcription of ALK and truncated TERT, and inhibits DNA repair. Unlike other fusion-driven sarcomas, TFCP2-rearranged tumors exhibit genomic instability and signs of defective homologous recombination. DNA methylation profiling demonstrates a close relationship with undifferentiated sarcomas. In two patients, sarcoma was preceded by benign lesions carrying FUS-TFCP2, indicating stepwise sarcomagenesis. This study illustrates the potential of linking precision oncology with preclinical research to gain insight into the classification, pathogenesis, and therapeutic vulnerabilities of rare cancers.


Conflict of interest statement

The authors declare the following competing interests: C.E.H. has received research funding from AstraZeneca, Pfizer, PharmaMar, and Roche. I.Ø. has received funding from AstraZeneca and Pfizer. D.B.L. has received honoraria from Illumina and is an employee of Infectopharm. S.F. has had a consulting or advisory role and received honoraria, research funding, and/or travel/accommodation expenses funding from the following for-profit companies: Amgen, AstraZeneca, Bayer, Eli Lilly, Pfizer, PharmaMar, and Roche. The other authors declare no competing interests.

Figures

Fig. 1
Fig. 1. Morphologic and immunohistochemical characteristics of FUS/EWSR1-TFCP2 RMS.
a Early lesion (top) showing isomorphic bland spindle cells infiltrating the dermis and subcutaneous fat. Recurrence with histopathologic criteria of malignancy (bottom) 32 months later with significantly increased cellularity, nuclear atypia, and brisk mitoses, composed mainly of spindle cells with intermingled epithelioid/rhabdoid elements. b Early lesion (top) with slightly increased cellularity compared to (a) showing infiltration of the dermis and subcutaneous fat by spindle cells with minimal to low nuclear atypia. Recurrent lesion (bottom) at RMS diagnosis 12 months later with a biphasic pattern consisting of larger areas resembling the spindle cell proliferation of the primary tumor with markedly increased cellularity and nuclear irregularities (part 1) and a second component with a blue cell aspect due to epithelioid/rhabdoid cells with atypical nuclei, coarse chromatin, and brisk mitotic activity (part 2). Stainings were performed once in an accredited pathology laboratory with standardized semi-automated procedures and appropriate controls. H&E, hematoxylin and eosin. Scale bar, 100 µm.
Fig. 2
Fig. 2. Genetic characteristics of FUS/EWSR1-TFCP2 sarcoma.
a ALK and TERT mRNA expression of tumors from all patients enrolled in the MASTER program until November 21, 2018, and all FUS/EWSR1-TFCP2 cases from the MASTER and INFORM studies (indicated in red). TPM, transcripts per million. b Representative ALK transcript variants (see Supplementary Fig. 2c for the remaining cases). The expression levels of ALK exons are indicated by the depth of coverage (pink, regular exons; blue, upstream exons). The expression levels of splice junctions are indicated by the heights of the arcs connecting the exons. Intragenic deletions lead to exon skipping. c Genomic alterations occurring in three or more FUS/EWSR1-TFCP2 sarcoma samples. Copy-number aberrations were filtered for genes listed in the COSMIC Cancer Gene Census (https://cancer.sanger.ac.uk/census), and only homozygous deletions or amplifications with a total copy number above 2.5-fold base ploidy are shown. SNV, single-nucleotide variant; hom., homozygous; SV, structural variant. d Average copy-number profile across all TFCP2-rearranged cases. avg., average. e Dimensionality reduction (t-SNE) based on the expression levels of 792 transcription factors in 282 RNA-seq samples from 277 sarcoma patients, including 14 samples from 12 TFCP2-rearranged cases. f t-SNE using the 6,000 most variable CpG sites (mvCpGs) from 345 DNA methylation profiles of sarcoma samples analyzed in MASTER (n = 343) and INFORM (n = 2). ESS combines samples assigned to methylation class ESS_HG or ESS_LG. CSA combines samples assigned to methylation class CSA_group_A, CSA_group_B, CSA_MES, or CSA_IDH_group_A. In addition, 11 FUS/EWSR1-TFCP2 cases from nine patients were included, which formed two clusters (TFCP2_1 and TFCP2_2), whereas one sample (HD-12) clustered separately. g Spearman correlation of TFCP2_1 (left panel) and TFCP2_2 (right panel) cases with samples from 19 sarcoma entities based on the same 6000 mvCpGs. Entities are sorted by decreasing correlation from top to bottom. The color code is the same as in f. TFCP2 FUS/EWSR1-TFCP2 sarcoma, RMS_ALV alveolar RMS, RMS_MYOD1 MYOD1-mutant spindle cell/sclerosing RMS, RMS_EMB embryonal RMS, MPNST malignant peripheral nerve sheath tumor, WDLS_DDLS well-differentiated and dedifferentiated liposarcoma, SFT solitary fibrous tumor, CCS clear cell sarcoma, ES epithelioid sarcoma, USARC undifferentiated sarcoma, CHORD chordoma, ASPS alveolar soft part sarcoma, SEF sclerosing epithelioid sarcoma, GIST gastrointestinal stromal tumor, AS angiosarcoma, CSA chondrosarcoma, OS_HG osteosarcoma high-grade, DSRCT desmoplastic small round cell tumor, ESS endometrial stromal sarcoma, EWING Ewing sarcoma, MLS myxoid liposarcoma, SYSA synovial sarcoma.
Fig. 3
Fig. 3. Functional and structural characteristics of ALK alterations associated with FUS/EWSR1-TFCP2 RMS.
a Colony formation of MCF10A cells stably transduced with ALK alterations or EV. Mean ± SEM (n = 3 independent experiments). b Anchorage-independent growth in soft agar of MCF10A cells stably transduced with ALK alterations or EV. Mean ± SEM (n = 3 independent experiments). c Tumor growth in NOD-SCID mice of MCF10A cells stably transduced with ALK alterations or EV. Shown is the mean volume ± SEM of six tumors per cell line until the first mouse had to be sacrificed in one group due to reaching the maximum allowed tumor length. d Sensitivity of MCF10A cells stably transduced with the indicated ALK variants or EV to crizotinib, ceritinib, or alectinib after 72 h in the absence of EGF. Drug concentrations (conc.) are shown at the top of the heatmap. Mean cell viability of drug-treated cells relative to the respective DMSO control (n = 2 independent experiments). e Sensitivity of freshly isolated and singularized cells from tumor sample TFCP2-HD-4 to the ALK inhibitors crizotinib, ceritinib, or alectinib. Vertical dotted lines represent the Cmax of each compound. Mean ± SEM (n = 4 technical replicates). f Domain architectures of ALK variants. Pairings between cysteines in each variant are indicated by red lines. SP signal peptide, MAM meprin A-5 protein, and receptor protein-tyrosine phosphatase mu domain, LDL low-density lipoprotein receptor class A, EGF epidermal growth factor-like domain, TM transmembrane helix, Pkinase_tyr tyrosine protein kinase domain. Statistical significance was assessed by a one-tailed unpaired t-test. ns not significant. Source data for ae are provided in the Source Data file.
Fig. 4
Fig. 4. Effects of TFCP2 fusions on myogenic differentiation.
a Stages of muscle cell differentiation from myoblasts to myotubes and corresponding expression pattern of MYOD and MYOG transcription factors and myosin heavy chain (MHC). The image was created with BioRender.com and adapted from Bentzinger et al.. b Immunofluorescence images of LHCN-M2 cells transduced with EV or FUS-TFCP2 and cultured in differentiation medium for six days. Green, MyoHC; blue, DAPI (nuclei). Representative images of three independent experiments with similar results are shown. Scale bar, 1 mm. c Fusion index of LHCN-M2 cells transduced with EV or FUS-TFCP2 and cultured in differentiation medium for five days. Mean ± SEM (n = 3 independent experiments). d Relative MYOD and MYOG mRNA expression of LHCN-M2 cells transduced with EV or FUS-TFCP2 and cultured in differentiation medium for six days. Mean ± SEM (n = 3 independent experiments). e Phase-contrast images of LHCN-M2 cells transduced with EV, FUS, TFCP2, or FUS-TFCP2 and cultured in differentiation medium for ten days. Representative images of six independent experiments with similar results are shown. Scale bar, 1 mm. Source data for c and d are provided in the Source Data file.
Fig. 5
Fig. 5. Transcriptional effects of TFCP2 fusions.
a Relative FUS-TFCP2 and ALK mRNA expression in MCF10A cells stably transduced with FUS-TFCP2. Mean ± SEM (n = 3 independently transduced cell lines). Source data are provided in the Source Data file. b Number of genes significantly deregulated in MCF10A and SCP-1 cells transduced with FUS-TFCP2 or EWSR1-TFCP2 versus cells transduced with EV (log2(fold-change) >1.0 or <–1.0), as determined by RNA-seq. c Genes significantly deregulated in MCF10A and SCP-1 cells transduced with FUS-TFCP2 or EWSR1-TFCP2 versus cells transduced with EV (log2(fold-change) >1.0 or <–1.0 in at least three cell lines), as determined by RNA-seq. d Expression of genes from c in FUS/EWSR1-TFCP2-positive sarcoma samples, indicated as percentiles of expression across the entire MASTER cohort. e, f Genome browser images of ALK (e) and TERT (f) showing enrichment peaks obtained by ACT-seq with an anti-HA antibody (Cell Signaling) in MCF10A cells stably expressing EV, HA-TFCP2, or HA-FUS-TFCP2. g Genome browser image showing aberrant transcription originating from the second intron of TERT in patient TFCP2-HD-1. The first two exons were not transcribed. Instead, multiple novel intronic transcription start sites (red alignments) and antisense transcription (blue reads) were found around putative TFCP2 binding sites (bottom) detected by HOMER using the known Tcfcp2l1 binding motif. h Domain structure of full-length TERT (top) and the TERT variant predicted to be translated from mRNA lacking exons 1 and 2 (bottom). The domain structure was adapted from Chan et al.. CTE C-terminal extension, RT reverse transcriptase, TEN TERT-essential N-terminal, TRBD telomerase RNA-binding domain. i Western blot with tumor tissue from five patients and HeLa cells with an antibody binding to the C-terminus of TERT. Protein masses in kDa are shown on the left. Uncropped blots are provided in the Source Data file.
Fig. 6
Fig. 6. Impaired DNA repair in FUS/EWRS1-TFCP2-expressing cells.
a Correlation of the gene expression profiles induced by EV, FUS-TFCP2, EWSR1-TFCP2, TFCP2, FUS, or EWSR1 in MCF10A (left panel) and SCP-1 (right panel) cells with the HRD gene expression signature reported by Peng et al.. A positive Spearman rank correlation value indicates HRD. Mean ± SEM (n = 3 independently transduced cell lines). b, c Effect of cisplatin on cell viability after six days of treatment (b) and caspase 3/7 activity after three days of treatment (c) in MCF10A cells expressing EV, FUS, TFCP2, or FUS-TFCP2. Mean ± SD (n = 3 independent experiments). d Quantification of γH2AX levels by flow cytometry in MCF10A cells expressing EV, FUS, TFCP2, or FUS-TFCP2. Cells were cultured in regular medium (left panel), incubated with 2.5 μg/ml cisplatin for 4 h (middle panel), or treated with 2.5 μg/ml cisplatin for 4 h followed by a 24-h incubation in regular medium (right panel). Box and whisker plot (median; box, 25th to 75th percentiles; whiskers, min to max; n = 4 independent experiments). e Violin plots (lines: median and quartiles) showing the number of γH2AX foci per cell determined by immunofluorescence. The same cells as in d were used from n = 2 independent experiments, and only cells with five or more foci per cell are shown. The number of cells per condition is indicated at the bottom. f Representative immunofluorescence images of MCF10A cells from the experiment shown in e. Additional images are provided in Supplementary Fig. 6. Scale bar, 100 μm. Statistical significance was assessed by a two-tailed unpaired t-test. ns, not significant. Source data for ae are provided in the Source Data file.

References

    1. Taylor BS, et al. Advances in sarcoma genomics and new therapeutic targets. Nat. Rev. Cancer. 2011;11:541–557. doi: 10.1038/nrc3087. - DOI - PMC - PubMed
    1. Leiner J, Loarer FL. The current landscape of rhabdomyosarcomas: an update. Virchows Arch. 2020;476:97–108. doi: 10.1007/s00428-019-02676-9. - DOI - PubMed
    1. Kashi VP, Hatley ME, Galindo RL. Probing for a deeper understanding of rhabdomyosarcoma: insights from complementary model systems. Nat. Rev. Cancer. 2015;15:426–439. doi: 10.1038/nrc3961. - DOI - PMC - PubMed
    1. Erp AEM, van, Versleijen-Jonkers YMH, Graaf WTAvander, Fleuren EDG. Targeted therapy–based combination treatment in rhabdomyosarcoma. Mol. Cancer Ther. 2018;17:1365–1380. doi: 10.1158/1535-7163.MCT-17-1131. - DOI - PubMed
    1. Board, W. C. of T. E. Soft Tissue and Bone Tumours (IARC Publications, 2020).

Publication types