. 2024 Jan 2;15(1):113.
doi: 10.1038/s41467-023-44304-w.

Synovial microenvironment-influenced mast cells promote the progression of rheumatoid arthritis

Affiliations

Synovial microenvironment-influenced mast cells promote the progression of rheumatoid arthritis

Yunxuan Lei et al. Nat Commun. .

Abstract

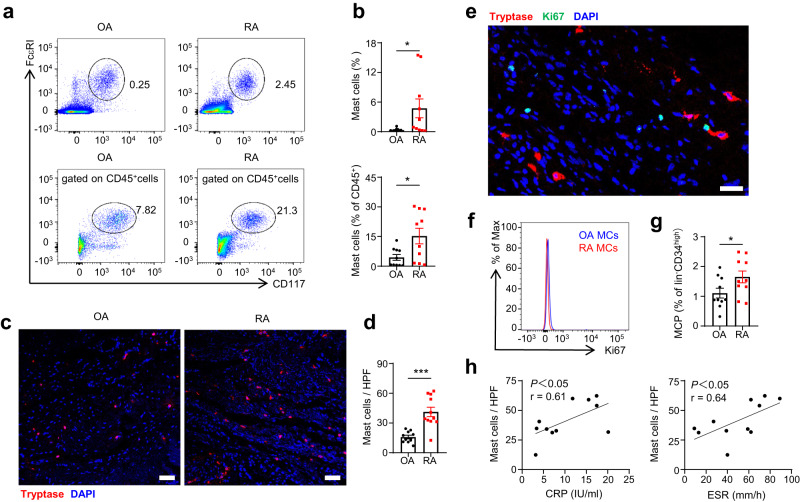
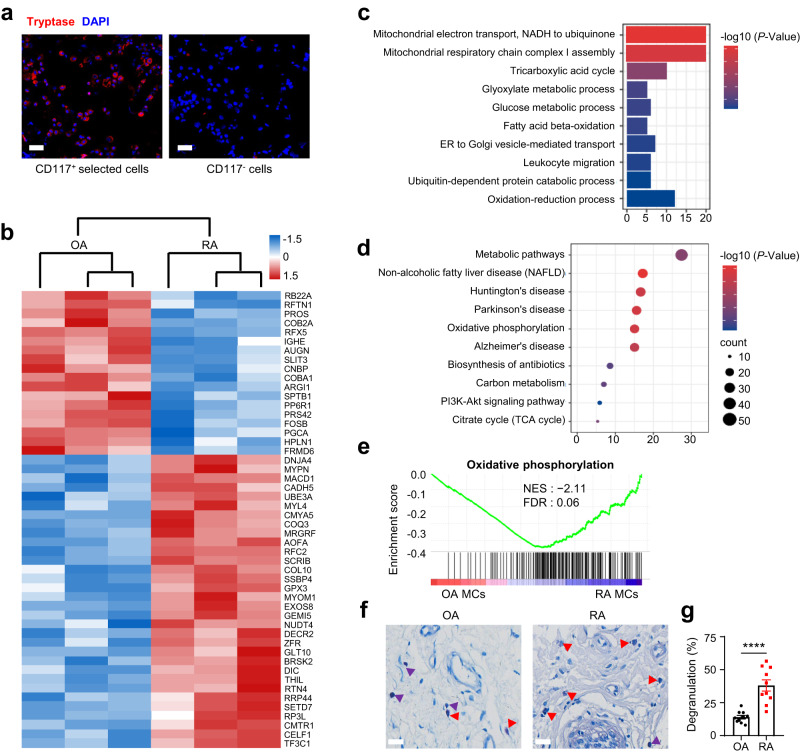
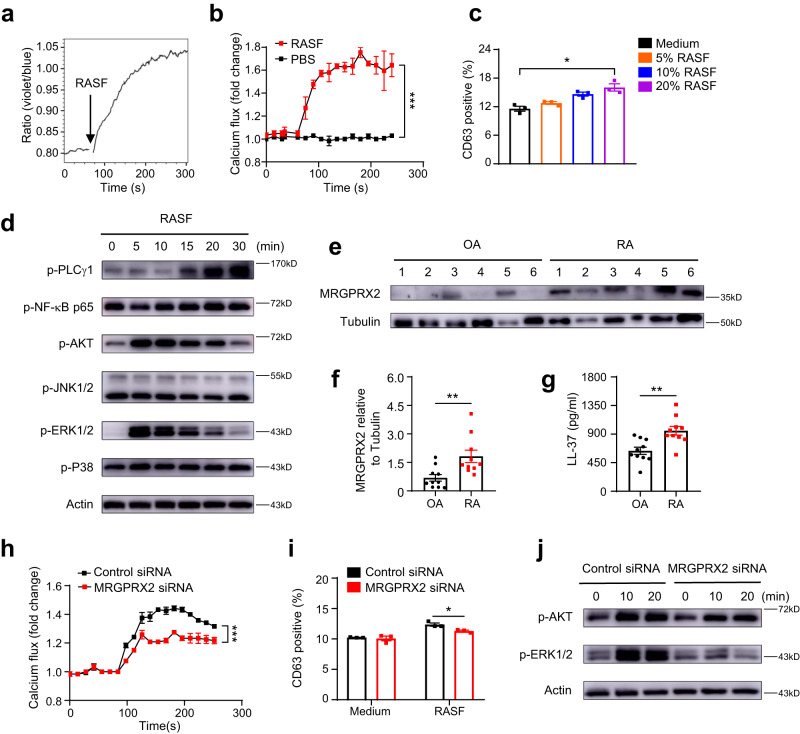
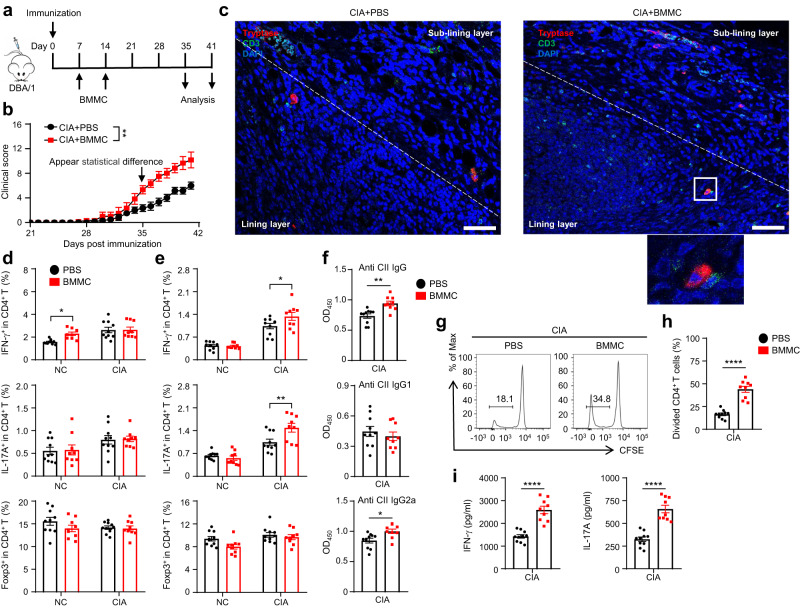
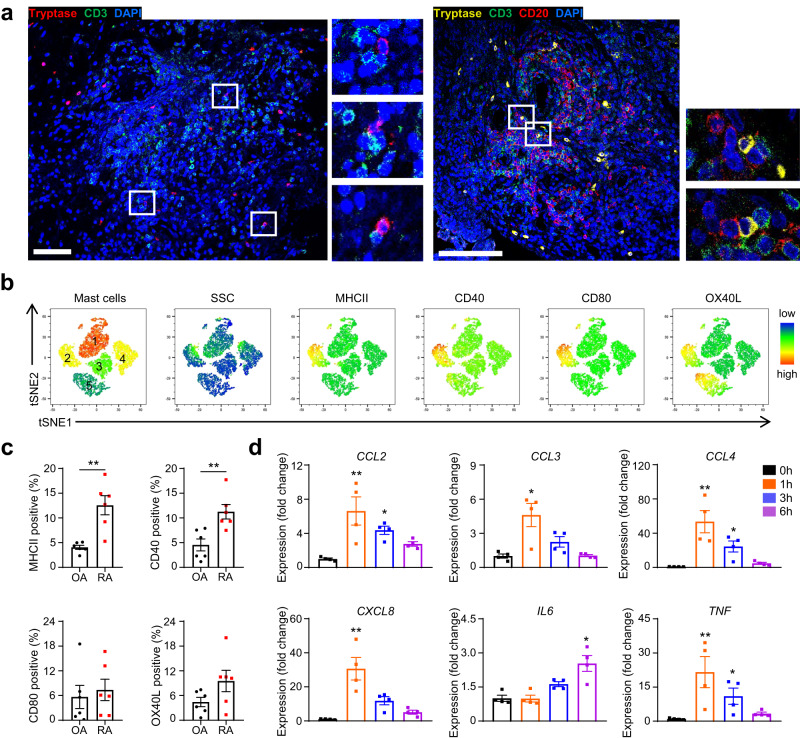
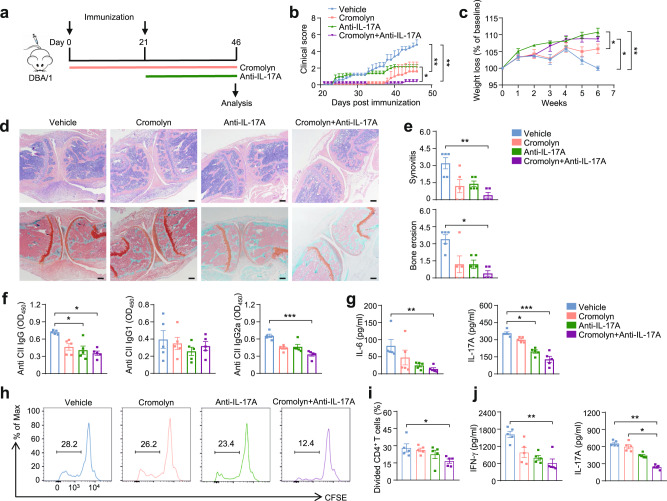
Mast cells are phenotypically and functionally heterogeneous, and their state is possibly controlled by local microenvironment. Therefore, specific analyses are needed to understand whether mast cells function as powerful participants or dispensable bystanders in specific diseases. Here, we show that degranulation of mast cells in inflammatory synovial tissues of patients with rheumatoid arthritis (RA) is induced via MAS-related G protein-coupled receptor X2 (MRGPRX2), and the expression of MHC class II and costimulatory molecules on mast cells are upregulated. Collagen-induced arthritis mice treated with a combination of anti-IL-17A and cromolyn sodium, a mast cell membrane stabilizer, show significantly reduced clinical severity and decreased bone erosion. The findings of the present study suggest that synovial microenvironment-influenced mast cells contribute to disease progression and may provide a further mast cell-targeting therapy for RA.


Conflict of interest statement

The authors declare no competing interests.

Figures

Fig. 1
Fig. 1. Frequency of synovial mast cells was increased in RA patients and correlated with disease severity.
a Synovial membranes from OA and RA patients were digested into single-cell suspension. Synovial mast cells were gated as CD45+CD117+FcεRI+ cells. Numbers indicated the percentages of mast cells in the gates. b Statistical analysis of mast cell percentage in synovial single-cell suspensions and CD45+ immune cells (n = 10 biologically independent samples for each group, P = 0.0328 for percentage in suspensions, P = 0.0196 for percentage in CD45+ cells). c Synovial infiltrating mast cells were defined by tryptase immunofluorescence staining. Red, tryptase; Blue, DAPI. Scale bar: 75 μm. d Statistical analysis of mast cell numbers per high power field (HPF) in synovial sections (n = 10 biologically independent samples in OA group, n = 11 biologically independent samples in RA group, P = 0.0001). e Ki-67 expression on synovial mast cells was detected by immunofluorescence staining. Red, tryptase; Green, Ki-67; Blue, DAPI. Scale bar: 25 μm. Data are representative of three independent experiments. f Blue and red histograms in the flow plot depicted synovial mast cells (MCs) from OA and RA patients, respectively. Data are representative of three independent experiments. g Frequency of mast cell progenitors (MCP) in the peripheral blood by gating on Lin-CD34hiCD117int/hiFcεRI+ cells (n = 10 biologically independent samples for each group, P = 0.0492). h The correlations between synovial mast cell numbers per HPF and ESR or CRP in RA patients were analyzed (n = 11 biologically independent samples, P = 0.0464 mast cells vs CRP, P = 0.0356 mast cells vs ESR). Data are presented as the mean ± SEM and analyzed using two-tailed unpaired t test (b, d, and g), or two-tailed Pearson’s correlation (h). *P < 0.05, **P < 0.01, and ***P < 0.001. Source data are provided as a Source Data file.
Fig. 2
Fig. 2. RA synovial microenvironment-induced activation of mast cells.
Synovial mast cells were enriched from digested synovial tissues of OA and RA patients by magnetic bead sorting for CD117cells and used for label-free mass spectrometry. a Mast cell purity was confirmed by tryptase staining of enriched CD117cells. Red, tryptase; Blue, DAPI. Scale bar: 25 μm. Data are representative of three independent experiments. b Heatmap of top 50 differentially expressed proteins between synovial mast cells from OA and RA patients by hierarchical clustering after z-score normalization. Upregulated and downregulated proteins in RA synovial mast cells were depicted in red and blue, respectively. c, d GO analysis and KEGG pathway analysis of differentially expressed proteins showed enriched terms including mitochondria metabolism, energy metabolism, and leukocyte migration, along with strong changes in metabolic pathways. e Overexpression of oxidative phosphorylation related proteins in synovial mast cells from RA patients by GSEA. f Representative images of toluidine blue-stained synovium from OA and RA patients. Resting mast cells and degranulated mast cells were indicated by purple and red markers, respectively. Scale bar: 25 μm. g Statistical analysis of mast cell degranulation rate by counting five fields of view (n = 10 biologically independent samples for each group, P < 0.0001). Data are presented as the mean ± SEM and analyzed using two-tailed unpaired t test (c, d, g), ****P < 0.0001. The P-values are adjusted in multiple comparisons (FDR < 1% for c and d). Source data are provided as a Source Data file.
Fig. 3
Fig. 3. RASF can induce mast cell activation through MRGPRX2.
To imitate RA synovial microenvironment in vitro, LAD2 cells were stimulated with synovial fluid from RA patients (RASF). a LAD2 cells were loaded with Indo-1 and applied with RASF. The ratio of Ca2+ bound Indo-1 violet to Ca2+ free Indo-1 blue was plotted against time and was monitored for nearly five minutes by flow cytometry. The black arrow indicated the time when RASF was added. b Intracellular calcium flux (fold change of Indo-1 ratio compared with baseline) of LAD2 cells in response to RASF or PBS was shown (n = 3 for each group, pooled from three independent experiments, P = 0.0002). c Statistical analysis of degranulation rate, indicated by the proportion of CD63+ cells in LAD2 after being stimulated with different concentrations of RASF for 20 min (n = 3 for each group, pooled from three independent experiments, P = 0.0139). d Phosphorylated levels of signaling pathways in LAD2 cells treated with 10% RASF for different time intervals. Data are representative of three independent experiments. e Western blots of MRGPRX2 and Tubulin in total protein extracts of synovial tissues from OA and RA patients. Data are representative of two independent experiments. f Quantification of relative MRGPRX2 expression by densitometry (n = 10 biologically independent samples for each group, P = 0.0068). g Statistical analysis of LL37 concentration in synovial tissues between OA and RA patients (n = 10 biologically independent samples for each group, P = 0.0023). Intracellular calcium flux (h), degranulation rate (i), and representative blots (j) for LAD2 treated with siRNA against MRGPRX2 or control siRNA (n = 3 for each group, pooled from three independent experiments, P < 0.0001 for h, P = 0.0362 for i) after RASF stimulation. Data are representative of three independent experiments (j). Data are presented as the mean ± SEM and analyzed using two-way ANOVA (b, h, i), Kruskal-Wallis test (c), two-tailed Mann Whitney test (f), two-tailed unpaired t test (g). *P < 0.05, **P < 0.01, and ***P < 0.001. Source data are provided as a Source Data file.
Fig. 4
Fig. 4. Adoptive transfer of mast cells promoted disease severity and T cell response in CIA mice.
a The schematic diagram of study design: After subcutaneous immunization of CII and CFA at the tail on day 0, 5×10⁶ mast cells were adoptively transferred through tail vein injection on day 7 and day 14. b Clinical scores of control group and transfer group (n = 6 mice for each group, pooled from two independent experiments, P = 0.0016). c Representative immunofluorescence images of synovial tissues from control group and transfer group. Red, tryptase; Green, CD3; Blue, DAPI. Scale bar: 50 μm. White dotted lines represent the boundary between lining layer and sub-lining layer. The area in the white box is enlarged as an inset. Data are representative of 6 biologically independent samples. d Frequencies of CD4+IFN-γ+ cells, CD4+IL-17A+ cells, and CD4+Foxp3+ cells in the spleen detected by flow cytometry (n = 10 mice for PBS, n = 9 mice for BMMC, pooled from two independent experiments, P = 0.0175). e Frequencies of CD4+IFN-γ+ cells, CD4+IL-17A+ cells, and CD4+Foxp3+ cells in the draining lymph nodes detected by flow cytometry (n = 10 mice for PBS, n = 9 mice for BMMC, pooled from two independent experiments, *P = 0.0183, **P = 0.0026). f Serum levels of anti-CII IgG, IgG1, and IgG2a were quantified by ELISA (n = 10 mice for PBS, n = 9 mice for BMMC, pooled from two independent experiments, **P = 0.0012, *P = 0.0112). g Representative flow plots of CFSE-labeled splenocytes gated on CD3+CD4+ cells after being stimulated with CII for 4 days. h Statistical analysis of proliferation rate after CII stimulation (n = 10 mice for PBS, n = 9 mice for BMMC, pooled from two independent experiments, P < 0.001). i) Inflammatory cytokines released from splenocytes (n = 10 mice for PBS, n = 9 mice for BMMC, pooled from two independent experiments, P < 0.001). Data are presented as the mean ± SEM and analyzed using two-way ANOVA (b, d, e), two tailed unpaired t test (f, h, i). *P < 0.05, **P < 0.01, ***P < 0.001, and ****P < 0.0001. Source data are provided as a Source Data file.
Fig. 5
Fig. 5. Mast cells under RA microenvironment showed altered phenotypes.
a Representative immunofluorescence images of synovial tissues from RA patients. Left: Red, tryptase; Green, CD3; Blue, DAPI; Scale bar: 75 μm. Right: Yellow, tryptase; Green, CD3; Red, CD20; Blue, DAPI; Scale bar: 100 μm. The area in the white box is enlarged as an inset. Data are representative of 10 biologically independent samples. b t-SNE plots of synovial mast cells from four RA patients. c Frequencies of MHCII+, CD40+, CD80+, and OX40L+ mast cells between OA and RA patients (n = 6 biologically independent samples for each group, P = 0.0022 for MHCII, P = 0.0087 for CD40). d Chemokine and cytokine gene expression of LAD2 cells stimulated with 20%RASF for different time intervals were analyzed by qPCR (n = 4 biologically independent samples for each group, **P = 0.007 and *P = 0.0225 for CCL2, P = 0.0225 for CCL3, **P = 0.0025 and *P = 0.0347 for CCL4, P = 0.0011 for CXCL8, P = 0.02 for IL6, **P = 0.0054 and *P = 0.0311 for TNF). Data are presented as the mean ± SEM and analyzed using two-tailed Mann Whitney test (c), and Kruskal-Wallis test (d). *P < 0.05, **P < 0.01. Source data are provided as a Source Data file.
Fig. 6
Fig. 6. Prophylactic applications of cromolyn sodium and anti-IL-17A attenuated CIA.
a The schematic diagram of study design: All mice received initial immunization on day 0 and booster immunization on day 21. After being randomly divided into 4 groups, mice were treated through intraperitoneal injection with the vehicle, cromolyn (25 mg/kg), IL-17A antibody (150 µg each time), or the combination of the cromolyn and IL-17A antibody. Cromolyn and anti-IL-17A treatment was started from day 0 and day 21, respectively, and were both given every other day. b Arthritis scores were measured every day after booster immunization (n = 5 mice for each group, P = 0.0049 Vehicle vs Cromolyn, P = 0.0016 Vehicle vs Cromolyn+Anti-IL-17A, P = 0.0437 Anti-IL-17A vs Cromolyn+Anti-IL-17A). c Weight loss of each group showed as a percentage change observed once a week (n = 5 mice for each group, P = 0.0013 Vehicle vs Anti-IL-17A, P = 0.0165 Vehicle vs Cromolyn+Anti-IL-17A, P = 0.0262 Cromolyn vs Anti-IL-17A). d Representative images of H&E and Safranin O-fast green staining of knee joints. Scale bar: 200 μm. e Statistical analysis of synovitis and bone erosion (n = 5 mice for each group, **P = 0.0069, *P = 0.0119). f Serum levels of anti-CII IgG, IgG1, and IgG2a were quantified by ELISA (n = 5 mice for each group, P = 0.0327 for IgG Vehicle vs Anti-IL-17A, P = 0.0166 for IgG Vehicle vs Cromolyn+Anti-IL-17A, P = 0.0009 for IgG2a). g Serum levels of IL-6 and IL-17A were determined by ELISA (n = 5 mice for each group, P = 0.0067 for IL-6, *P = 0.0234 and ***P = 0.0009 for IL-17A). h Representative flow plots of CFSE-labeled splenocytes gated on CD3+CD4+ cells after stimulated with CII for 4 days. i Statistical analysis of proliferation rate after stimulation (n = 5 mice for each group, P = 0.0243). j Inflammatory cytokine release from splenocytes after being stimulated with CII (n = 5 mice for each group, P = 0.0034 for IFN-γ, *P = 0.0166 and **P = 0.0014 for IL-17A). Data are representative of two independent experiments (b-j). Data are presented as the mean ± SEM and analyzed using two-way ANOVA (b, c), Kruskal-Wallis test (e-g, and j), and one way ANOVA (i). *P < 0.05, **P < 0.01, and ***P < 0.001. Source data are provided as a Source Data file.

Similar articles

Cited by

References

    1. Aletaha D, Smolen JS. Diagnosis and management of rheumatoid arthritis: a review. JAMA. 2018;320:1360–1372. doi: 10.1001/jama.2018.13103. - DOI - PubMed
    1. Smolen JS, et al. Rheumatoid arthritis. Nat. Rev. Dis. Prim. 2018 4:1. 2018;4:1–23.
    1. Finckh A, et al. Global epidemiology of rheumatoid arthritis. Nat. Rev. Rheumatol. 2022;18:591–602. - PubMed
    1. Favalli EG, et al. Sex and management of rheumatoid arthritis. Clin. Rev. Allergy Immunol. 2019;56:333–345. doi: 10.1007/s12016-018-8672-5. - DOI - PubMed
    1. McInnes IB, Schett G. Pathogenetic insights from the treatment of rheumatoid arthritis. Lancet. 2017;389:2328–2337. doi: 10.1016/S0140-6736(17)31472-1. - DOI - PubMed

Publication types