[Preprint]. 2023 Dec 14:2023.12.13.571345.
doi: 10.1101/2023.12.13.571345.

AAGGG repeat expansions trigger RFC1-independent synaptic dysregulation in human CANVAS Neurons

Affiliations

AAGGG repeat expansions trigger RFC1-independent synaptic dysregulation in human CANVAS Neurons

Connor J Maltby et al. bioRxiv. .

Update in

Abstract

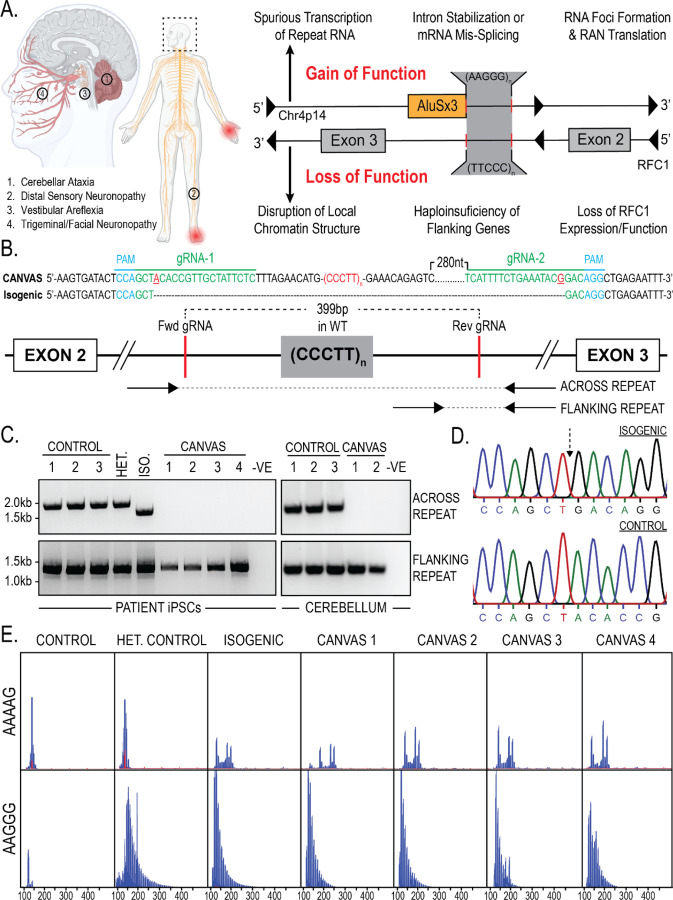
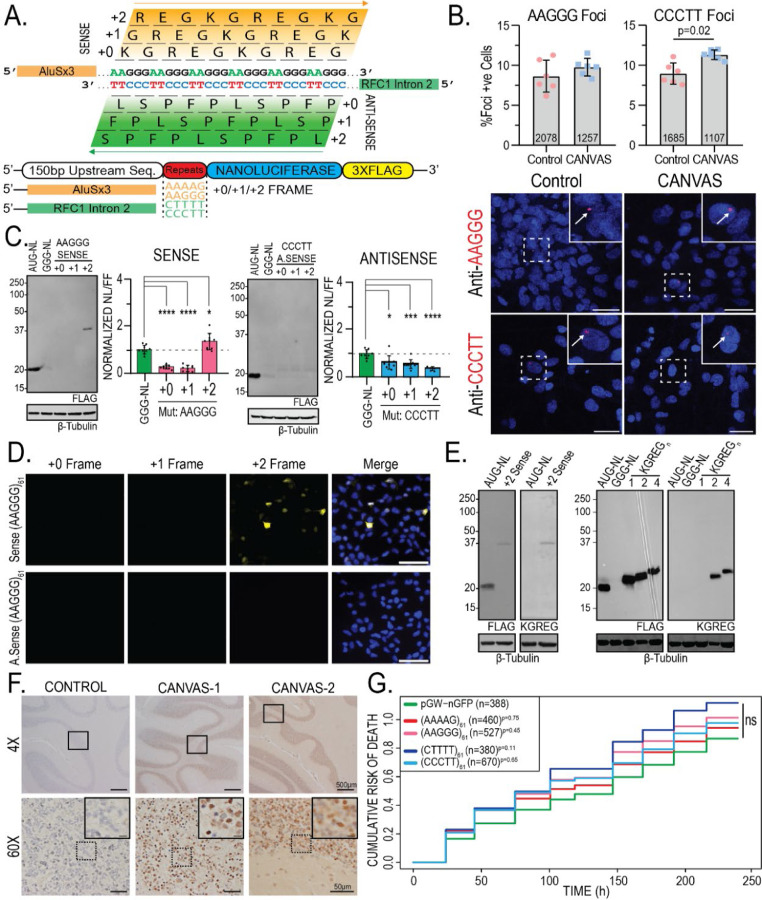
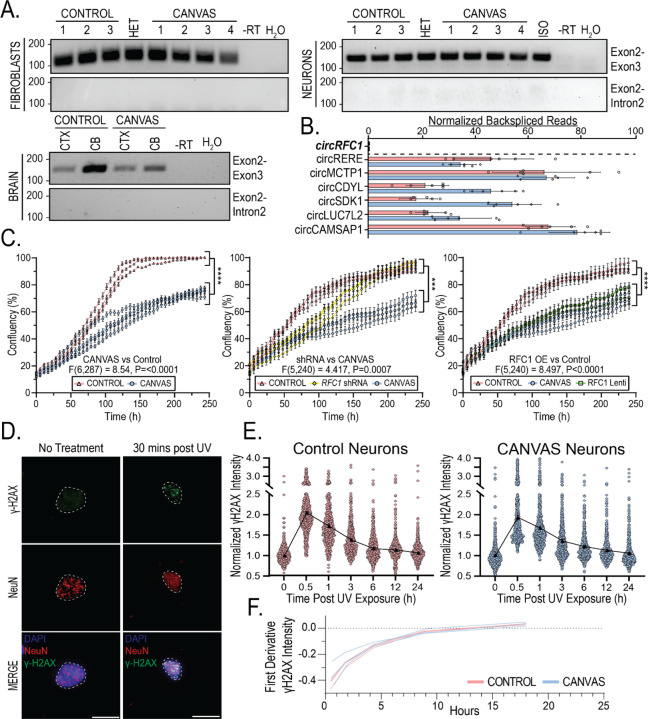
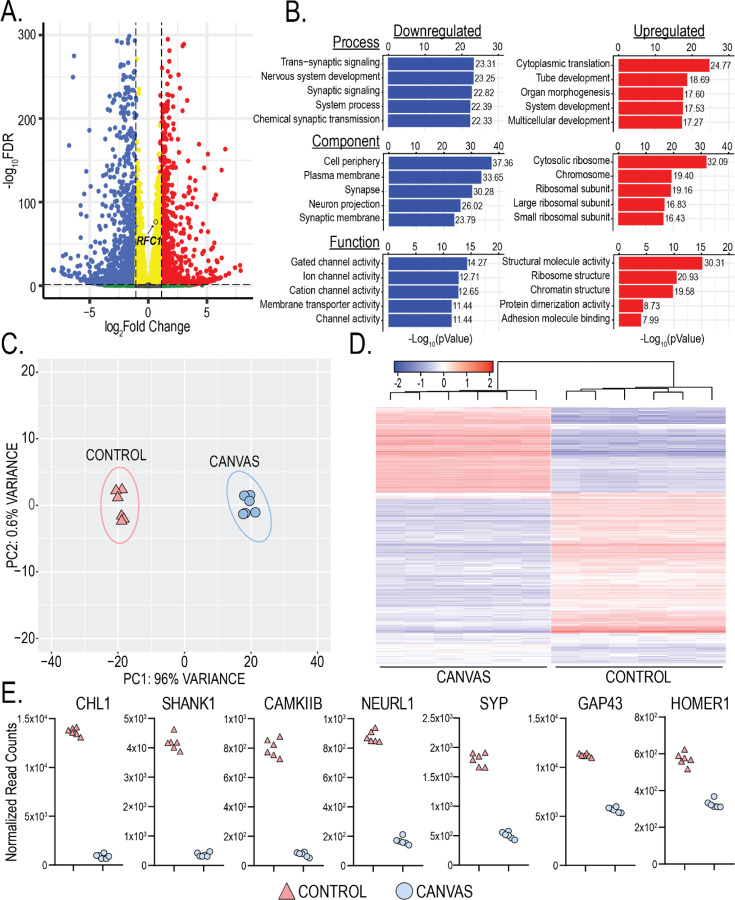
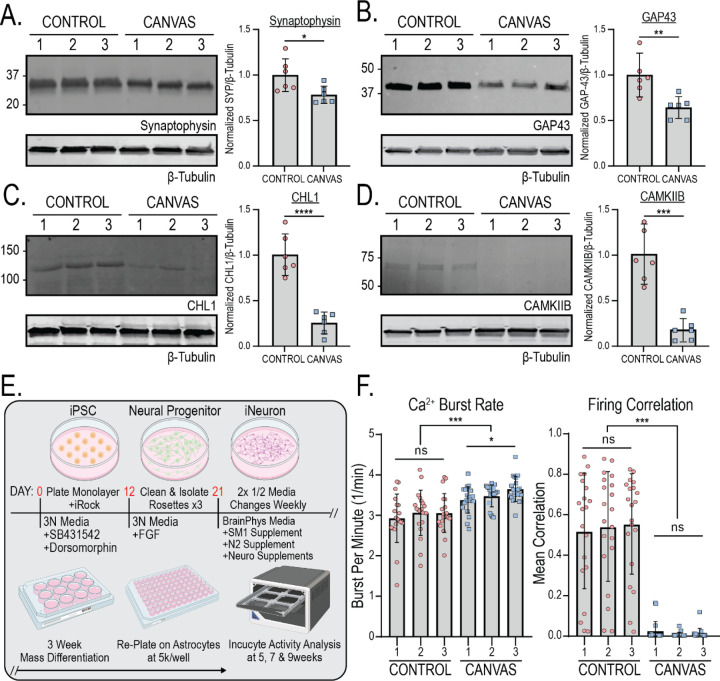
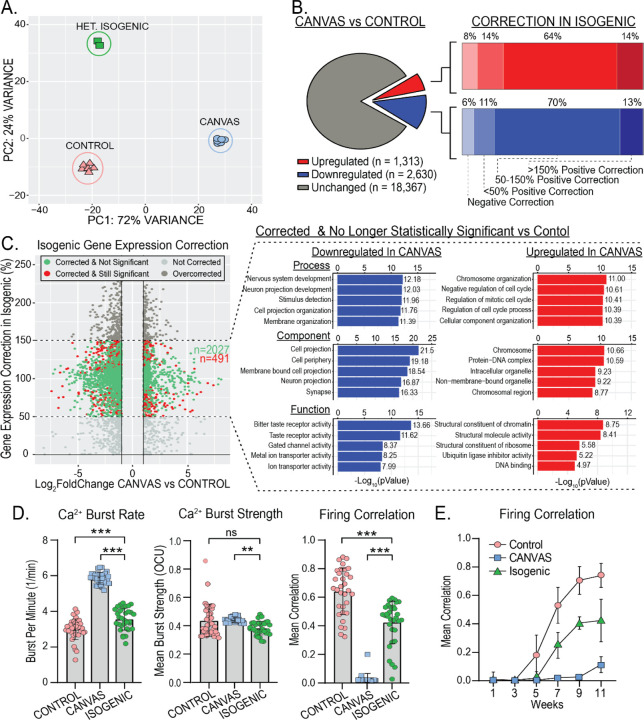
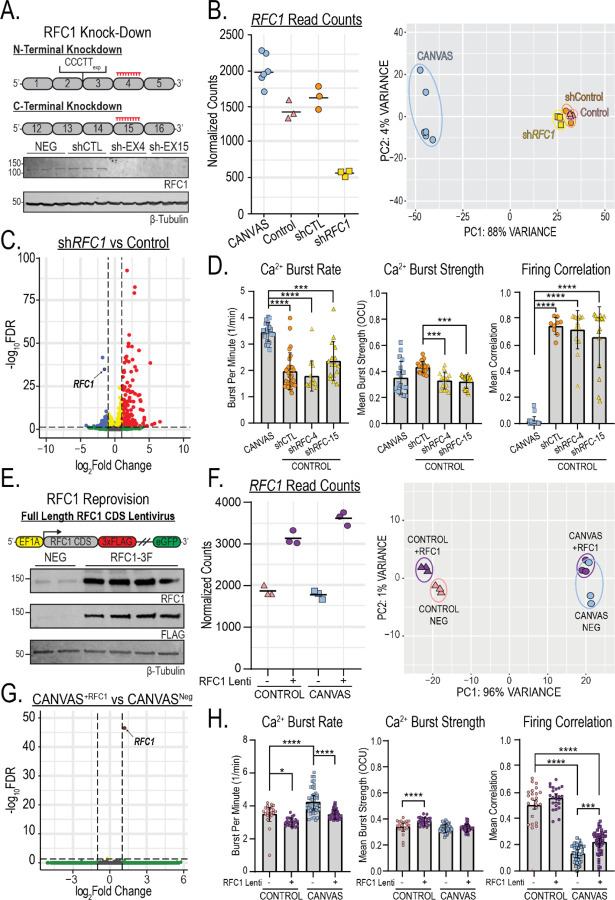
Cerebellar ataxia with neuropathy and vestibular areflexia syndrome (CANVAS) is a late onset, recessively inherited neurodegenerative disorder caused by biallelic, non-reference pentameric AAGGG(CCCTT) repeat expansions within the second intron of replication factor complex subunit 1 (RFC1). To investigate how these repeats cause disease, we generated CANVAS patient induced pluripotent stem cell (iPSC) derived neurons (iNeurons) and utilized calcium imaging and transcriptomic analysis to define repeat-elicited gain-of-function and loss-of-function contributions to neuronal toxicity. AAGGG repeat expansions do not alter neuronal RFC1 splicing, expression, or DNA repair pathway functions. In reporter assays, AAGGG repeats are translated into pentapeptide repeat proteins that selectively accumulate in CANVAS patient brains. However, neither these proteins nor repeat RNA foci were detected in iNeurons, and overexpression of these repeats in isolation did not induce neuronal toxicity. CANVAS iNeurons exhibit defects in neuronal development and diminished synaptic connectivity that is rescued by CRISPR deletion of a single expanded allele. These phenotypic deficits were not replicated by knockdown of RFC1 in control neurons and were not rescued by ectopic expression of RFC1. These findings support a repeat-dependent but RFC1-independent cause of neuronal dysfunction in CANVAS, with important implications for therapeutic development in this currently untreatable condition.

Keywords: Ataxia; C9orf72 FTD/ALS; Fragile X-associated Tremor/Ataxia Syndrome; Friedreich Ataxia; Neurodegeneration; Nucleotide Repeat expansion disorders; RAN translation; RNA foci; Short Tandem Repeats; neuropathy.


Conflict of interest statement

Conflicts of interest The authors declare no direct conflicts of interest related to the content of this manuscript. No commercial forces had editorial or supervisory input on the content of the manuscript or its figures. P.K.T. holds a shared patent on ASOs with Ionis Pharmaceuticals. He has served as a consultant with Denali Therapeutics, and he has licensed technology and antibodies to Denali and Abcam. V.K. is a co-founder of and senior advisor to DaCapo Brainscience and Yumanity Therapeutics, companies focused on CNS diseases.

Figures

Figure 1 –
Figure 1 –. Repeat characterization and heterozygous correction of CANVAS patient derived iPSC lines.
A) Schematic of brain, CNS, and PNS regions affected in CANVAS (left), and potential mechanisms of repeat toxicity in CANVAS (right). B) Repeat architecture of the expanded locus and CRISPR gRNA design to remove the AAGGG/CCCTT repeat expansion by NHEJ. C) Endpoint PCR of gDNA extracted from CANVAS patient and control derived iPSC lines and CANVAS and control cerebellum tissue utilizing the primer pairs outlines in (1B) to screen for the presence of WT repeat, mutant repeat expansion, or deletion of expanded repeat. D) Chromatogram of Sanger Sequencing identifying AAGGG/CCCTT allele deletion in heterozygous isogenic line indicating the expected NHEJ join point compared to control iPSC line. E) Repeat Primed PCR of the expanded locus in CANVAS patient and control derived iPSC lines utilizing anti AAAAG and AAGGG probes.
Figure 2 –
Figure 2 –. Translated AAGGG repeat products are detected in CANVAS patient brains.
A) Schematic of reading frames and peptide products from the sense and antisense strands of the repeat expansion locus. B) Confocal Images of representative CANVAS patient and control neurons after RNA HCR with anti-AAGGG or anti-CCCTT fluorescent probes, scale = 10 µm, and quantification of foci positive neurons for control (n=3) and CANVAS (n=3) patient neurons with total n-numbers of neuronal cells analyzed indicated. AAGGG (F(5, 12) = 3.619, P=0.074), CCCTT (F(5, 12) = 8.293, P=0.011). n = 2 biological replicates from 3 independent patient derived cell lines. Data were analyzed by one-way ANOVA with Sidak’s post-hoc multiple comparison tests. C) Expression analysis of lysates from HEK293 cells transfected with control plasmid or plasmids encoding intronic sense or antisense AAGGG/CCCTT repeat reporters in the +0/+1/+2 reading frames (left) and Nano-luciferase expression assay quantification (right). N = 3 technical replicates from a total of 7 biological replicates. Data were analyzed by one-way ANOVA with Sidak’s post-hoc multiple comparison tests. D) ICC of HEK293 cells transfected with plasmids encoding intronic sense or antisense AAGGG/CCCTT repeat reporters with C-terminal triple-tags in the +0/+1/+2 reading frames. E) Expression analysis of lysates from HEK293 cells transfected with control plasmid +2 Sense (AAGGG)61 plasmid using anti-FLAG M2 (1:1000) and anti-KGREG (1:100) antibodies (left). F) IHC of control (n=1) and RFC1 expansion CANVAS (n=2) patient post-mortem cerebellar vermis tissue stained with sense anti-KGREG antibody (1:100, acid AR). Scale = 500 µm (4x), 50 µm (60x) and 20 µm (inset). Full IHC results of 3x control tissues are shown in supplementary figure 2C. G) Cumulative Hazard Plot for primary rat cortical neurons transfected with CANVAS intronic expression plasmids containing 61 repeats of the indicated type over a 10-day period, n = 8 technical replicates, 3 biological replicates, n numbers of cells shown per condition. Error = SD.
Figure 3 –
Figure 3 –. Canonical functions and expression of RFC1 are normal in CANVAS patient-derived cells.
A) Endpoint RT-PCR utilizing primer sets spanning RFC1 exon2-exon3 or exon2-intron 2 in CANVAS fibroblasts (Top, left), iPSC-derived neurons (Top, right), and CANVAS post-mortem brain (Bottom, left). B) Quantification of normalized circular backspliced read counts for RFC1 and other known circRNA species in CANVAS patient iPSC-derived neurons by paired-end RNASeq analysis. C) 10-day time-course analysis of the rate of cellular division and proliferation in CANVAS (n=4) and control (n=3) fibroblast lines (left, F(6,287) = 8.54, P<0.0001), control fibroblast lines (n=3) mock-treated or treated with RFC1 shRNA lentivirus (center, F(5,240) = 1.314, P=0.131), and CANVAS fibroblast lines (n=3) mock-treated or treated with RFC1 overexpression lentivirus (right, F(5,240) = 2.358, P=0.245). N = 3 biological replicates from 3–4 independent patient cell lines. Data were analyzed by one-way ANOVA with Sidak’s post-hoc multiple comparison tests. D-E) Analysis of recovery after discrete UV exposure and DNA damage in CANVAS patient iPSC-derived neurons. D) Representative images of γ-H2AX staining of iPSC-derived neurons pre- and post-60 mJ/cm2 UV exposure (Scale = 10µm). E) Quantification of mean γ-H2AX staining in CANVAS patient (n=3) and control (n=3) iPSC-derived NeuN+ neuronal nuclei over a 24h period after 60 mJ/cm2 UV exposure (n=16,569 NeuN+ nuclei total). Data were analyzed by one-way ANOVA with post-hoc multiple comparison tests. F) First derivative DNA damage recovery rate curves for CANVAS (n=3) and control (n=3) patient iPSC-derived neurons. Error = SD.
Figure 4 -
Figure 4 -. Synaptic genes are downregulated in CANVAS neurons.
A) Volcano plot of differentially expressed genes in CANVS patient vs control iPSC-derived neurons, blue = significantly downregulated, red = significantly upregulated, RFC1 labelled. B) Gene Ontology (GO) pathway analysis of the top 5 up/downregulated Biological Process, Cellular Component, and Molecular Function in CANVAS patient vs control iPSC-derived neurons. N = 6 biological replicates from 3 individual CANVAS and control patients. C) Principal Component Analysis (PCA) of CANVAS (n=6) vs control (n=6) patient iPSC-derived neurons. D) Heatmap of normalized expression for the top 1000 genes differentially expressed in CANVAS patient vs control iPSC-derived neurons. E) Normalized gene counts for the top 7 downregulated synaptic-associated genes in CANVAS patient vs control iPSC-derived neurons.
Figure 5 –
Figure 5 –. CANVAS patient derived neurons exhibit synaptic dysfunction and reduced connectivity.
A-D) Protein expression (left) and normalized quantification (right) of selected synaptic genes identified as downregulated in CANVAS patient iPSC-derived neurons by transcriptomic analysis - (A) Synaptophysin, (B) GAP43, (C) CHL1, (D) CAMKIIB. N = 2 biological replicates from 3 independent patient derived cell lines. Data were analyzed by one-way ANOVA with Sidak’s post-hoc multiple comparison tests. E) Schematic outlining experimental workflow for generating patient iPSC-derived neurons for calcium imaging analysis. F) Analysis of Ca2+ imaging metrics for control (n=3) and CANVAS (n=3) patient iPSC-derived neurons at 9-weeks post-differentiation. Burst Rate (F(5, 114) = 8.268, P<0.0001), Firing Correlation (F(5, 114) = 45.62, P<0.0001). Each data point represents the mean of ~1000–3000 active cells per well (Supplementary Figure 5). Data were analyzed by one-way ANOVA with Sidak’s post-hoc multiple comparison tests. Error = SD.
Figure 6 –
Figure 6 –. Heterozygous isogenic correction of CANVAS neurons corrects transcriptomic and synaptic functional deficits.
A) Principal Component Analysis (PCA) of CANVAS (n=6), control (n=6), and CANVAS Heterozygous Isogenic (n=2) patient iPSC-derived neurons. B) Schematic illustrating the total number of genes dysregulated (up & down) in CANVAS vs control (left), with the percentage of these up- or down-dysregulated genes that show negative correction, partial correction, or full correction of expression upon heterozygous isogenic correction of CANVAS patient iPSC-derived neuron line. C) Scatter plot of Log2FoldChange (CANVAS vs control) vs Gene expression correction per gene in the heterozygous isogenic patient iPSC-derived neurons (left), and Gene Ontology (GO) pathway analysis of the top 5 up/downregulated Biological Process, Cellular Component, and Molecular Function for the genes that show 50–150% gene expression in Isogenic Correction vs CANVAS and are non-statistically significant in Isogenic vs control conditions. D) Analysis of Ca2+ imaging metrics for control (n=3), CANVAS (n=3), and Heterozygous Isogenic (n=1) patient iPSC-derived neurons. Burst Rate (F(2, 165) = 279.4, P<0.0001), Burst Strength (F(2, 165) = 4.034, P=0.019), Firing Correlation (F(2, 165) = 185.9, P<0.0001). Each data point represents the mean of ~1000–3000 active cells per well (Supplementary Figure 8). Data were analyzed by one-way ANOVA with Sidak’s post-hoc multiple comparison tests. E) Mean firing correlation of control (n=3), CANVAS (n=3), and heterozygous isogenic (n=1) patient iPSC-derived neurons across 10 weeks of differentiation from week 1 to week 11. Error = SD.
Figure 7 –
Figure 7 –. RFC1 knockdown or reprovision fail to recapitulate or correct transcriptomic and synaptic deficits in CANVAS patient-iPSC derived neurons.
A) Schematic outlining approach to knockdown of either the N- or C-terminus of RFC1 by shRNA lentiviral transduction (Top), and analysis of RFC1 expression from control iPSC-derived neurons (GTX129291, 1:1000) indicating successful knockdown of RFC1 (Bottom). B) Normalized read counts for RFC1 transcripts in CANVAS, control iPSC-derived neurons as well as control iPSC-derived neurons treated with either control or anti-RFC1 shRNA lentivirus (left), and Principal Component Analysis (PCA) of CANVAS (n=6), control (n=3), control mock-treated (n=3), and control shRFC1 treated (n=3) patient iPSC-derived neurons. C) Volcano plot of −Log10FDR vs Log2(Fold Change) for RFC1 knockdown vs control, RFC1 labelled. D) Analysis of Ca2+ imaging metrics for CANVAS (n=3) and control (n=3) patient iPSC-derived neurons treated with shControl or shRFC1 exon4/exon15 lentiviruses. Burst Rate (F(3, 78) = 29.6, P<0.0001), Burst Strength (F(3, 78) = 8.265, P<0.0001), Firing Correlation (F(3, 78) = 100.6, P<0.0001). E) Schematic outlining the approach of RFC1 overexpression in CANVAS patient iPSC-derived neurons by lentiviral transduction (Top), and analysis of RFC1 expression in patient iPSC-derived neurons upon lentiviral transduction (Bottom). F) Normalized read counts for RFC1 transcripts in CANVAS and control iPSC-derived neurons transduced with either full-length RFC1 CDS lentivirus or control lentivirus (n=3/group) (left), and Principal Component Analysis (PCA) of CANVAS and control iPSC-derived neurons transduced either full-length RFC1 CDS lentivirus or control lentivirus (n=3/group) (right). G) Volcano plot of −Log10FDR vs Log2(Fold Change) for CANVAS patient-derived neurons transduced with either full-length RFC1 CDS lentivirus or control lentivirus (n=3/group), RFC1 labelled. H) Analysis of Ca2+ imaging metrics for control (n=3) and CANVAS (n=3) patient iPSC-derived neurons treated with control or RFC1-overexpression lentivirus. Burst Rate (F(3, 135) = 31.01, P<0.0001), Burst Strength (F(3, 135) = 16.74, P<0.0001), Firing Correlation (F(3, 135) = 147.3, P<0.0001). Firing Correlation two-way ANOVA treatment vs genotype: F(1,135) = 41.25, P<0.0001, F(1,135) = 36.64, P<0.0001 respectively. Each data point represents the mean of ~1000–3000 active cells per well (Supplementary Figure 5). Data were analyzed by one-way ANOVA with Sidak’s post-hoc multiple comparison tests. Error = SD.

References

    1. Cortese Andrea, Curro’ Riccardo, Vegezzi Elisa, Yau Wai Yan, Houlden Henry, and Reilly Mary M (2022). Cerebellar ataxia, neuropathy and vestibular areflexia syndrome (CANVAS): genetic and clinical aspects. Pract Neurol 22, 14. 10.1136/practneurol-2020-002822. - DOI - PubMed
    1. Szmulewicz David J., Roberts Leslie, McLean Catriona A., MacDougall Hamish G., Halmagyi G. Michael, and Storey Elsdon (2016). Proposed diagnostic criteria for cerebellar ataxia with neuropathy and vestibular areflexia syndrome (CANVAS). Neurology: Clinical Practice 6, 61. 10.1212/CPJ.0000000000000215. - DOI - PMC - PubMed
    1. Paisán-Ruiz C., and Jen J.C. (2020). CANVAS with cerebellar/sensory/vestibular dysfunction from RFC1 intronic pentanucleotide expansion. Brain 143, 386–390. 10.1093/brain/awaa015. - DOI - PubMed
    1. Ishai R., Seyyedi M., Chancellor A.M., McLean C.A., Rodriguez M.L., Halmagyi G.M., Nadol J.B. Jr., Szmulewicz D.J., and Quesnel A.M. (2021). The Pathology of the Vestibular System in CANVAS. Otology & Neurotology 42. - PMC - PubMed
    1. Szmulewicz D.J., Roberts L., McLean C.A., MacDougall H.G., Chancellor A.M., Mossman S., Lamont D., Storey E., and Halmagyi G.M. (2013). Clinico-pathological correlates in cerebellar ataxia with neuronopathy and vestibular areflexia syndrome (CANVAS). Journal of the Neurological Sciences 333, e632. 10.1016/j.jns.2013.07.2196. - DOI

Publication types