[Preprint]. 2024 Feb 5:2023.12.15.571947.
doi: 10.1101/2023.12.15.571947.

Epigenetic disruption of the RARγ complex impairs its function to bookmark AR enhancer interactions required for enzalutamide sensitivity in prostate cancer

Affiliations

Epigenetic disruption of the RARγ complex impairs its function to bookmark AR enhancer interactions required for enzalutamide sensitivity in prostate cancer

Sajad A Wani et al. bioRxiv. .

Abstract

The current study in prostate cancer (PCa) focused on the genomic mechanisms at the cross-roads of pro-differentiation signals and the emergence of lineage plasticity. We explored an understudied cistromic mechanism involving RARγ's ability to govern AR cistrome-transcriptome relationships, including those associated with more aggressive PCa features. The RARγ complex in PCa cell models was enriched for canonical cofactors, as well as proteins involved in RNA processing and bookmarking. Identifying the repertoire of miR-96 bound and regulated gene targets, including those recognition elements marked by m6A, revealed their significant enrichment in the RARγ complex. RARγ significantly enhanced the AR cistrome, particularly in active enhancers and super-enhancers, and overlapped with the binding of bookmarking factors. Furthermore, RARγ expression led to nucleosome-free chromatin enriched with H3K27ac, and significantly enhanced the AR cistrome in G2/M cells. RARγ functions also antagonized the transcriptional actions of the lineage master regulator ONECUT2. Similarly, gene programs regulated by either miR-96 or antagonized by RARγ were enriched in alternative lineages and more aggressive PCa phenotypes. Together these findings reveal an under-investigated role for RARγ, modulated by miR-96, to bookmark enhancer sites during mitosis. These sites are required by the AR to promote transcriptional competence, and emphasize luminal differentiation, while antagonizing ONECUT2.


Conflict of interest statement

Competing interests The authors certify that they has NO affiliations with or involvement in any organization or entity with any financial interest (such as honoraria; educational grants; participation in speakers’ bureaus; membership, employment, consultancies, stock ownership, or other equity interest; and expert testimony or patent-licensing arrangements), or non-financial interest (such as personal or professional relationships, affiliations, knowledge or beliefs) in the subject matter or materials discussed in this manuscript.

Figures

Figure 1:
Figure 1:. Graphical abstract of workflow and approaches
Figure 2.
Figure 2.. The RARγ complex in LNCaP and 22Rv1-RARγ isogenic variants.
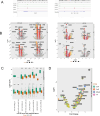
LNCaP, 22Rv1-mock, 22Rv1-RARγ and 22Rv1-RARγ-TACC1 cells were treated with CD437 (400 nM, 6h) or vehicle control in quadriplicates, and RIME analyses undertaken for RARγ in the cells and significantly different proteins were identified using an edgeR workflow to identify positively enriched proteins compared to IgG controls. A. Volcano plots depicting enrichment levels, compared to IgG controls (logPV > 1.3 & FC > .37), between the indicated cells in basal conditions. Proteins known to be associated with bookmarking functions (n=42) are indicated in salmon. B. The positively and significantly enriched proteins in each complex were analyzed by StringDB and the significantly enriched terms were grouped by the most frequently identified master terms (Chromatin, RNA Processes), and the significant terms are illustrated as waterfall plots.
Figure 3:
Figure 3:. MiR-96 bound and regulated RNAs and proteins are frequently found in the RARγ complex in 22Rv1 cells.
Non-malignant HPr1AR and LNCaP cells were treated in triplicate with 3’ biotinylated miRIDIAN miR-96 mimic or scramble control (50 nM, 24h and 48h) and IMPACT-Seq undertaken. RNA was captured from mid-exponential HPr1AR and LNCaP cells in triplicate for m6A-Seq. Briefly, csaw was used to identify differentially enriched regions of miR-96 binding sites (MREs) and m6A sites, and bedtools used to measure the overlap of m6A-MRE. Finally, HPr1AR and LNCaP cells were treated with miR-96 mimics (50nM, 48h) and RNA-Seq and Label free quantitative proteomics undertaken, and data processed with edgeR workflow to identify significant differentially enriched genes (DEGs) and differentially enriched proteins (logPV > 1.3 & absFC > .37). A. Representative genome browser views of MRE on SMARCC1 and TACC1 in HPr1AR and LNCaP cells. B. Left. Volcano plots of DEGs following miR-96 mimic treatment, and those that contained a MRE identified in the same cell background at either 24 or 48 h are shown in spectrum colors, with top 10 most significant genes labelled. Right. DETs were plotted as for DEGs. C. MRE or m6A-MRE-containing genes were classified as protein-coding or protein-coding genes containing an intronic miRNA, and the difference tested of the absolute fold change between negatively and positively-regulated targets. D. Volcano plot of significantly differentially enriched proteins from RIME data comparing 22Rv1-RARγ cells to LNCaP. Proteins were classified either as a Coactivator (CoA), Corepressor (CoR), Mixed function coregulator (Mixed) or transcription factor (TF) and whether they contained a MRE (yellow).
Figure 4:
Figure 4:. RARγ augments the shared AR and H3K27ac cistromes.
22Rv1-mock, 22Rv1-RARγ and 22Rv1-RARγ-TACC1 cells were treated with DHT (10nM), CD437(400nM) or vehicle for 6h and CUT&RUN undertaken using antibodies to either AR, GFP (for RARγ), H3K27ac or IgG in triplicate. Differential enrichment of regions compared to IgG controls (p.adj < .1) was measured with csaw. A. The mean of the log10(p.adj) of the significant peaks per cell/treatment condition are shown, and significant differences indicated. B. Motif analyses for AR, RARγ, H3K27ac cistromes was undertaken (homer) and motifs were grouped into the indicated transcription factor classes. For each motif the change in significance of enrichment was calculated across models compared to 22Rv1-mock cells treated with vehicle, from which within each class the mean delta logPval enrichment and mean percentage coverage calculated (indicated by peak width). The specific motif with the greatest delta per class is indicated. C. The genomic overlap with a minimum of 1 bp of the AR, RARγ, H3K27ac and ONECUT2 cistromes was measured between all cistrome pairs and significance determined with a Chi-squared test. From these analyses the -log10(p.adj) of the indicated overlaps was visualized as a clustered heatmap. D. The overlap of the AR, RARγ and H3K27ac cistromes with the cistrome collection in the CistromeDB was measured by GIGGLE. The change in enrichment was calculated for transcription factors and cofactors (Left) and histone modifications (Right) compared to 22Rv1-mock cells treated with vehicle. The factor with the greatest change is labelled. E. Super-enhancers were identified in the H3K27ac cistromes in the 22Rv1 variant using the ROSE algorithm also taking into account BRD4 cistrome from 22Rv1 cells as a pilot SE-enriched factor to generate high confidence sites. The Venn Diagrams indicate the number of unique and overlapping sites (minimum of 1bp) in the cells treated with either DHT of vehicle (M).
Figure 5:
Figure 5:. The role of RARγ to bookmark AR enhancers.
A. In the 22Rv1 isogenic cell variants (in different colors) there was significant shared binding of AR cistromes with bookmarking factors as determined by GIGGLE analyses. B. ATAC-Seq was undertaken in triplicate in 22Rv1 cell isogenic cell variants and ATACseqQC used to define nucleosome free regions, and differential enrichment of chromatin accessibility measured with csaw. The significantly enriched nucleosome free regions (p.adj < .1) between 22Rv1-RARγ-TACC1 and 22Rv1-Mock cells (TR.M.veh.NF) were intersected with the indicated AR and RARγ cistromes also in 22Rv1-RARγ-TACC1 cells to generate the Venn diagrams of overlapping regions by a minimum of 1bp (ChIPpeakAnno). C. 22Rv1 isogenic cell variants were treated with nocodozole (60 ng/ml, 18h) or vehicle control, which led to ~70% of cells in G2/M (labelled as “Syn”), and then treated with DHT (10nM) or vehicle for 6h and CUT&RUN undertaken using antibodies to AR, RARγ, H3S10P (as a marker of G2/M cells) or IgG in triplicate. Differential enrichment of regions compared to IgG controls (p.adj < .1) was measured with csaw and Venn diagrams generated of overlapping regions by a minimum of 1bp (ChIPpeakAnno).
Figure 6:
Figure 6:. Expression of RARγ significantly shapes the DHT and Enza-dependent transcriptomes.
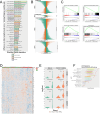
22Rv1 isogenic cell variants were treated with DHT (10nM), CD437 (400nM) or Enza (10μM) for 24h in triplicate and RNA-Seq undertaken. FASTQ files were QC processed, aligned to hg38 (Rsubread), and differentially expressed genes (DEGs)) (logPV > 1 & absFC > .37) identified with edgeR. A. Volcano plot depicting DEGs in 22Rv1 cell variants and treatments, with luminal (teal) and basal (brown) genes indicated. B. Pre-ranked gene set enrichment analysis (GSEA) was undertaken using the Hallmarks, and Chemical and Genetic Perturbations terms, and the most frequently enriched terms calculated (e.g. NRs, epigenetics and cell cycle terms). For the most frequent terms the delta normalized enrichment score (NES) between terms in either 22Rv1-RARγ or 22Rv1-RARγ-TACC1 cells compared to 22Rv1-mock cells are illustrated. C. Volcano plot depicting DEGs in 22Rv1 cells treated with Enza (10μM), miR-96 antagomir (100nM) or the combination. MiR-96 bound and regulated genes are indicated (yellow). D. GSEA analyses undertaken as B. and the most enriched terms in NRs or mitosis indicated in order of NES.
Figure 7.
Figure 7.. RARγ significantly determines AR cistrome-transcriptome relationships that are clinical significant.
A. The cistrome in each cell was overlapped with ChromHMM defined epigenetic states and annotated to DEG within 100 kb, and the peak significance was summed for each gene, with a distal weighting, and multiplied by the absolute fold change for the same DEG. This score is the weighted cistrome-transcriptome (wt-C-T). A Wilcox test was used to compare the significant differences between the wt-C-T values to the comparable values in 22Rv1-mock cells. This revealed that the most significantly impacted cistrome-transcriptome relationships were TACC1-RARγ-dependent. The name of bar refers to the cistrome first (e.g. TACC1_RARγ_AR_DHT) and then the transcriptome it is matched to (e.g. TACC1_RARγ_CD437). The direction of the bar refers to whether the genes were up or downregulated. The order refers to the most significance of change between the wt-C-T and that in 22Rv1-Mock cells. B. Antagonistic gene expression between either DHT or Enza regulated genes in 22Rv1-RARγ cells and 22Rv1-RARγ-TACC1 cells compared to gene regulation by over-expression of ONECUT2. Transcriptomic data in 22Rv1-RARγ and 22Rv1-RARγ-TACC1 cells was compared to that in 22Rv1 cells with ONECUT2 over-expression. Gene expression was defined as cooperative, if for a given gene the direction of change was the same between either DHT or Enza treatments and ONECUT2 over-expression, and antagonistic if the direction of change was opposite. The height of each panel is proportional to the number of events and indicates that in 22Rv1-RARγ-TACC1 cells there is more frequent Enza-dependent antagonism than in 22Rv1-RARγ cells. C. GSEA identified negative enrichment of E2F genes and positive enrichment of p53 genes in the Enza-regulated antagonized genes in 22Rv1-RARγ-TACC1 cells. D. In SU2C tumors (n=293) upper quartile RARγ and lower quartile ONECUT2 were compared to the opposite and differential expressed genes determined. From these ~ 3000 genes a lasso regression was used to identiffy genes that significantly associated with high/low (red/green) neuroendocrine feature. E. Partial correlation analyses in SU2C tumors between AR and RARγ-dependent AR-H3K27ac DHT regulated genes considering the impact of the indicated coregulators. The change in the correlation (delta.corr) was calculated as the difference between the Pearson correlation and Pearson partial correlations between AR and these target genes and each of the indicated coregulators. F. The miR-96 targetome of 663 MRE bound and miR-96 regulated genes were extracted from LNCaP cells to generate a ranked list. The similarity of these rank genes was compared to the ranked gene lists from the indicated experiments and similarity compared by Jaccard similarity measurements, and the significance determined by bootstrapping (n=1000). The symbols in red are significant similarity.

References

    1. Ellis L. (2017) Understanding cancer lineage plasticity: reversing therapeutic resistance in metastatic prostate cancer. Pharmacogenomics, 18, 597–600. - PubMed
    1. Pomerantz M.M., Qiu X., Zhu Y., Takeda D.Y., Pan W., Baca S.C., Gusev A., Korthauer K.D., Severson T.M., Ha G. et al. (2020) Prostate cancer reactivates developmental epigenomic programs during metastatic progression. Nat Genet, 52, 790–799. - PMC - PubMed
    1. Pomerantz M.M., Li F., Takeda D.Y., Lenci R., Chonkar A., Chabot M., Cejas P., Vazquez F., Cook J., Shivdasani R.A. et al. (2015) The androgen receptor cistrome is extensively reprogrammed in human prostate tumorigenesis. Nat Genet, 47, 1346–1351. - PMC - PubMed
    1. Lu J., Lonergan P.E., Nacusi L.P., Wang L., Schmidt L.J., Sun Z., Van der Steen T., Boorjian S.A., Kosari F., Vasmatzis G. et al. (2015) The cistrome and gene signature of androgen receptor splice variants in castration resistant prostate cancer cells. J Urol, 193, 690–698. - PMC - PubMed
    1. Chen Y., Chi P., Rockowitz S., Iaquinta P.J., Shamu T., Shukla S., Gao D., Sirota I., Carver B.S., Wongvipat J. et al. (2013) ETS factors reprogram the androgen receptor cistrome and prime prostate tumorigenesis in response to PTEN loss. Nat Med, 19, 1023–1029. - PMC - PubMed

Publication types