[Preprint]. 2023 Dec 12:2023.12.11.571166.
doi: 10.1101/2023.12.11.571166.

IGHMBP2 deletion suppresses translation and activates the integrated stress response

Affiliations

IGHMBP2 deletion suppresses translation and activates the integrated stress response

Jesslyn E Park et al. bioRxiv. .

Update in

Abstract

IGHMBP2 is a non-essential, superfamily 1 DNA/RNA helicase that is mutated in patients with rare neuromuscular diseases SMARD1 and CMT2S. IGHMBP2 is implicated in translational and transcriptional regulation via biochemical association with ribosomal proteins, pre-rRNA processing factors, and tRNA-related species. To uncover the cellular consequences of perturbing IGHMBP2, we generated full and partial IGHMBP2 deletion K562 cell lines. Using polysome profiling and a nascent protein synthesis assay, we found that IGHMBP2 deletion modestly reduces global translation. We performed Ribo-seq and RNA-seq and identified diverse gene expression changes due to IGHMBP2 deletion, including ATF4 upregulation. With recent studies showing the ISR can contribute to tRNA metabolism-linked neuropathies, we asked whether perturbing IGHMBP2 promotes ISR activation. We generated ATF4 reporter cell lines and found IGHMBP2 knockout cells demonstrate basal, chronic ISR activation. Our work expands upon the impact of IGHMBP2 in translation and elucidates molecular mechanisms that may link mutant IGHMBP2 to severe clinical phenotypes.

Keywords: ATF4; CMT2S; IGHMBP2; SMARD1; integrated stress response.


Conflict of interest statement

COMPETING INTEREST STATEMENT The authors declare no competing interests.

Figures
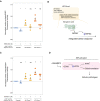
Figure 1.
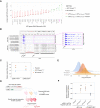
Figure 1.. IGHMBP2 deletion decreases proliferation of cells.
(A) Cas9-mediated IGHMBP2 deletion in K562 CRISPRi cells. (B) Sanger sequencing of gDNA surrounding IGHMBP2 exon 2 cut-site in clones screened for indels via PCR. sgRNA guide sequences used to dually target Cas9 are indicated in purple. (C) Western blot of IGHMBP2 expression in clones depicted in B, validating reduced IGHMBP2 protein levels in HET Clones #1 and #2 and full deletion in KO Clones #1 and #2. (D) Forward-scatter width medians between cell lines with differential IGHMBP2 expression normalized to the median FSC.W of parental cells per day of measurement. (E) Competitive proliferation profiles between AIGHMBP2 cell lines stably expressing mEGFP seeded with 50% non-fluorescent parental cells. Each sample was seeded in triplicate on Day 0 and independently passaged on each day of measurement. Error bars reflect the coefficient of variation mEGFP+ populations normalized to the mean Day 1 reading among triplicate wells per sample.
Figure 2.
Figure 2.. IGHMBP2 deletion reduces global translation in cells.
(A) Representative polysome profiles from parental K562 CRISPRi (blue) and IGHMBP2 KO Clone (yellow). (B) Western blot of fractions of the polysome profile in A. (C) Area under the curve (AUC) quantification of polysome profiles, where n = 5 for parental samples and n = 7 for IGHMBP2 deletion clone samples collected from separate flasks and measured across 3 different days. Unpaired, two-tailed, two-sample t-test between parental and KO samples per AUC ratios shown was performed to determine significance, and error bars represent standard error of the mean (SEM). (D) Representative OP-Puro (OPP) levels of cell lines used in this study quantified via flow cytometry, which was performed in 3 independent experiments with either AlexaFluor 647 as shown or AlexaFluor 594 (Fig. S2) (E) OPP assay results using cell lines expressing mEGFP only. Values beyond 2.5 standard deviations (SD) from the mean of all data points were considered outliers omitted in statistical measurement (SD = 2.6 for single outlier in HET clone; unfilled). (F) Relative mEGFP expression in samples from E. For E and F, n = 3, where n represents median fluorescence of single-cell intensities normalized to the median fluorescence of parental cells from experiments on 3 separate days. Horizontal black lines per each sample represent the mean, and error bars are SEM. Median values were derived from at least 10,000 cells measured by flow cytometry. Unpaired t-test was performed to determine significance. For B and F, ns: p ≥ 0.05, *: p ≤ 0.05.
Figure 3.
Figure 3.. IGHMBP2 loss alters translation of diverse mRNAs.
(A) Ribosome profiling versus RNA-seq-derived shrunken log2 (Fold Change) (L2FC) per gene in clones with partial or full IGHMBP2 deletion compared to parental cells. Differential expression (DE) analysis was performed using Wald test, and p-values were adjusted (p.adj) via Benjamini-Hochberg method. Cut-offs used for DE classifications are p.adj <0.01 for ΔRNA-seq (pink, green, and orange), and p.adj <0.05 for ΔRibo-seq (green & violet) and Atranslation efficiency (ΔTE; blue, violet, and orange). Genes with ΔTE across all clones were identified via likelihood ratio test against the Ribo:RNA-seq interaction term across all samples. Genes of both ΔTE and ΔRibo-seq are identified as translation exclusive (violet). Genes of ΔTE and ΔRNA-seq are classified as translation buffered (orange). The number of DEGs (nDEG) are shown per cell line. (B)Top 10 up versus down-regulated gene set enrichments (GSE) using ranked DEGs from RNA-seq and (C) Ribo:RNA-seq. GS labels are pink or orange if expression trends between B and C are opposing positively or negatively, respectively. (D) Enrichment network map of GSEA with Ribo-seq reads. In B, C, and D, GSEA was computed using the Biological Processes ontology; min GS size = 25, max GS size = 1,000 with 100,000 permutations. (E) Overview of physiological impact of IGHMBP2 disruption.
Figure 4.
Figure 4.. ATF4 is upregulated in IGHMBP2 deletion cells.
(A) Average L2FC of a subset of ATE DE genes in heterozygous and full deletion clones relative to parental cells. DE genes were filtered to represent those of <10% FC in heterozygous IGHMBP2 cells, where L2FC in HET clones were intermediate relative to KO results. (B) Mapped reads normalized to counts per million surrounding the 5′-UTR of ATF4. (C) Quantification of reads aligning to either of the two uORFs in ATF4 in the parental, HET clones, and KO clones. Each dot represents the average scaled count per clones between two replicates. (D) Schematic of ATF4 reporter system. Transcription of lenti- virally-integrated mApple and GFP reporter constructs is driven by separate CMV promoters. An ISR-sensitive, synthetic 5′-UTR encoding two uORFs (derived from ATF4) is upstream of the mApple ORF. (E) uORF1,2(ATF4)-mApple expression normalized to promoter and translational activity (mEGFP) in AIGHMBP2 K562 reporter cell lines. (F) Relative median mApple/mEGFP intensities among reporter cell lines expressing BFP or IGHMBP2-BFP. Single-cell mApple/mEGFP signals were normalized to the median mApple/mEGFP of parental cells from 3 different days (n = 3). Median values were derived from at least 10,000 cells measured by flow cytometry. Unpaired t-test was performed to determine significance (ns: p ≥ 0.05, *:p ≤ 0.05, **: p ≤ 0.01).
Figure 5.
Figure 5.. The ISR is activated in IGHMBP2 deletion cells.
(A) Relative median mApple/mEGFP fluorescence intensities among reporter cell lines treated with 500 nM ISRIB for 24 hr, where single-cell mApple/mEGFP signals were normalized to the median mApple/mEGFP of untreated (DMSO only) parental cells. (B) Schematic of GCN2-mediated ISR activation. (C) Relative median mApple/mEGFP fluorescence intensities among reporter cell lines treated with 1 μM GCN2iB for 24 hr, normalized as described in A. For A and D, n=4 where n reflects results from separate experiments performed on different days, and error bars represent SEM. Unpaired t-test was performed to determine significance (ns: p ≥ 0.05, *: p ≤ 0.05, **: p ≤ 0.01). (D) A model of how IGHMBP2 deletion results in chronic ISR activation.

Similar articles

References

    1. Bohnsack KE, Yi S, Venus S, Jankowsky E, Bohnsack MT. 2023. Cellular functions of eukaryotic RNA helicases and their links to human diseases. Nat Rev Mol Cell Biol 24: 749–769. - PubMed
    1. Calviello L, Venkataramanan S, Rogowski KJ, Wyler E, Wilkins K, Tejura M, Thai B, Krol J, Filipowicz W, Landthaler M, et al. 2021. DDX3 depletion represses translation of mRNAs with complex 5′ UTRs. Nucleic Acids Res 49: gkab287-. - PMC - PubMed
    1. Chothani S, Adami E, Ouyang JF, Viswanathan S, Hubner N, Cook SA, Schafer S, Rackham OJL. 2019. deltaTE: Detection of Translationally Regulated Genes by Integrative Analysis of Ribo‐seq and RNA‐seq Data. Curr Protoc Mol Biology 129: e108. - PMC - PubMed
    1. Costa-Mattioli M, Walter P. 2020. The integrated stress response: From mechanism to disease. Science 368. - PMC - PubMed
    1. Cottenie E, Kochanski A, Jordanova A, Bansagi B, Zimon M, Horga A, Jaunmuktane Z, Saveri P, Rasic VM, Baets J, et al. 2014. Truncating and Missense Mutations in IGHMBP2 Cause Charcot-Marie Tooth Disease Type 2. Am J Hum Genetics 95: 590–601. - PMC - PubMed

Publication types