[Preprint]. 2024 Jun 8:2023.11.13.566502.
doi: 10.1101/2023.11.13.566502.

3D Mitochondrial Structure in Aging Human Skeletal Muscle: Insights into MFN-2 Mediated Changes

Affiliations

3D Mitochondrial Structure in Aging Human Skeletal Muscle: Insights into MFN-2 Mediated Changes

Estevão Scudese et al. bioRxiv. .

Update in

  • 3D Mitochondrial Structure in Aging Human Skeletal Muscle: Insights Into MFN-2-Mediated Changes.
    Scudese E, Marshall AG, Vue Z, Exil V, Rodriguez BI, Demirci M, Vang L, López EG, Neikirk K, Shao B, Le H, Stephens D, Hall DD, Rostami R, Rodman T, Kabugi K, Shao JQ, Mungai M, AshShareef ST, Hicsasmaz I, Manus S, Wanjalla CN, Whiteside A, Dasari R, Williams CR, Damo SM, Gaddy JA, Glancy B, Dantas EHM, Kinder A, Kadam A, Tomar D, Scartoni F, Baffi M, McReynolds MR, Phillips MA, Cooper A, Murray SA, Quintana AM, Wandira N, Ochayi OM, Ameka M, Kirabo A, Masenga SK, Harris C, Oliver A, Martin P, Gaye A, Korolkova O, Sharma V, Mobley BC, Katti P, Hinton A. Scudese E, et al. Aging Cell. 2025 Jul;24(7):e70054. doi: 10.1111/acel.70054. Epub 2025 Apr 25. Aging Cell. 2025. PMID: 40285369 Free PMC article.

Abstract

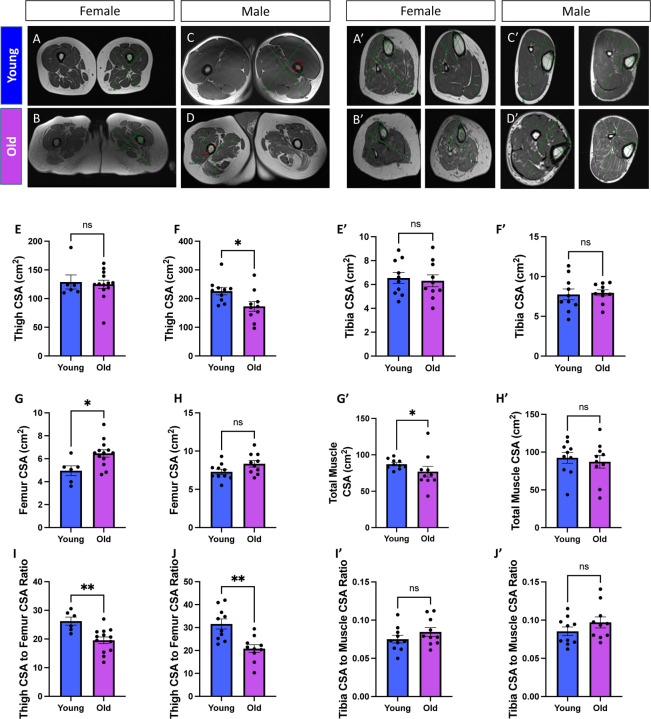
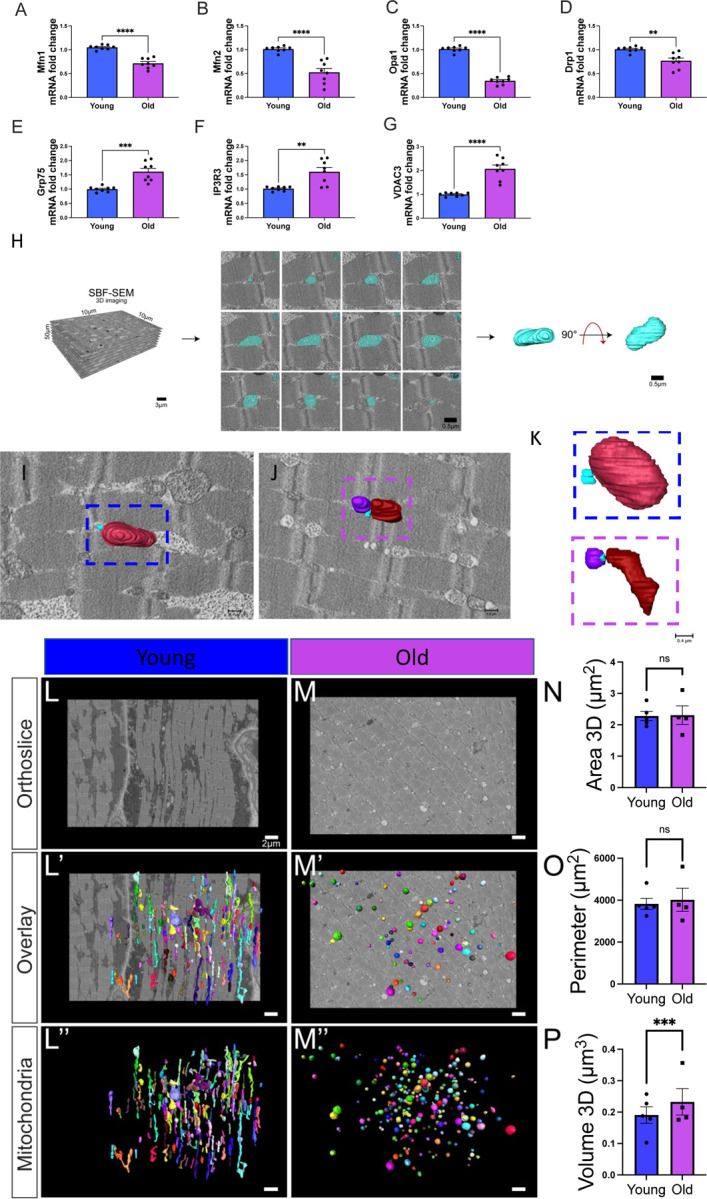
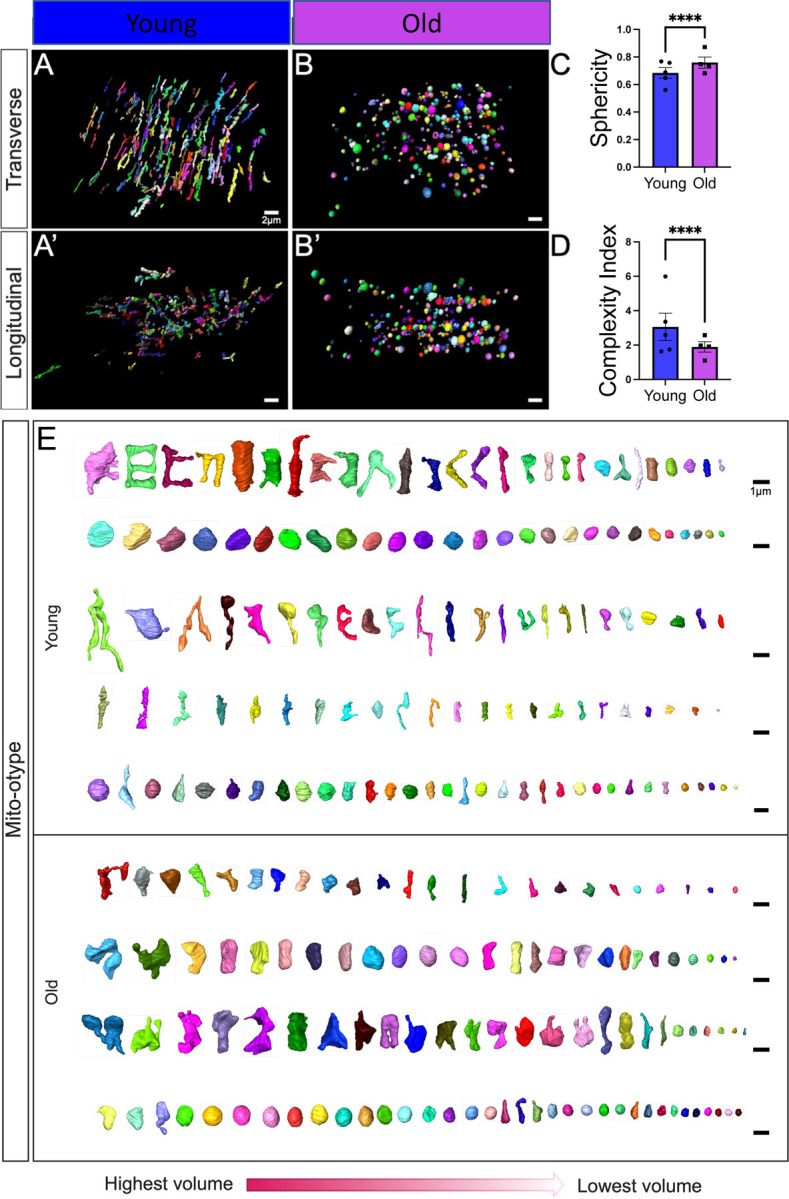
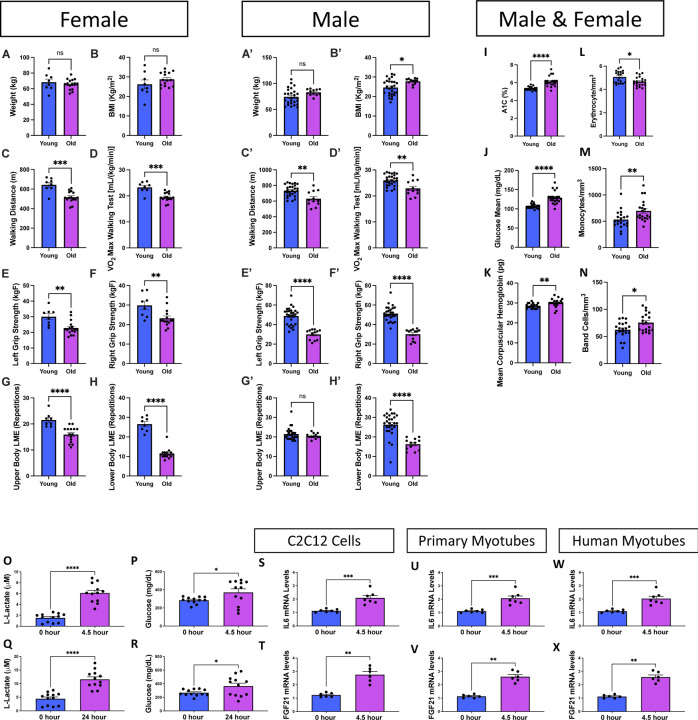
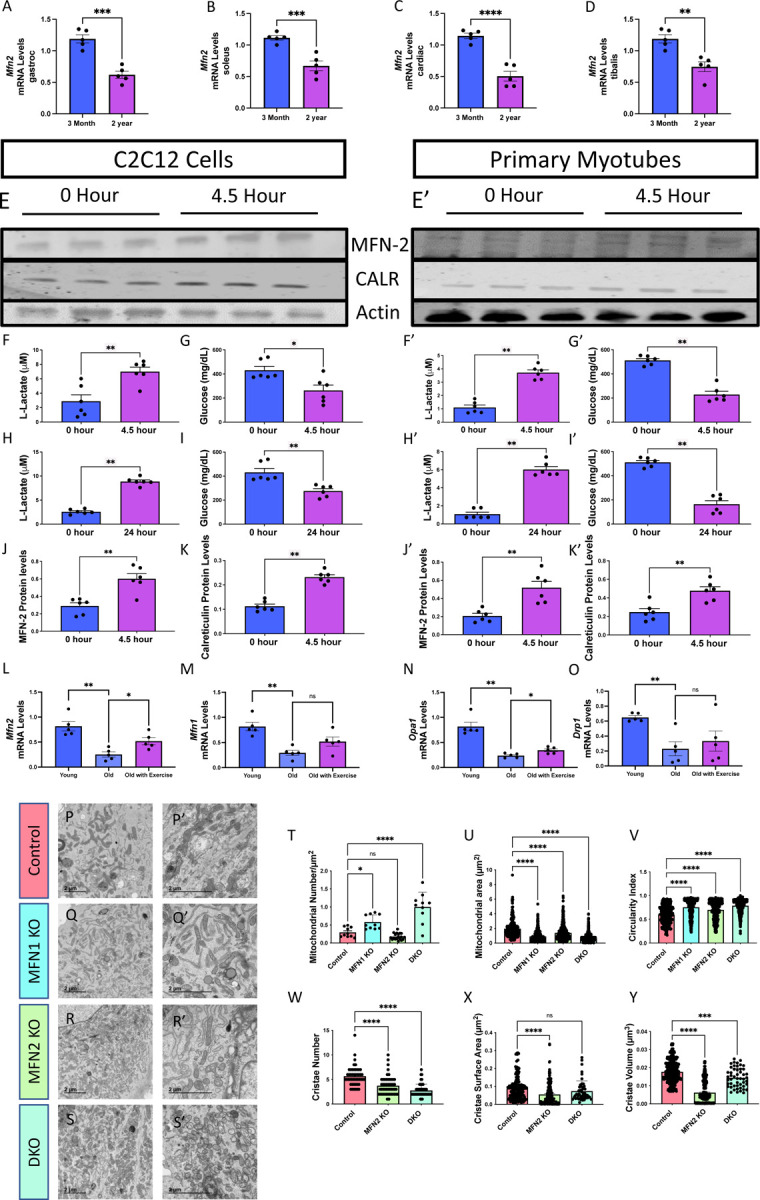
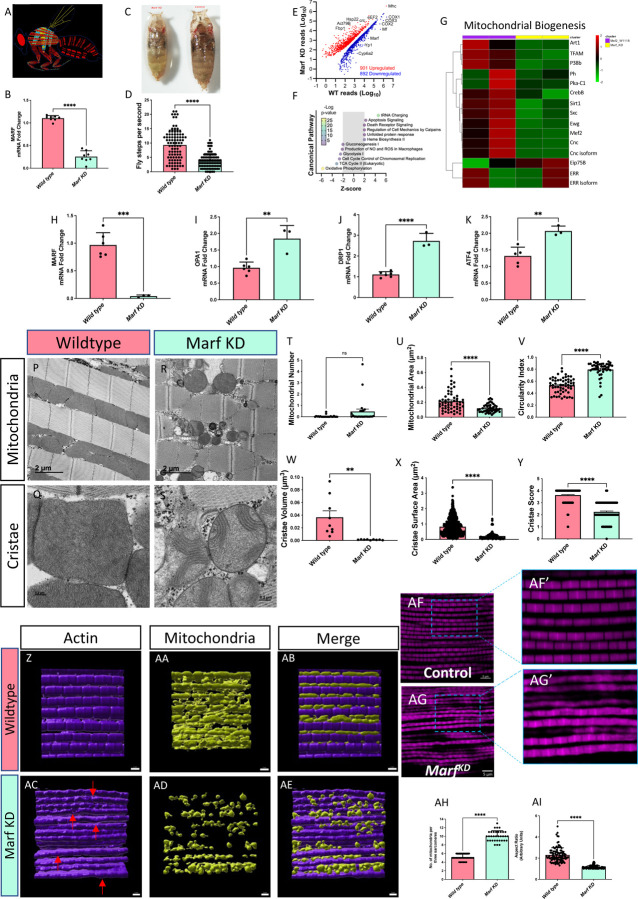
Age-related atrophy of skeletal muscle, is characterized by loss of mass, strength, endurance, and oxidative capacity during aging. Notably, bioenergetics and protein turnover studies have shown that mitochondria mediate this decline in function. Although exercise has been the only therapy to mitigate sarcopenia, the mechanisms that govern how exercise serves to promote healthy muscle aging are unclear. Mitochondrial aging is associated with decreased mitochondrial capacity, so we sought to investigate how aging affects mitochondrial structure and potential age-related regulators. Specifically, the three-dimensional (3D) mitochondrial structure associated with morphological changes in skeletal muscle during aging requires further elucidation. We hypothesized that aging causes structural remodeling of mitochondrial 3D architecture representative of dysfunction, and this effect is mitigated by exercise. We used serial block-face scanning electron microscopy to image human skeletal tissue samples, followed by manual contour tracing using Amira software for 3D reconstruction and subsequent analysis of mitochondria. We then applied a rigorous in vitro and in vivo exercise regimen during aging. Across 5 human cohorts, we correlate differences in magnetic resonance imaging, mitochondria 3D structure, exercise parameters, and plasma immune markers between young (under 50 years) and old (over 50 years) individuals. We found that mitochondria we less spherical and more complex, indicating age-related declines in contact site capacity. Additionally, aged samples showed a larger volume phenotype in both female and male humans, indicating potential mitochondrial swelling. Concomitantly, muscle area, exercise capacity, and mitochondrial dynamic proteins showed age-related losses. Exercise stimulation restored mitofusin 2 (MFN2), one such of these mitochondrial dynamic proteins, which we show is required for the integrity of mitochondrial structure. Furthermore, we show that this pathway is evolutionarily conserved as Marf, the MFN2 ortholog in Drosophila, knockdown alters mitochondrial morphology and leads to the downregulation of genes regulating mitochondrial processes. Our results define age-related structural changes in mitochondria and further suggest that exercise may mitigate age-related structural decline through modulation of mitofusin 2.

Keywords: 3D Reconstruction; Aging; Exercise; Human Skeletal Muscle; MFN2; Mitochondria.


Conflict of interest statement

Competing Interests Disclosure All authors have no competing interests.

Figures

Figure 1.
Figure 1.. Comparative Analyses of Musculoskeletal Characteristics in Young and Old Participants Differentiated by Sex.
(A-G) Cross-sectional imaging of thigh musculature and skeletal anatomy data from (A) females under 50 years old (aged 8–41 years old; n = 7), (B) females over 50 years old (aged 57–79 years old; n = 13), (C) males under 50 years old (aged 19–48 years old; n = 10), and (D) males over 50 years old (aged 67–85 years old; n = 10). (E) Thigh cross-sectional area (CSA) measurements for females and (F) males, with data for young and old participants represented by blue and purple bars, respectively. (G) Femur CSA measurements for females and (H) males. (I) Ratio of thigh CSA and femur CSA for females and (J) males. Individual data points indicating separate individuals (Supplemental File 1) are represented by dots on the bar graphs. (A’-G’) Cross-sectional imaging of calf musculature and skeletal anatomy data from (A’) females under 50 years old (aged 15–48 years old; n = 10), (B’) females over 50 years old (aged 54–82 years old; n = 10), (C’) males under 50 years old (aged 22–49 years old; n = 10), and (D’) males over 50 years old (aged 51–81 years old; n = 10). (E’) Tibia cross-sectional area (CSA) measurements for females and (F’) males, with data for young and old participants represented by blue and purple bars, respectively. (G’) Total muscle of calf CSA measurements for females and (H’) males. (I’) Ratio of tibia CSA to calf CSA for females and (J’) males. Individual data points indicating separate individuals (Supplemental File 2) are represented by dots on the bar graphs. Mann–Whitney tests were used for statistical analysis. Statistical significance is denoted as ns (not significant), *p < 0.05, and **p < 0.01.
Figure 2.
Figure 2.. Changes in Mitochondrial Dynamics and Structure with Aging in Human Skeletal Muscle.
(A–D) Quantified differences in mRNA fold changes, as determined by quantitative PCR, of various mitochondrial dynamic proteins and (E–G) mitochondrial–endoplasmic reticulum contact site proteins. Parameters are compared between the young and old groups (n=8 for both). (H) Workflow of serial block-face scanning electron microscopy (SBF-SEM) manual contour reconstruction to recreate 3D mitochondrial structure from young and old human samples. The workflow depicts SBF-SEM, allowing for orthoslice alignment, subsequent manual segmentation of orthoslices, and ultimately, 3D reconstructions of mitochondria. (I) Qualitative image of mitochondrial–endoplasmic reticulum contact sites in young and (J) old cohorts, with (K) specific contact sites magnified for viewing. Blue structures represent the endoplasmic reticulum. (L) Differences in orthoslice mitochondrial structure between young and (M) old human skeletal muscle, with a scale bar of 2 μm. (L’) Overlaid view of the segmented mitochondria on the orthoslice, emphasizing distinct mitochondrial shapes and distributions observed with 3D reconstruction in young and (M’) older participants. (L’’) 3D reconstructed images of isolated mitochondria from young and (M’’) older participants. (N) Differences in mitochondrial area, (O) mitochondrial perimeter, and (P) volume between the young and old groups. (A–G) Each dot represents an independent experimental run or (N-P) average of all mitochondria quantifications in each patient. 5 young individuals surveyed (mitochondrial number varies; Case #1: n = 253; Case #2: n = 250; Case #3: n = 250; Case #4: n = 252; Case #5: n = 253; total mitochondria surveyed across young cohort: n = 1258) and 4 old cases (mitochondrial number varies; Case #1: n = 254; Case #2: n = 250; Case #3: n = 250; Case #4: n = 250; total mitochondria surveyed across old cohort: n = 1004) for 3D reconstruction. Significance was determined with the Mann–Whitney test comparing the combined number of mitochondria in young (n = 1258) and old (n = 1004) cohorts, , with ns, *, **, ***, and **** representing not significant, p ≤ 0.05, p ≤ 0.01, p ≤ 0.001, and p ≤ 0.0001.
Figure 3.
Figure 3.. Changes in Mitochondrial Branching and Networking after Aging Revealed by Serial Block-face Scanning Electron Microscopy.
(A) 3D reconstructions showing young and (B) old human skeletal muscle from a transverse point of view. (A’) 3D reconstructions showing young and (B’) old human skeletal muscle from a longitudinal point of view. (C) Sphericity of mitochondria in the young and old groups. (D) The mitochondrial complexity index (MCI), which is analogous to sphericity, was used to compare the young and old groups. (E) Mito-otyping was used to display the diversity of mitochondrial phenotypes, as ordered by volume, to show the mitochondrial distribution in the young and old groups, with each row representing an independent patient. Each dot represents the average of all mitochondria quantifications in each patient. 5 young individuals surveyed (mitochondrial number varies; Case #1: n = 253; Case #2: n = 250; Case #3: n = 250; Case #4: n = 252; Case #5: n = 253; total mitochondria surveyed across young cohort: n = 1258) and 4 old cases (mitochondrial number varies; Case #1: n = 254; Case #2: n = 250; Case #3: n = 250; Case #4: n = 250; total mitochondria surveyed across old cohort: n = 1004) for 3D reconstruction. Significance was determined with the Mann–Whitney test comparing the combined number of mitochondria in young (n = 1258) and old (n = 1004) cohorts, with **** representing p ≤ 0.0001.
Figure 4.
Figure 4.. Aging Changes Exercise Parameters Associated with Immune Modulatory Functions.
Exercise data from (A–H) females under 50 years old (aged 21–26 years; n = 8), females over 50 years old (aged 60–73 years; n = 15), (A’–H’) males under 50 years old (aged 19–35 years; n = 27), and males over 50 years old (aged 63–76 years; n = 12). Blue bars represent young individuals, and purple bars represent older individuals. (A–B) Plots detailing weight and body mass index distribution of females and (A’–B’) of young and old individuals, (C–C’) walking distances (in meters), and (D–D’) VO2 max values during a walking test among the same groups. (E–F) Scatter box plots for grip strength in kg. (E) Left grip strength and (F) right grip strength for females and (E’–F’) males. (G–H) Plots representing localized muscle endurance (G) of the lower body and (H) the upper body across females and (G’–H’) males. (I–N) Molecular and physiological measurements from the plasma of male and female participants; the full analysis is shown in Supplemental Figure 4. (I) Glycated hemoglobin (A1C) percentage levels in young and old participants. (J) Glucose concentration levels, presented in milligrams per deciliter (mg/dl), in young and old participants. (K) Average concentration of hemoglobin in a given volume of packed red blood cells, known as the mean corpuscular hemoglobin (MCH), measured in picograms (pg) for both age groups. (L) Erythrocyte (red blood cell) count measured in millions per cubic millimeter (mm3) for young and old participants. (M) Monocyte count, depicted as cells per cubic millimeter (cells/mm3), for young and old participants. (N) Band cell (immature white blood cell) count measured in cells/mm3 for young and old participants. (O) In vitro exercise stimulation in human myotubes with L-lactate and (P) glucose quantification after 4.5 and (Q–R) 24 hours. IL6 mRNA levels, as determined by quantitative PCR, are shown for (S) C2C12 cells, (U) primary myotubes, and (W) human myotubes. FGF21 mRNA levels, as determined by quantitative PCR, are shown for (T) C2C12 cells, (V) primary myotubes, and (X) human myotubes. Each dot represents an individual patient (Supplemental File 2) or experimental run. Significance was determined with the Mann–Whitney test, with **** representing p ≤ 0.0001.
Figure 5.
Figure 5.. Mitofusin 2 (MFN2) Expression Changes in Response to Exercise and Aging and Changes in Mitochondrial Morphology.
(A) Bar graphs show the mRNA levels (n=5), as determined by quantitative PCR, of Mfn2 at two distinct time points, 3 months and 2 years, from murine soleus tissue, (B) gastrocnemius tissue, (C) the tibialis, and (D) cardiac tissue. (E) Western blot analysis of MFN2, calreticulin (CALR), and actin protein levels in C2C12 cells and (E’) primary myotubes after in vitro exercise stimulation at two-time intervals, 0 and 4.5 hours. (F–G) Quantitative analysis of lactate and glucose levels in C2C12 cells and (F–G’) primary myotubes after in vitro exercise stimulation for 4.5 hours. (H–I) Quantitative analysis of lactate and glucose levels in C2C12 cells and (H–I’) primary myotubes after in vitro exercise stimulation for 24 hours. (J) Quantification of MFN2 protein levels, normalized to actin levels, after 4.5 hours of in vitro exercise stimulation in C2C12 cells and (J’) primary myotubes. (K) Quantification of CALR protein levels, normalized to actin levels, after 4.5 hours of in vitro exercise stimulation in C2C12 cells and (K’) primary myotubes. (L) Bar graphs show the mRNA levels (n = 5), as determined by quantitative PCR, of Mfn2, (M) Mfn1, (N) Opa1, and (O) in Drp1 mRNA transcripts in a distinct group of young humans (under 50 years old), old humans who do not report regular exercise of 2–3 sessions per week (over 50 years old), and old humans who regularly report life-long regular exercise of 2–3 sessions per week (over 50 years old). (P–S’) Transmission electron microscopy (TEM) images from murine-derived skeletal muscle myotubes highlighting mitochondrial morphology under different conditions: (P–P’) control, (Q-Q’) Mitofusin 1 knockout (MFN1 KO), (R–R’) Mitofusin 2 knockout (MFN2 KO), and (S–S’) double knockout (DKO). (T–U) Quantitative representation of (T) mitochondrial number average per cell, (U) mitochondrial area, and (V) mitochondrial circularity in cells under control, MFN1 KO, and MFN2 KO conditions. (W–Y) Quantitative representation of (W) cristae number, (X) cristae volume, and (Y) cristae surface area in cells under control, MFN1 KO, and MFN2 KO conditions. Each dot represents an individual mitochondrion for TEM data with variable sample number [mitochondrial number: n = ~10; mitochondrial area: n = 296 (Control), 583 (MFN1 KO), 466 (MFN2 KO), and 999 (DKO); circularity index: n = 296 (Control), 583 (MFN1 KO), 466 (MFN2 KO), and 999 (DKO); cristae score: n = ~50; cristae surface area: n = 192 (control), 192 (MFN2 KO), and 50 (DKO); cristae volume: n = 432 (control), 432 (MFN2 KO), and 50 (DKO)]. Intergroup comparisons were performed using either (A-K’) Mann–Whitney test or (L-Y) one-way ANOVA with Dunnett’s multiple comparisons test post hoc. Statistical significance is denoted as ns (not significant), *p < 0.05, **p < 0.01, ***p < 0.001, or ****p < 0.0001.
Figure 6.
Figure 6.. Comparative Analysis of the Impact of Mitochondrial Assembly Regulatory Factor Knockdown (Marf KD) on Mitochondrial Biogenesis and Cellular Features.
(A) Schematic representation of the study organism, highlighting specific anatomical regions of flight muscle. (B) Validation of Marf KD through mRNA fold changes, as determined by quantitative PCR (n=8). (C) Visual comparison of wild-type (left) and Marf KD (right) organisms. (D) Fly step quantity changes between wild-type and Marf KD organisms highlight functional differences (n=90). (E) Scatter plot comparing RNA-sequencing reads between wild-type and Marf KD muscles showing differentially expressed genes, with upregulated genes in red and downregulated genes in blue. Select genes are indicated. (F) IPA results for enriched Canonical Pathway terms with an absolute activation Z-score > 2. (G) Heatmap displaying genes related to mitochondrial biogenesis, with gradient colors representing altered expression levels in Marf KD animals compared with controls. The full list of gene names corresponding to FlyBase IDs is available in Supplemental File 3. (H–I) Molecular evaluation of wild-type (n=6) and Marf KD (n=3) organisms according to mRNA fold change, as determined by quantitative PCR of fold changes in (H) Marf, (I) OPA1, (J) DRP1, and (K) ATF4. (P–Q) Transmission electron microscopy images of wild-type flight muscle: (P) longitudinal section and (Q) cross-section. (R–S) Transmission electron microscopy images of Marf KD flight muscle: (R) longitudinal section and (S) cross-section. (T) Quantification of mitochondrial number in the region of interest (n=24), (U) mitochondrial area [n=57 (Wild type) and 45 (Marf KD)], and (V) circularity index in both conditions [n=57 (Wild type) and 45 (Marf KD)]. (W) Quantification of cristae volume (n=9), (X) cristae surface area [n=1089 (Wild type) and 82 (Marf KD)], and (Y) cristae score [n=138 (Wild type) and 120 (Marf KD)], in wild-type and Marf KD mitochondria. (Z-AE) Imaris reconstruction of (Z) actin, (AA) mitochondria, and (AB) merged 3D reconstruction in wildtype and (AC-AE) Marf KD. Red arrows denote bending or curving of actin regions of interest. (AF) Immunofluorescence of actin staining in wildtype and (AG) Marf KD, (AF’-AG’) with specific changes in actin magnified. (AH) Quantitation of the number of mitochondria per sarcomere in Drosophila flight muscle (n=~30) and (AI) aspect ratio (ratio of the major axis to the minor axis; n=~100). (H–K) Each dot represents an independent experimental run or (T–Y; AH–AI) individual mitochondrion values. Significance was determined with the Mann–Whitney test, with ns, *, **, ***, and **** representing not significant, p ≤ 0.05, p ≤ 0.01, p ≤ 0.001, and p ≤ 0.0001.

References

    1. Anon (2021) Hemoglobin induces oxidative stress and mitochondrial dysfunction in oligodendrocyte progenitor cells. Translational Research 231, 13–23. - PMC - PubMed
    1. Anon Human muscular mitochondrial fusion in athletes during exercise. Available at: 10.1096/fj.201900365RR [Accessed October 24, 2023]. - DOI - PubMed
    1. Axelrod CL, Fealy CE, Mulya A & Kirwan JP (2019) Exercise training remodels human skeletal muscle mitochondrial fission and fusion machinery towards a pro-elongation phenotype. Acta Physiologica 225, e13216. - PMC - PubMed
    1. Baar K, Wende AR, Jones TE, Marison M, Nolte LA, Chen M, Kelly DP & Holloszy JO (2002) Adaptations of skeletal muscle to exercise: rapid increase in the transcriptional coactivator PGC-1. FASEB J 16, 1879–1886. - PubMed
    1. Bartsakoulia M, Pyle A, Troncoso-Chandía D, Vial-Brizzi J, Paz-Fiblas MV, Duff J, Griffin H, Boczonadi V, Lochmüller H, Kleinle S, Chinnery PF, Grünert S, Kirschner J, Eisner V & Horvath R (2018) A novel mechanism causing imbalance of mitochondrial fusion and fission in human myopathies. Human Molecular Genetics 27, 1186–1195. - PMC - PubMed

Publication types