[Preprint]. 2023 Dec 14:rs.3.rs-3683989.
doi: 10.21203/rs.3.rs-3683989/v1.

Transgelin 2 guards T cell lipid metabolic programming and anti-tumor function

Affiliations

Transgelin 2 guards T cell lipid metabolic programming and anti-tumor function

Sung-Min Hwang et al. Res Sq. .

Update in

  • Transgelin 2 guards T cell lipid metabolism and antitumour function.
    Hwang SM, Awasthi D, Jeong J, Sandoval TA, Chae CS, Ramos Y, Tan C, Marin Falco M, Salvagno C, Emmanuelli A, McBain IT, Mishra B, Ivashkiv LB, Zamarin D, Cantillo E, Chapman-Davis E, Holcomb K, Morales DK, Yu X, Rodriguez PC, Conejo-Garcia JR, Kaczocha M, Vähärautio A, Song M, Cubillos-Ruiz JR. Hwang SM, et al. Nature. 2024 Nov;635(8040):1010-1018. doi: 10.1038/s41586-024-08071-y. Epub 2024 Oct 23. Nature. 2024. PMID: 39443795

Abstract

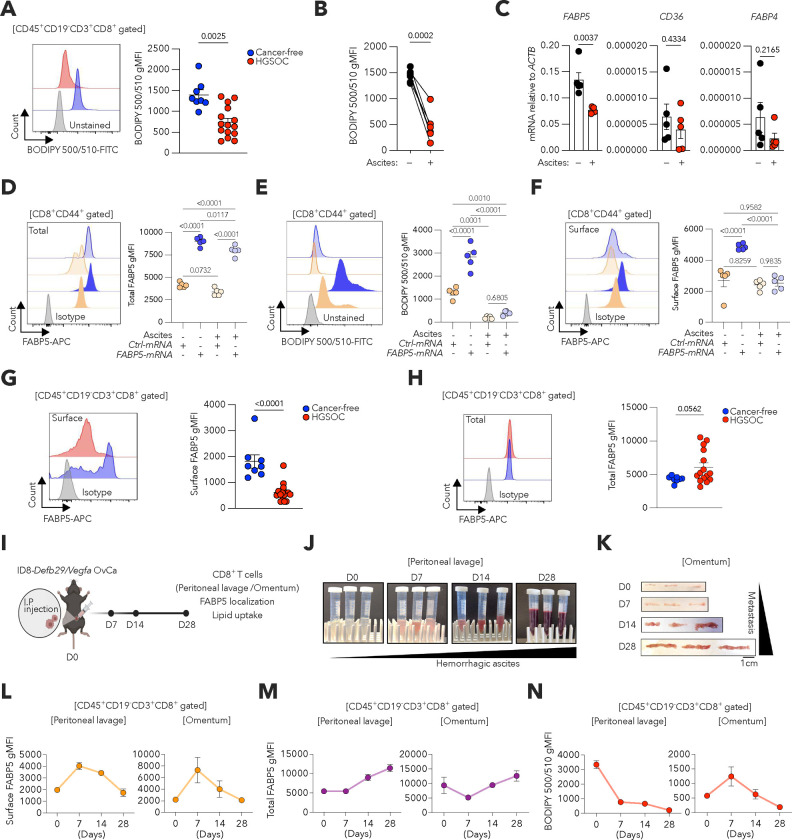
Mounting effective immunity against pathogens and tumors relies on the successful metabolic programming of T cells by extracellular fatty acids1-3. During this process, fatty-acid-binding protein 5 (FABP5) imports lipids that fuel mitochondrial respiration and sustain the bioenergetic requirements of protective CD8+ T cells4,5. Importantly, however, the mechanisms governing this crucial immunometabolic axis remain unexplored. Here we report that the cytoskeletal organizer Transgelin 2 (TAGLN2) is necessary for optimal CD8+ T cell fatty acid uptake, mitochondrial respiration, and anti-cancer function. We found that TAGLN2 interacts with FABP5, enabling the surface localization of this lipid importer on activated CD8+ T cells. Analysis of ovarian cancer specimens revealed that endoplasmic reticulum (ER) stress responses elicited by the tumor microenvironment repress TAGLN2 in infiltrating CD8+ T cells, enforcing their dysfunctional state. Restoring TAGLN2 expression in ER-stressed CD8+ T cells bolstered their lipid uptake, mitochondrial respiration, and cytotoxic capacity. Accordingly, chimeric antigen receptor T cells overexpressing TAGLN2 bypassed the detrimental effects of tumor-induced ER stress and demonstrated superior therapeutic efficacy in mice with metastatic ovarian cancer. Our study unveils the role of cytoskeletal TAGLN2 in T cell lipid metabolism and highlights the potential to enhance cellular immunotherapy in solid malignancies by preserving the TAGLN2-FABP5 axis.


Conflict of interest statement

COMPETING INTERESTS / DISCLOSURES J.R.C.-R. holds patents on the use immune modulators for OvCa treatment and serves as scientific consultant for Moderna, Immagene B.V., and Autoimmunity Biologic Solutions, Inc. D.Z. reports institutional grants from Merck, Genentech, AstraZeneca, Plexxikon, and Synthekine, and personal fees from AstraZeneca, Xencor, Memgen, Takeda, Synthekine, Immunos, Tessa Therapeutics, Miltenyi, and Calidi Biotherapeutics. D.Z. owns a patent on use of oncolytic Newcastle Disease Virus for cancer therapy. J.R.C.-G. has stock options in Compass Therapeutics, Anixa Biosciences, and Alloy Therapeutics; receives licensing fees from Anixa Biosciences for the patent of FSHCER T cells; receives honorarium from Alloy Therapeutics; and intellectual property with Compass Therapeutics and Anixa Biosciences; and is co-founder of Cellepus Therapeutics, a company that develops allogeneic gamma/delta CAR T cells. All other authors declare no potential conflicts of interest.

Figures

Extended Data Figure 1.
Extended Data Figure 1.. Assessment of FABP5 localization in activated human and mouse CD8+ T cells.
a, Scheme illustrating the different strategies to detect cell surface or total (surface + intracellular) FABP5 protein expression in activated CD8+ T cells from both human and mouse. Representative FACS histograms depict FABP5 staining, with gray peaks representing isotype controls. b,c, Representative histograms and quantitative analysis of cell surface (b) and total (c) levels of FABP5 protein expression determined by FACS in gated CD8+CD44+ T cells from WT or Fabp5 knockout (KO) mice (n = 4 per genotype). Data are presented as mean ± s.e.m. b,c, Two-tailed unpaired Student’s t-test. P<0.05 is considered to be statistically significant and exact P-values are shown. The ‘n’ values represent biologically independent samples. gMFI, Geometric mean fluorescence intensity.
Extended Data Figure 2.
Extended Data Figure 2.. Characterization of mice lacking TAGLN2 in T cells and analysis of lipid uptake in Fabp5-silenced CD8 T cells overexpressing Tagln2.
a, Representative histograms and quantitative analysis of TAGLN2 protein expression in B cells (CD3CD19+), natural killer (NK) cells (CD3NK1.1+), dendritic cells (CD3CD11c+MHCll+) and macrophages (CD3CD11b+F4/80+) in the spleen and peripheral lymph nodes of Tagln2f/f or Tagln2f/f Cd4cre mice (n = 3 per genotype). b, Representative FACS plots and quantitative analysis of double negative (CD4CD8), double positive (CD4+CD8+), or single positive (CD4+ or CD8+) thymocytes frequencies in the thymus (n = 5 per genotype). c, Representative FACS plots and quantitative analysis of CD3+CD4+ or CD3+CD8+ T cell frequencies in the spleen (left) and peripheral lymph nodes (right) (n = 5 per genotype). d,e, Expression of CD44 and CD62L on CD3+CD4+ (d) and CD3+CD8+ (e) T cells in the spleen (top) and peripheral lymph nodes (bottom) (n = 5 per group). Representative FACS plots and quantitative analysis of the indicated cell populations. Naïve (CD62LhighCD44low), effector (CD62LlowCD44high) and Central memory (CD62LhighCD44high). f,g, Naïve CD8+ T cells from WT C57BL/6J mice were activated via CD3/CD28 stimulation for 24 h and then Neon-electroporated with either control (Ctrl) or mouse Tagln2 mRNAs, along with non-targeting (control) or Fabp5-specific siRNAs. Experimental scheme and readouts (f). Representative histograms and quantitative analysis of lipid uptake in CD8+CD44+ T cells determined by FACS (n = 3 per condition) (g). Data are presented as mean ± s.e.m. a-e, Two-tailed unpaired Student’s t-test. g, One-way ANOVA. P<0.05 is considered statistically significant and exact P-values are shown. The ‘n’ values represent biologically independent samples. gMFI, Geometric mean fluorescence intensity.
Extended Data Figure 3.
Extended Data Figure 3.. TAGLN2 downregulation in human and mouse exhausted CD8+ tumor-infiltrating T cells.
a, TAGLN2, TOX, IFNG, GZMB and TNF mRNA expression were reanalyzed from single-cell RNA sequencing data generated from tumor-infiltrating lymphocytes isolated from melanoma patients (GSE72056) using the Broad Institute Single Cell Portal (https://singlecell.broadinstitute.org/single_cell). b, Volcano plot of differentially expressed genes in dysfunctional tumor-specific CD8+ T cells (TCRTAG) compared to non-tumor-specific CD8+ T cells (TCROT1) from a mouse autochthonous liver tumor model (GSE126974). Selected differentially expressed genes with an adjusted P values <0.05 and Log2 Fold Change > 1 or −1 are highlighted. c, TAGLN2 transcripts were shown in the indicated CD8+ T cell populations from human peripheral blood mononuclear cells (PBMC). The resulting transcript expression values calculated as normalized transcript per million (nTPM), resulting from the internal normalized pipeline (The Human Protein Atlas; proteinatlas.org).
Extended Data Figure 4.
Extended Data Figure 4.. Putative transcription factor binding sites in the Tagln2 promoter.
a, ECR browser analysis of the mouse and human Tagln2 locus is shown. The mouse genomic sequence was used as the base sequence on the x-axis. Schematic representation of the genomic positions of exons (E1–5) and putative binding sites of NF-kB and unfolded protein response (UPR) transcription factors in the Tagln2 promoter regions, mainly in the CNS1 region. Asterisks denote UPR transcription factors. UTR, untranslated region. b, Schematic representation of ER stress sensors and their corresponding downstream transcription factors. c,d, Naïve CD8+ T cells isolated from Eif2ak3fl/fl and Eif2ak3fl/flVav1Cre mice (c) or Atf6fl/fl and Atf6fl/flVav1Cre mice (d) were cultured under the indicated conditions. Expression of the Tagln2 transcript was determined by RT-qPCR, and data were normalized to endogenous levels of Actb in each sample (n = 3 per condition and genotype). e, Sequences of mouse Tagln2 promoter from −646 to +138. XBP1s binding sites (Score > 10) are marked as BS1 and BS2. Location of ChIP-PCR primers (F/R) is indicated. f, Tagln2 promoter construct used for luciferase reporter assays. c,d, One-way ANOVA. P<0.05 is considered to be statistically significant and exact P-values are shown. The ‘n’ values represent biologically independent samples.
Extended Data Figure 5.
Extended Data Figure 5.. Elevated Tagln2 expression in multiple intratumoral CD4+ and CD8+ T cell subsets lacking XBP1s.
a, Schematic illustrating sample processing and experimental workflow. b, FACS sorting strategy for scRNA-sequencing. c, UMAP colored by genotype classifications of Xbp1fl/fl (blue, n = 4,269 cells) and Xbp1fl/flCd4Cre (red, n = 3,325 cells). d, UMAP plot visualization of different T cell clusters colored by cell type. e, Heatmap showing the top 10 marker genes of the subclusters. f,g, Dot plots show top 10 upregulated or downregulated genes in CD4+ (f) or CD8+ (g) intratumoral T cell clusters from XBP1s-deficient compared to WT control. The colors represent the average expression levels, and dot sizes represent the percentage expression of each gene in the indicated clusters. h, Enriched cellular pathways and functions in XBP1s-deficient CD8+ T cells at tumor sites. Z-scores greater than 2 indicate pathways and functions predicted to be significantly increased in XBP1s-deficient CD8+ T cells. i,j, Dot plot analysis showing the expression levels and distribution of seven major cytoskeletal genes (Tagln2, Wipf1, Wasf1, Wasf2, Hcls1, Was and Actr2) identified T cells across the indicated cellular clusters identified in (d).
Extended Data Figure 6.
Extended Data Figure 6.. Selective loss of XBP1s in T cells delays malignant tumor progression and enhances TAGLN2, Ki-67, and CD44 expression in PPNM tumor-infiltrating CD8+ T cells.
a, Experimental scheme for mice of the indicated genotypes implanted with luciferase-expressing PPNM cancer cells. b,c, Assessment of peritoneal tumor burden over time in mice of the indicated genotypes (b) and quantification of bioluminescent signal for the same mice of the indicated genotype at different time points (n = 5 per genotype) (c). d, Overall survival curves for PPNM-bearing female mice of the indicated genotypes (n = 9 per genotype). e,f, Representative images of omentum (e) and solid tumors (f) from female mice of the indicated genotypes bearing PPNM-based HGSC for 40 days. Weight of omentum (e) and solid tumors (f) was determined in each group (Xbp1fl/fl, n = 5; Xbp1fl/flCd4 Cre, n = 8). g,h, Correlation of protein expression levels of TAGLN2 versus either Ki-67 or CD44 in the indicated intratumoral CD8+ T cell subsets in omentum (g) and solid tumor (h) from female mice of indicated genotypes bearing PPNM-bearing HGSC for 40 days (Xbp1fl/fl, n = 5; Xbp1fl/flCd4 Cre, n = 8). Data are presented as mean ± s.e.m. c, One-way ANOVA with Tukey multiple comparisons test. d, Log-rank test for survival. e,f, Two-tailed unpaired Student’s t-test. g,h, Spearman’s rank correlation test, Spearman coefficient (r) with exact P-value (two-tailed). P<0.05 is considered to be statistically significant and exact P-values are shown. The ‘n’ values represent biologically independent samples. gMFI, Geometric mean fluorescence intensity.
Extended Data Figure 7.
Extended Data Figure 7.. ER stress responses in CER T cells.
a, Main features of the FSH-CER retroviral construct. b, Expression of the follicle-stimulating hormone receptor (FSHR) by PPNM cancer cells was determined by immunoblot analysis in which β-actin was used as loading control. c, Experimental scheme for analysis of CER T cells at tumor locations 7 days after adoptive transfer. d,e, CD8+GFP+ sorted CER T cells were stimulated with recombinant chorionic gonadotropin alpha (CGα) in the absence or presence of TM (d). Xbp1s, Sec61a1, and Tagln2 expression was determined via qRT-PCR. Data were normalized to Actb (n = 3 per condition) (e). f, Experimental scheme to assess the effect of ER stress in Mock or FSH-CER transfuced CD8+ T cells. g, CD8+GFP+ sorted Mock transduced T cells were electroporated with the indicated mRNAs and then treated with vehicle or TM for 16 h. T cells were washed to remove TM and then cocultured with PPNM cancer cells at a 1:1 ratio. Cancer cell death was assessed by Annexin V and PI staining by FACS 18 h later. Representative FACS plots and quantitative analysis (n = 3–4 per condition). h, FACS-based analysis to assess transduction efficiency using GFP expression as a marker. i, CER or CER-Tagln2 T cells were incubated in the presence or absence of TM for 16 h and TAGLN2 protein expression was measured by FACS. Data are presented as mean ± s.e.m. e, Two-tailed unpaired Student’s t-test. P<0.05 is considered to be statistically significant and exact P-values are shown. The ‘n’ values represent biologically independent samples. gMFI, Geometric mean fluorescence intensity.
Figure 1.
Figure 1.. Defective lipid uptake and FABP5 surface localization in OvCa-infiltrating CD8+ T cells.
a, Representative FACS histograms and quantitative analysis of lipid uptake (BODIPY 500/510) for CD45+CD19CD3+CD8+ T cells isolated from peripheral blood of cancer-free women (n = 8) or malignant ascites of HGSOC patients (n = 15). b,c, Human naïve CD8+ T cells from peripheral blood of cancer-free women were activated via CD3/CD28 stimulation for 32 h, followed by 16 h in the absence or presence of 50% HGSOC ascites supernatants. (b) Lipid uptake was assessed by FACS (n = 5). (c) FABP5, CD36 and FABP4 expression was determined via qRT-PCR and data were normalized to endogenous levels of ACTB (n = 5). d-f, Human naïve CD8+ T cells from peripheral blood of cancer-free individuals were activated via CD3/CD28 stimulation and then Neon-electroporated with either control (Ctrl) or human FABP5 mRNAs. Cells were expanded and treated with 0% or 50% of HGSOC ascites supernatants. Representative histograms and quantitative analysis of total FABP5 protein levels (d), lipid uptake (e), and cell surface FABP5 protein levels (f) in CD8+CD44+ T cells determined by FACS (n = 5 per group). g,h, Representative FACS histograms and quantitative analysis of cell surface (g) and total (h) FABP5 protein levels in CD45+CD19CD3+CD8+ T cells isolated from the same specimens described in a. i-n, C57BL/6J female mice (n = 9) were intraperitoneally injected with ID8-Defb29/Vegfa OvCa cells and euthanized on days 7, 14, or 28 after tumor implantation (n = 3 per group). Experimental scheme and readouts (i). Representative images of peritoneal lavage (j) and omentum (k) from each group. FACS-based analysis to determine the kinetics of cell surface FABP5 protein levels (l), total FABP5 protein levels (m), and lipid uptake (n) in CD45+CD19CD3+CD8+ T cells from peritoneal lavage or omentum (n = 3 per group). Data are presented as mean ± s.e.m. a,c,g,h, Two-tailed unpaired Student’s t-test. b, Two-tailed paired Student’s t-test. d-f, One-way ANOVA with Tukey’s multiple comparisons test. Exact P-values are shown. The ‘n’ values represent biologically independent samples. gMFI, Geometric mean fluorescence intensity.
Figure 2.
Figure 2.. TAGLN2 is required for FABP5 surface localization and lipid uptake in activated CD8+ T cells.
a, Protein-protein interaction maps generated by the STRING database using FABP5 as query in human (Homo sapiens) and mouse (Mus musculus). b,c, Schematic of the immunoprecipitation coupled to mass spectrometry (IP-MS) approach to identify FABP5-interacting proteins. A total of 2,455 proteins were identified at a 1% FDR. Relative intensity was used to compare protein abundance across samples. The top 10 proteins that significantly interact with FABP5 are listed (b). The abundance of predicted FABP5-interacting proteins from (a) is listed by intensity (c). N.D, not detected. d, Interaction between FABP5 and TAGLN2 assessed by co-immunoprecipitation using activated CD8+ T cells from C57BL/6J mice. Representative image from three independent experiments is shown. e, Description of the Talgln2 deletion strategy depicting floxed and deleted alleles. f,g, Deletion efficiency was analyzed in activated CD4+ or CD8+ T cells from Tagln2fl/fl or Tagln2fl/flCd4Cre mice via qRT-PCR using a primer set that specifically detects the exon 3 region of Tagln2. Data were normalized to Actb (f). The intracellular levels of TAGLN2 protein were evaluated by FACS (g) (n = 3 per genotype). h-l, WT or TAGLN2-deficient naïve CD8+ T cells isolated from the spleen and lymph nodes were activated via CD3/CD28 stimulation for 24 h. Representative histograms and quantitative analysis of CD44 (h) and Ki-67 (i) expression are shown. Total FABP5 (j), surface FABP5 (k), and lipid uptake (l) by CD8+CD44+ T cells of the indicated genotypes are shown (n = 3 per genotype). m,n, Wild-type (WT) or FABP5-deficient naïve CD8+ T cells from the spleen and lymph nodes were activated via CD3/CD28 stimulation for 24 h and then Neon-electroporated with either control (Ctrl) or mouse Tagln2 mRNAs. Experimental scheme and readouts (m). Representative histograms and quantitative analysis of lipid uptake (BODIPY 500/510) in CD8+CD44+ T cells determined by FACS (n = 3 per condition) (n). Data are presented as mean ± s.e.m. f-l, Two-tailed unpaired Student’s t-test. n, One-way ANOVA with Tukey’s multiple comparisons test. Exact P-values are shown. The ‘n’ values represent biologically independent samples. gMFI, Geometric mean fluorescence intensity.
Figure 3.
Figure 3.. Status of TAGLN2 in OvCa-infiltrating CD8+ T cells.
a, Representative FACS histograms and quantitative analysis of TAGLN2 protein levels in CD45+CD19CD3+CD8+ T cells isolated from peripheral blood of cancer-free women (n = 6) or malignant ascites of HGSOC patients (n = 15). b, Representative FACS plot of CD8+ T cell-subset analysis from malignant ascites of HGSOC patients (left). TAGLN2 protein expression was quantified in naïve (pink), effector (brown), effector memory (green) and central memory (orange) CD8+ T cells, respectively (right) (n = 15). Cells were pre-gated on CD45+CD19CD3+CD8+ T cells. naïve, CCR7+CD45RO; effector, CCR7CD45RO; effector memory, CCR7CD45RO+; central memory, CCR7+CD45RO+. c, Correlation analysis for IFNG, TNFA or GZMB versus TAGLN2 mRNA in CD8+ T cells from malignant ascites of HGSOC patients of. Data were normalized to ACTB in all cases (n = 15). d, Correlation of IFN-g concentration versus levels of TAGLN2 in the indicated CD8+ T cell subsets in ascites of HGSOC patients (n =14). e, Naïve CD8+ T cells from peripheral blood of cancer-free women were activated via CD3/CD28 stimulation for 32 h and then incubated for 16 h with increasing amounts of HGSOC ascites supernatants (n = 5). Expression of TAGLN2, IFNG, and GZMB was assessed by qRT-PCR. Data were normalized to ACTB. f, Representative FACS histograms and quantitative analysis of TAGLN2 protein levels in effector (CD62LlowCD44high) or central memory (CD62LhighCD44high) CD8+ T cells from peritoneal wash of cancer-free mice (n = 8) or malignant ascites of female mice bearing ID8-Defb29/Vegfa OvCa (n = 6). g,h, Representative FACS histograms and quantitative analysis of CD44 (g) and Ki-67 (h) expression in TAGLN2low or TAGLN2high CD45+CD19CD3+CD8+ T cells from malignant ascites of female mice bearing ID8-Defb29/Vegfa OvCa (n = 6 per group). i-k, Representative FACS plots and quantitative analysis of CD44+IFN-g+ (i), CD44+TNF-a+ (j) and CD44+GZMB+ (k) frequencies in TAGLN2low or TAGLN2high CD45+CD19CD3+CD8+ T cells from the same mice described in (g) and (h). Data are presented as mean ± s.e.m. a,f-h, Two-tailed unpaired Student’s t-test. b,e, One-way ANOVA with Tukey’s multiple comparisons test. c,d, Spearman’s rank correlation test, Spearman coefficient (r) with exact P-value (two-tailed). i-k, Two-tailed paired Student’s t-test. Exact P-values are shown. The ‘n’ values represent biologically independent samples. gMFI, Geometric mean fluorescence intensity.
Figure 4.
Figure 4.. XBP1s restrains TAGLN2 expression in ER-stressed CD8+ T cells.
a, Pre-activated CD8+ T cells from WT C57BL/6J mice were treated with 2-Deoxy-D-glucose (2-DG), Tunicamycin (TM) or Thapsigargin (TG) at the indicated concentrations. Xbp1s and Tagln2 expression were determined via qRT-PCR 16 h after 2-DG or TM treatment, and 6 h post TG exposure. Data were normalized to Actb in each sample (n = 3 per condition). b, TAGLN2 protein expression levels determined by FACS (n = 3 per group) in the same samples described in (a). c, Representative confocal images for TAGLN2 expression in CD8+ T cells from WT C57BL/6J mice under the indicated conditions from two independent experiments. d-g, Naïve CD8+ T cells isolated from Ern1fl/fl or Ern1 fl/fl Cd4Cre mice (d,e) or Xbp1fl/fl or Xbp1fl/flCd4 Cre mice (f,g) were cultured under the indicated conditions. Expression of the Tagln2 transcript was determined by RT-qPCR, and data were normalized to endogenous levels of Actb in each sample (d,f) (n = 3 per condition and genotype). Representative FACS histograms and quantitative analysis of TAGLN2 protein levels in CD8+CD44+ T cells under the indicated conditions (e,g) (n = 3 per genotype). h, Pre-activated CD8+ T cells from WT C57BL/6J mice were stimulated via CD3/CD28 for 16 h in the absence or presence of TM (1 μg/ml). White bars, DMSO; Red bars, MKC8866 (2 μM); Orange bars, KIRA8 (1 μM). Expression of Xbp1s and Tagln2 transcripts were determined by RT-qPCR, and data were normalized to endogenous levels of Actb in each sample (n = 3 per condition). i, Conserved XBP1s-binding motifs (CACGTC) from mouse (top) and human (bottom) are shown. j, Pre-activated CD8+ T cells from WT C57BL/6J mice were stimulated via CD3/CD28 for 16 h in the absence or presence of the ER stressor TM (1 μg/ml). ChIP assays were performed using anti-XBP1s or isotype control antibodies. qRT-PCR was used to determine XBP1s occupancy at two XBP1s-binding sites (BS1 and BS2) in Tagln2 promoter regions under the conditions tested. No XBP1s binding region (NR) was used as a negative control. ChIP-quantitative PCR assays were performed using T cells from three independent mice (n = 3 per condition). k, Tagln2 promoter-luciferase construct (−738 to +134) was co-transfected with the combination of NF-kB (p50) and XBP1s expressing vectors in HEK-293 T cells. Lysates were prepared 48 h after transfection, and luciferase activities were measured with the firefly luciferase activities normalized to renilla luciferase activities (n = 3). l,m, Representative FACS histograms and quantitative analysis of TAGLN2 protein levels in effector (CD62LlowCD44high) or central memory (CD62LhighCD44high) CD8+ intratumoral T cells in omentum (l) and solid tumor (m) from female mice of the indicated genotypes bearing PPNM-based HGSC for 40 days (Xbp1fl/fl, n = 5; Xbp1fl/flCd4 Cre, n = 8). n, UMAP plot of T cell subtypes from 11 HGSOC treatment-naïve human tumor specimens. o, GSEA enrichment plots showing downregulation of ER stress gene signature in TAGLN2hi CD8+ tumor-infiltrating effector memory T cells (TEM). NES, normalized enrichment score. p, Correlation analysis for Xbp1s versus TAGLN2 mRNA expression levels in CD8+ T cells residing in the ascites of HGSOC patients. Data were normalized to ACTB (n = 16). q, Correlation of XBP1s versus TAGLN2 protein expression in CD45+CD19CD3+CD8+ T cells from the ascites of HGSOC patients (n =14). Data are presented as mean ± s.e.m. a,b,d,f,h,k, One-way ANOVA with Tukey’s multiple comparisons test. e,g,j,l,m, Two-tailed unpaired Student’s t-test. p,q, Spearman’s rank correlation test, Spearman coefficient (r) with exact P-value (two-tailed). P<0.05 is considered statistically significant and exact P-values are shown. The ‘n’ values represent biologically independent samples. gMFI, Geometric mean fluorescence intensity.
Figure 5.
Figure 5.. TAGLN2 overexpression rescues the bioenergetic defects of ER-stressed CD8+ T cells.
a-c, Pre-activated CD8+ T cells from WT C57BL/6J mice were stimulated via CD3/CD28 for 16 h in the presence of TM at the indicated concentrations. Representative FACS histograms and quantitative analysis of cell surface FABP5 expression (a) and lipid uptake (b) in CD8+CD44+ T cells. c, Representative OCR plots (left) and quantification (right) of basal (blue) and maximal respiration (red) are shown. Data were normalized to total genomic DNA content in each condition (n = 5). d-f, Naïve CD8+ T cells from WT C57BL/6J mice were stimulated via CD3/CD28 for 24 h and then Neon-electroporated with either Control (Ctrl) or mouse Tagln2 mRNAs. Electroporated T cells were maintained under CD3/CD28 stimulation for an additional 32 h and then treated with the ER stressor TM (1 μg/ml) for 16 h. (d) Representative FACS histograms and quantitative analysis of lipid uptake. (e) Representative OCR plots (left) are shown. Rates of basal respiration (middle) and maximal respiratory capacity (right) were quantified and normalized to total genomic DNA content (n = 5 per condition). (f) Expression levels of CD44 (left) and Ki-67 (right) in CD8+ T cells electroporated with the indicated mRNAs and exposed to TM (n = 9 per condition). g, OCR of TM-treated Tagln2-overexpressing CD8+ T cells in response to media (vehicle) or etomoxir injection. The maximal respiratory capacity was quantified and normalized to total genomic DNA content (n = 5 per condition). h, Expression levels of CD44 (left) and Ki-67 (right) in TM-treated Tagln2-overexpressing CD8+ T cells in the absence or presence of exogenous oleic acid (OA, 30 μM). i,j, WT or TAGLN2-deficient naïve CD8+ T cells from spleen and lymph nodes were activated via CD3/CD28 stimulation in complete medium for 24 h, followed by 48 h culture with or without oleic acid in either complete- or glucose-free medium. (i) Experimental scheme. (j) Representative FACS plots and quantitative analysis of mitochondrial membrane potential analyzed by MitoTracker Deep Red staining (n = 4 per condition). Data are presented as mean ± s.e.m. a,d-h, Two-tailed unpaired Student’s t-test. b,c,j, One-way ANOVA with Tukey’s multiple comparisons test. P<0.05 is considered statistically significant and exact P-values are shown. The ‘n’ values represent biologically independent samples. gMFI, Geometric mean fluorescence intensity.
Figure 6.
Figure 6.. Preserving TAGLN2 enhances the therapeutic effects of CER T cells in OvCa.
a-c, CD45.1+CER T cells were isolated from the indicated tumor sites seven days after adoptive transfer into WT C57BL/6J female mice developing PPNM HGSC. (a) Xbp1s, Sec61a1, ERdj4, and Tagln2 expression in pre- or post-infusion CD45.1+CD3+GFP+ CER T cells was determined via qRT-PCR. Data were normalized to Actb (n = 12). Representative FACS histograms and quantitative analysis of TAGLN2 (b) and surface FABP5 (c) protein levels in gated CD45.1+CD3+GFP+ T cells from peritoneal lavage or omentum (n = 12 per group). Blue dotted lines in the bar graph represent the expression of TAGLN2 and surface FABP5 in pre-infusion CER T cells, respectively. d, CER T cells were electroporated with the indicated mRNAs and then treated with vehicle or TM (1 μg/ml) for 16 h. T cells were washed to remove TM and then cocultured with PPNM cancer cells at a 1:1 ratio. Cancer cell death was assessed via Annexin V and PI staining by FACS 18 h later. Representative FACS plots and quantitative analysis (n = 3–4 per condition). e, Schematics of retroviral CER expression constructs. FSHβ, Follicle-stimulating hormone beta subunit. CGα, chorionic gonadotropin alpha subunit. IRES, Internal ribosome entry site. GFP, Green fluorescent protein. f, Experimental scheme for adoptive transfer of CER or CER-Tagln2 T cells into PPNM tumor-bearing WT C57BL/6J female mice. g-i, Expression of TAGLN2 protein (g), frequencies of CD62LhiCD44hi (central memory) (h), and cell surface and total levels of FABP5 protein (i) were assessed in the indicated CER T cell populations from peritoneal lavage or omentum at day 21 of tumor development (7 days after the second T cell infusion). Representative FACS histograms and quantitative analysis are shown (n = 3–8 mice per group). j,k, Peritoneal carcinomatosis in female mice bearing PPNM-based HGSC and treated with the indicated CER T cells. Representative bioluminescence images of PPNM tumors over time (j) and quantification of peritoneal tumor burden (k) in the indicated groups (n = 16 mice per group). l,m, Representative images of omentum (l), and quantification of CD3+ T cell infiltration into omental samples (m) in the indicated female mice bearing PPNM tumors (n = 8 per group). n, Overall survival rates for the mice described in (j,k) (n = 16 per group). Data are presented as mean ± s.e.m. a, Two-tailed paired Student’s t-test. g-I, Two-tailed unpaired Student’s t-test. d,k, One-way ANOVA with Tukey’s multiple comparisons test. m, Fisher’s exact test was used to determine the association between the two categorical variables. n, Log-rank test for survival. P<0.05 is considered statistically significant and exact P-values are shown. The ‘n’ values represent biologically independent samples. gMFI, Geometric mean fluorescence intensity.

References

    1. Lim S. A., Su W., Chapman N. M. & Chi H. Lipid metabolism in T cell signaling and function. Nature Chemical Biology 18, 470–481 (2022). 10.1038/s41589-022-01017-3 - DOI - PMC - PubMed
    1. Zhang Y. et al. Enhancing CD8(+) T Cell Fatty Acid Catabolism within a Metabolically Challenging Tumor Microenvironment Increases the Efficacy of Melanoma Immunotherapy. Cancer Cell 32, 377–391 e379 (2017). 10.1016/j.ccell.2017.08.004 - DOI - PMC - PubMed
    1. Nava Lauson C. B. et al. Linoleic acid potentiates CD8(+) T cell metabolic fitness and antitumor immunity. Cell Metab 35, 633–650.e639 (2023). 10.1016/j.cmet.2023.02.013 - DOI - PubMed
    1. Pan Y. et al. Survival of tissue-resident memory T cells requires exogenous lipid uptake and metabolism. Nature 543, 252–256 (2017). 10.1038/nature21379 - DOI - PMC - PubMed
    1. Lin R. et al. Fatty Acid Oxidation Controls CD8(+) Tissue-Resident Memory T-cell Survival in Gastric Adenocarcinoma. Cancer Immunol Res 8, 479–492 (2020). 10.1158/2326-6066.CIR-19-0702 - DOI - PubMed

Publication types