[Preprint]. 2023 Dec 12:2023.12.12.571235.
doi: 10.1101/2023.12.12.571235.

Age-dependent heterogeneity in the antigenic effects of mutations to influenza hemagglutinin

Affiliations

Age-dependent heterogeneity in the antigenic effects of mutations to influenza hemagglutinin

Frances C Welsh et al. bioRxiv. .

Update in

  • Age-dependent heterogeneity in the antigenic effects of mutations to influenza hemagglutinin.
    Welsh FC, Eguia RT, Lee JM, Haddox HK, Galloway J, Van Vinh Chau N, Loes AN, Huddleston J, Yu TC, Quynh Le M, Nhat NTD, Thi Le Thanh N, Greninger AL, Chu HY, Englund JA, Bedford T, Matsen FA 4th, Boni MF, Bloom JD. Welsh FC, et al. Cell Host Microbe. 2024 Aug 14;32(8):1397-1411.e11. doi: 10.1016/j.chom.2024.06.015. Epub 2024 Jul 19. Cell Host Microbe. 2024. PMID: 39032493 Free PMC article.

Abstract

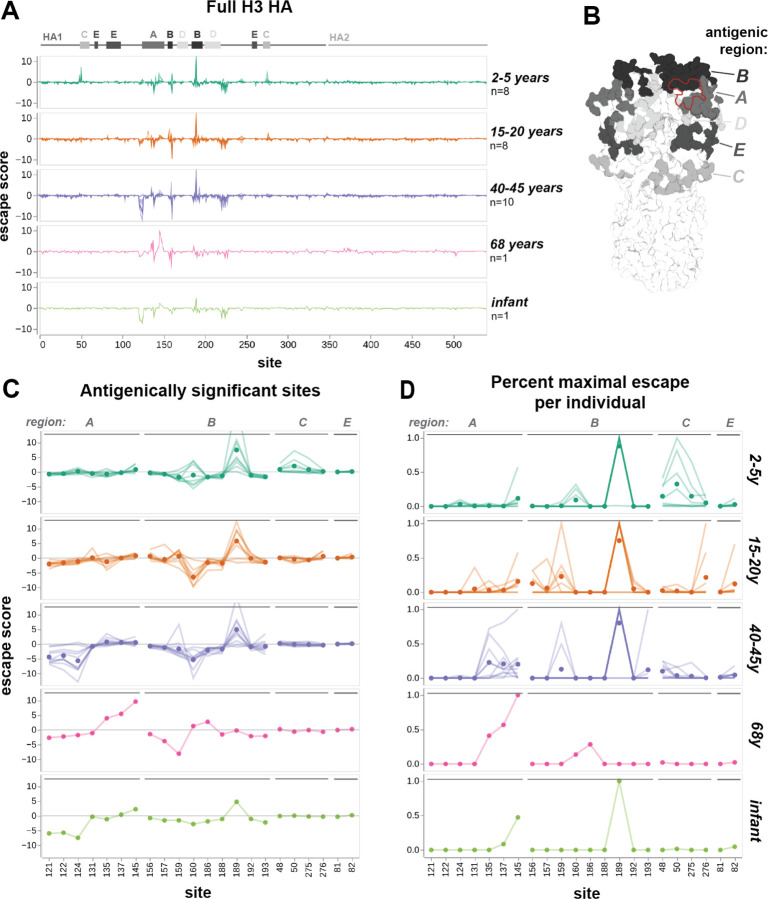
Human influenza virus evolves to escape neutralization by polyclonal antibodies. However, we have a limited understanding of how the antigenic effects of viral mutations vary across the human population, and how this heterogeneity affects virus evolution. Here we use deep mutational scanning to map how mutations to the hemagglutinin (HA) proteins of the A/Hong Kong/45/2019 (H3N2) and A/Perth/16/2009 (H3N2) strains affect neutralization by serum from individuals of a variety of ages. The effects of HA mutations on serum neutralization differ across age groups in ways that can be partially rationalized in terms of exposure histories. Mutations that fixed in influenza variants after 2020 cause the greatest escape from sera from younger individuals. Overall, these results demonstrate that influenza faces distinct antigenic selection regimes from different age groups, and suggest approaches to understand how this heterogeneous selection shapes viral evolution.


Conflict of interest statement

Competing Interests JDB is on the scientific advisory boards of Apriori Bio, Invivyd, Aerium Therapeutics, and the Vaccine Company. JDB, ANL, and FCW receive royalty payments as inventors on Fred Hutch licensed patents related to viral deep mutational scanning. HYC reports consulting with Ellume, Pfizer, and the Bill and Melinda Gates Foundation. She has served on advisory boards for Vir, Merck and Abbvie. She has conducted CME teaching with Medscape, Vindico, and Clinical Care Options. She has received research funding from Gates Ventures, and support and reagents from Ellume and Cepheid outside of the submitted work. JAE receives institutional funding from AstraZeneca, Merck, GlaxoSmithKline, and Pfizer. She is a consultant for Abbvie, Astrazeneca, GlaxoSmithKline, Meissa Vaccines, Moderna, Pfizer, and SanofiPasteur. ALG reports contract testing from Abbott, Cepheid, Novavax, Pfizer, Janssen, and Hologic and research support from Gilead outside of the submitted work.

Figures

Figure 1.
Figure 1.. Deep mutational scanning escape maps show how mutations to HA affect viral neutralization.
(A) Experimental workflow for mapping HA serum escape. The virus library is incubated with either the serum of interest, or media alone, then added to cells. At 13 hours post-infection, RNA is harvested from cells, and viral barcodes are reverse-transcribed and amplified by PCR. Escape scores are calculated for all sampled mutations by sequencing barcodes from variants that successfully infected cells in the serum-selection condition, and comparing to the mock-selection. A neutralization standard is used to convert relative sequencing counts into absolute neutralization (Figure S2). Example serum escape maps from a child (B) and an adult (C). The line plot shows the summed effects of all sampled mutations at each site (“site escape”, roughly proportional to fold change in neutralization), with positive values indicating neutralization escape and negative values indicating increased neutralization. Heatmaps show the effects of individual mutations for key sites. In the heatmaps, X indicates the wildtype amino acid in A/Hong Kong/45/2019 at each site, dark gray indicates mutations measured to be highly deleterious to HA-mediated infection, and light gray indicates mutations not sampled in the libraries. The structures are colored by the summed site escape scores, and show the HA structure for the A/Victoria/361/2011 H3 HA (PDB 4O5N). See https://dms-vep.github.io/flu_h3_hk19_dms/3944_escape_plot.html and https://dms-vep.github.io/flu_h3_hk19_dms/197C_escape_plot.html for full interactive escape maps with zoomable heat maps covering all sites. (D-E) Validations of escape scores by traditional neutralization assays for selected mutants against the child (D) and adult (E) sera. Correlation plots show the escape scores versus the log2 fold change in IC50 between the wildtype library strain and the mutant of interest. R indicates the Pearson correlation.
Figure 2.
Figure 2.. Escape maps from different cohorts show age-dependent trends in serum targeting of A/Hong Kong/45/2019 HA.
(A) Serum escape maps for different human individuals in each age cohort. Each line represents an individual, and individuals within the same cohort are overlaid in the same plot. Escape scores are the summed effects of all sampled mutations at each site. Approximate locations of HA1, HA2, and antigenic regions A through E (as defined by Muñoz and Deem, 2005) are labeled above the plots. (B) H3 HA trimer colored by antigenic region, with RBS outlined in red. Structure is from A/Victoria/361/2011 H3 HA (PDB 4O5N). (C) Serum escape maps at antigenically significant sites for human individuals in each age cohort. Each line is an individual escape map, and points represent the mean escape score for that age cohort at that site. The y-axis is clipped to 12.5 in both (A) and (C), although one child has an escape score of 23.9 at site 189. (D) Escape maps for key sites with escape floored at zero and normalized to the maximal positive escape score for that individual. Lines represent individuals and points represent the mean normalized escape score for that age cohort.
Figure 3.
Figure 3.. Validation of deep mutational scanning results using neutralization assays.
The escape score measured by deep mutational scanning for each mutation is plotted against the log2 fold change in IC50 between the wildtype library strain and the mutant of interest. R indicates the Pearson correlation. See Figure S7 for full neutralization curves and serum-level correlation plots.
Figure 4.
Figure 4.. Escape maps from A/Perth/16/2009 H3 HA, measured against sera from an unvaccinated cohort and singly-infected ferrets.
(A) Serum escape maps for different individuals in each cohort. Each line represents an individual, and individuals within the same cohort are overlaid in the same plot. Escape scores are the summed effects of all sampled mutations at each site. Approximate locations of HA1, HA2, and antigenic regions A through E are labeled above the plots. (B) Antigenic region B of H3 HA is shown in black, with RBS outlined in red. Structure is from A/Victoria/361/2011 H3 HA (PDB 4O5N). (C and D) Serum escape maps at antigenically significant sites for individuals in each cohort. Each line is an individual escape map, and points represent the mean escape score for the cohort at that site. (C) shows the escape scores, while (D) shows the max normalized escape scores for each individual. (E) Correlation of escape scores measured in deep mutational scanning versus the fold-change in IC50 measured in traditional neutralization assays for each serum. F193F is a synonymous mutant used as a control. The Pearson correlation is indicated for each serum. See Figure S10 for full neutralization curves. (F) Global frequency of site 189 H3 HA variants, compared to escape scores at site 189 from 2-4-year-old children. Dashed lines on frequency plot indicate maximum exposure period for this cohort, from the earliest birth date to latest serum collection date. Frequency plot adapted from the Nextstrain real-time pathogen evolution website (Hadfield et al., 2018; Neher and Bedford, 2015).
Figure 5.
Figure 5.. Comparison of serum escape maps between 2010–2011 and 2020 cohorts.
(A) Normalized serum escape maps at antigenically significant sites for different individuals in each cohort, colored by age group. Each line is an individual escape map, normalized by the maximum escape for that individual. (B) Maximal normalized escape score for each age cohort visualized on the H3 HA structure. Zoomed panels show key sites in antigenic regions A and B. Glycosylated sites (site 133 and 144 for A/Perth/16/2009, and site 158 for A/Hong Kong/45/2019) are indicated with red text, and the global frequency of variants with these glycans over time are plotted to the left. Structures are from A/Victoria/361/2011 H3 HA (PDB 4O5N). (C) Changes in escape maps from young children between 2010 and 2020, compared to the emergence of new variants at those sites. Global frequency plots of H3 HA variants at sites 159, 160, and 193 are colored by the wildtype amino acid in A/Perth/16/2009 (F159, K160, F193) or A/Hong Kong/45/2019 (Y159, T160, S193). At site 50, both library strains have the same genotype (E50). Escape scores for mutations to amino acids circulating from 2010–2020 are plotted below. Points represent the mutation escape score for each individual in the cohort. For the 2010–2011 cohort, escape scores were normalized to one at each site, to facilitate comparison to escape scores from the 2020 cohort. Frequency plots in (B) and (C) were adapted from the Nextstrain real-time pathogen evolution website (Hadfield et al., 2018; Neher and Bedford, 2015).
Figure 6.
Figure 6.. Relationship between escape mapped in deep mutational scanning and actual H3N2 HA evolution in humans.
(A) Serum escape maps at key antigenic sites for individuals in either the 2-5-year-old cohort, or all age cohorts, tested against the A/Hong Kong/45/2019 HA. Each line is an individual escape map. (B) Escape scores for H3N2 influenza strains circulating from 2012 to 2023, averaged across sera within each cohort. Strain escape is calculated based on the sum of the cohort-average escape scores for all mutations in that strain, relative to the parental library strain A/Hong Kong/45/2019, which has an escape score of zero. Plots show a 2D histogram of escape scores for approximately 1,200 H3N2 HA variants sampled during this timeframe. Dashed line indicates the year of serum collection (2020). The slope of the best-fit line relating year to average strain escape (line not shown) is reported for each cohort, along with the Pearson correlation. The slope is significantly higher for the teenage cohort compared to the child (p=0.022) and adult (p=0.004) cohorts.

References

    1. Arevalo P, McLean HQ, Belongia EA, Cobey S. 2020. Earliest infections predict the age distribution of seasonal influenza A cases. Elife 9. doi: 10.7554/eLife.50060 - DOI - PMC - PubMed
    1. Bacsik DJ, Dadonaite B, Butler A, Greaney AJ, Heaton NS, Bloom JD. 2023. Influenza virus transcription and progeny production are poorly correlated in single cells. Elife 12. doi: 10.7554/eLife.86852 - DOI - PMC - PubMed
    1. Basta NE, Chao DL, Halloran ME, Matrajt L, Longini IM Jr. 2009. Strategies for pandemic and seasonal influenza vaccination of schoolchildren in the United States. Am J Epidemiol 170:679–686. - PMC - PubMed
    1. Bedford T, Suchard MA, Lemey P, Dudas G, Gregory V, Hay AJ, McCauley JW, Russell CA, Smith DJ, Rambaut A. 2014. Integrating influenza antigenic dynamics with molecular evolution. Elife 3:e01914. - PMC - PubMed
    1. Berto A, Pham HA, Thao TTN, Vy NHT, Caddy SL, Hiraide R, Tue NT, Goodfellow I, Carrique-Mas JJ, Thwaites GE, Baker S, Boni MF, VIZIONS consortium. 2018. Hepatitis E in southern Vietnam: Seroepidemiology in humans and molecular epidemiology in pigs. Zoonoses Public Health 65:43–50. - PMC - PubMed

Publication types