[Preprint]. 2023 Nov 26:2023.11.25.568393.
doi: 10.1101/2023.11.25.568393.

Connecting single-cell transcriptomes to projectomes in mouse visual cortex

Staci A Sorensen  1 Nathan W Gouwens  1 Yun Wang  1 Matt Mallory  1 Agata Budzillo  1 Rachel Dalley  1 Brian Lee  1 Olga Gliko  1 Hsien-Chi Kuo  1 Xiuli Kuang  2 Rusty Mann  1 Leila Ahmadinia  1 Lauren Alfiler  1 Fahimeh Baftizadeh  1 Katherine Baker  1 Sarah Bannick  1 Darren Bertagnolli  1 Kris Bickley  1 Phil Bohn  1 Dillan Brown  1 Jasmine Bomben  1 Krissy Brouner  1 Chao Chen  2 Kai Chen  2 Maggie Chvilicek  1 Forrest Collman  1 Tanya Daigle  1 Tim Dawes  1 Rebecca de Frates  1 Nick Dee  1 Maxwell DePartee  1 Tom Egdorf  1 Laila El-Hifnawi  1 Rachel Enstrom  1 Luke Esposito  1 Colin Farrell  1 Rohan Gala  1 Andrew Glomb  1 Clare Gamlin  1 Amanda Gary  1 Jeff Goldy  1 Hong Gu  1 Kristen Hadley  1 Mike Hawrylycz  1 Alex Henry  1 Dijon Hill  1 Karla E Hirokawa  1 Zili Huang  2 Katelyn Johnson  1 Zoe Juneau  1 Sara Kebede  1 Lisa Kim  1 Changkyu Lee  1 Phil Lesnar  1 Anan Li  3   4 Andrew Glomb  1 Yaoyao Li  2 Elizabeth Liang  1 Katie Link  1 Michelle Maxwell  1 Medea McGraw  1 Delissa A McMillen  1 Alice Mukora  1 Lindsay Ng  1 Thomas Ochoa  1 Aaron Oldre  1 Daniel Park  1 Christina Alice Pom  1 Zoran Popovich  5 Lydia Potekhina  1 Ram Rajanbabu  1 Shea Ransford  1 Melissa Reding  1 Augustin Ruiz  1 David Sandman  1 La'Akea Siverts  1 Kimberly A Smith  1 Michelle Stoecklin  1 Josef Sulc  1 Michael Tieu  1 Jonathan Ting  1 Jessica Trinh  1 Sara Vargas  1 Dave Vumbaco  1 Miranda Walker  1 Micheal Wang  1 Adrian Wanner  6 Jack Waters  1 Grace Williams  1 Julia Wilson  1 Wei Xiong  2 Ed Lein  1 Jim Berg  1 Brian Kalmbach  1 Shenqin Yao  1 Hui Gong  3   4 Qingming Luo  7 Lydia Ng  1 Uygar Sümbül  1 Tim Jarsky  1 Zizhen Yao  1 Bosiljka Tasic  1 Hongkui Zeng  1
Affiliations

Connecting single-cell transcriptomes to projectomes in mouse visual cortex

Staci A Sorensen et al. bioRxiv. .

Abstract

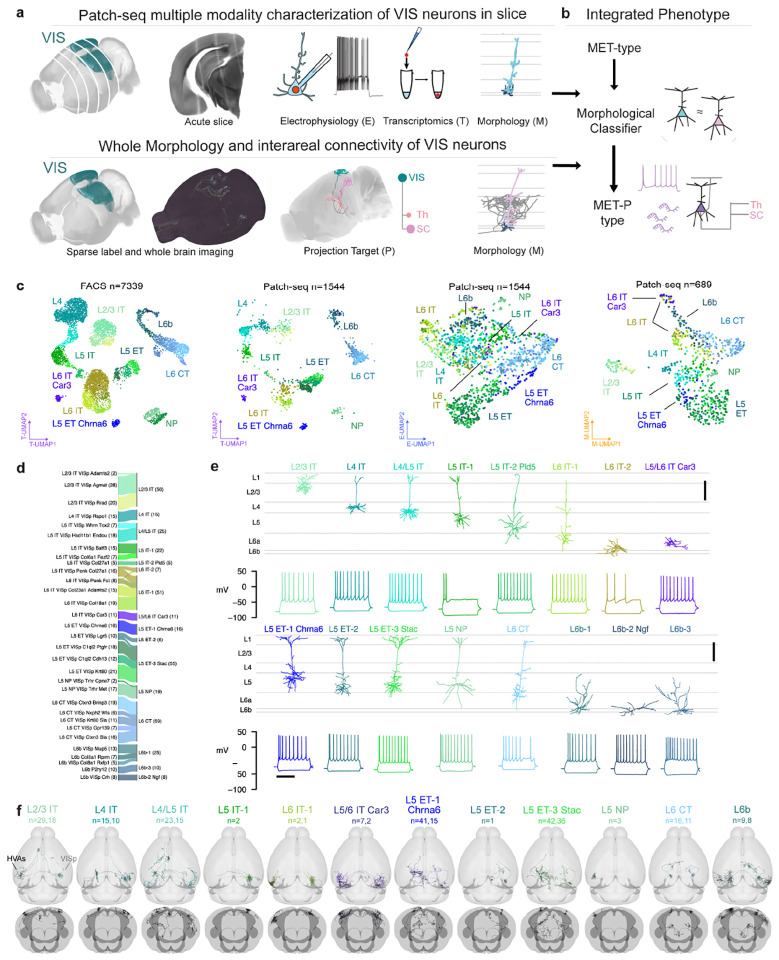
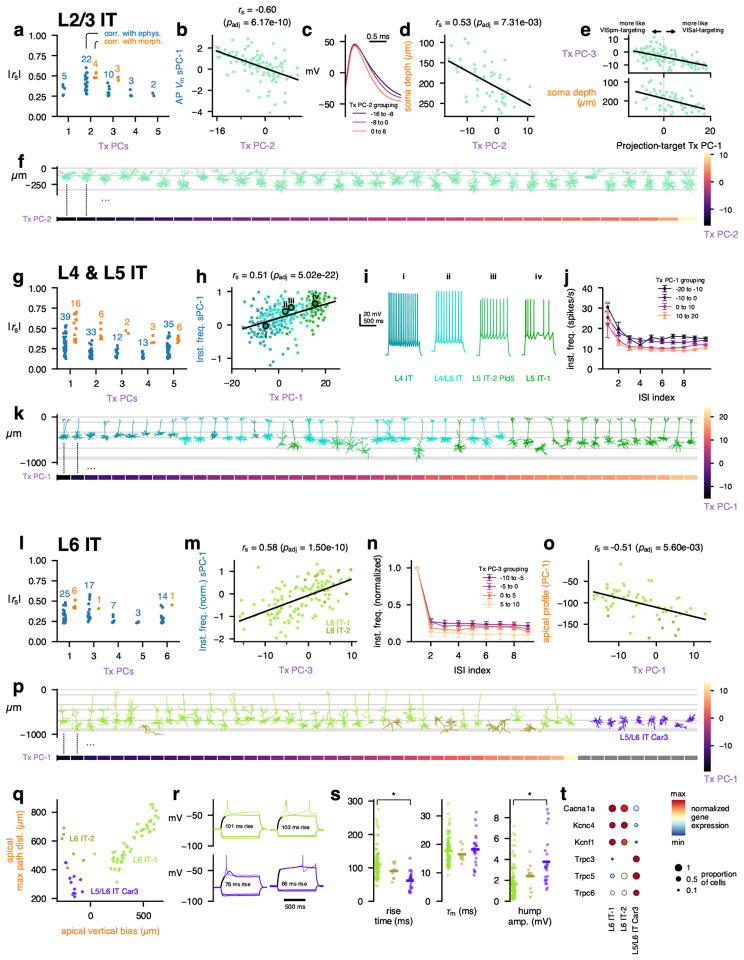
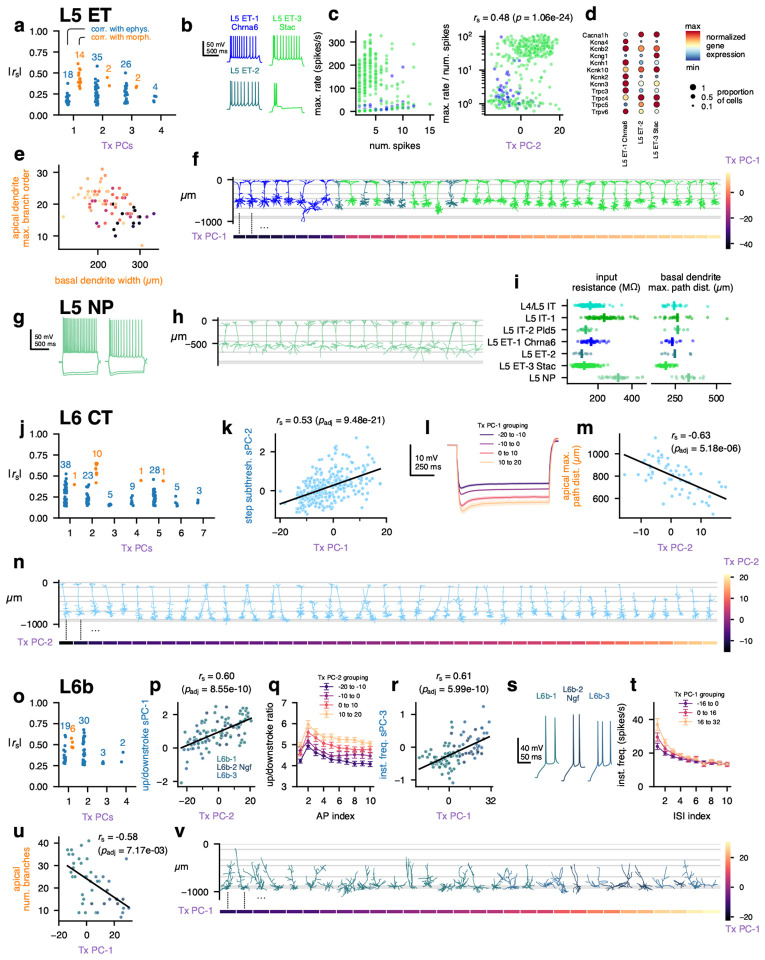
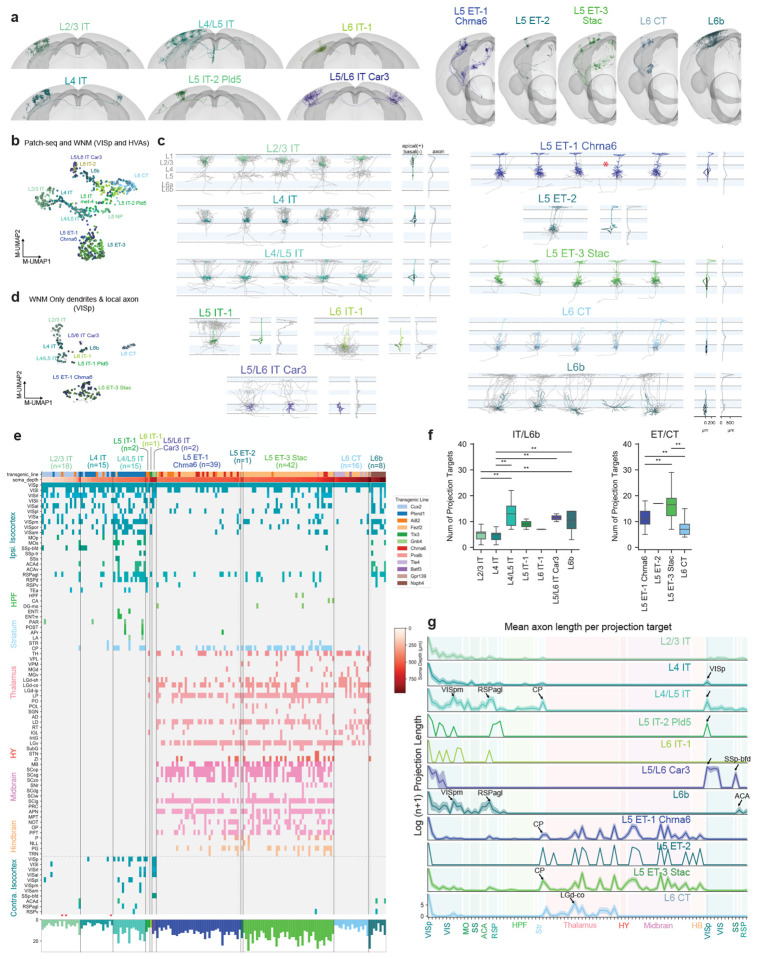
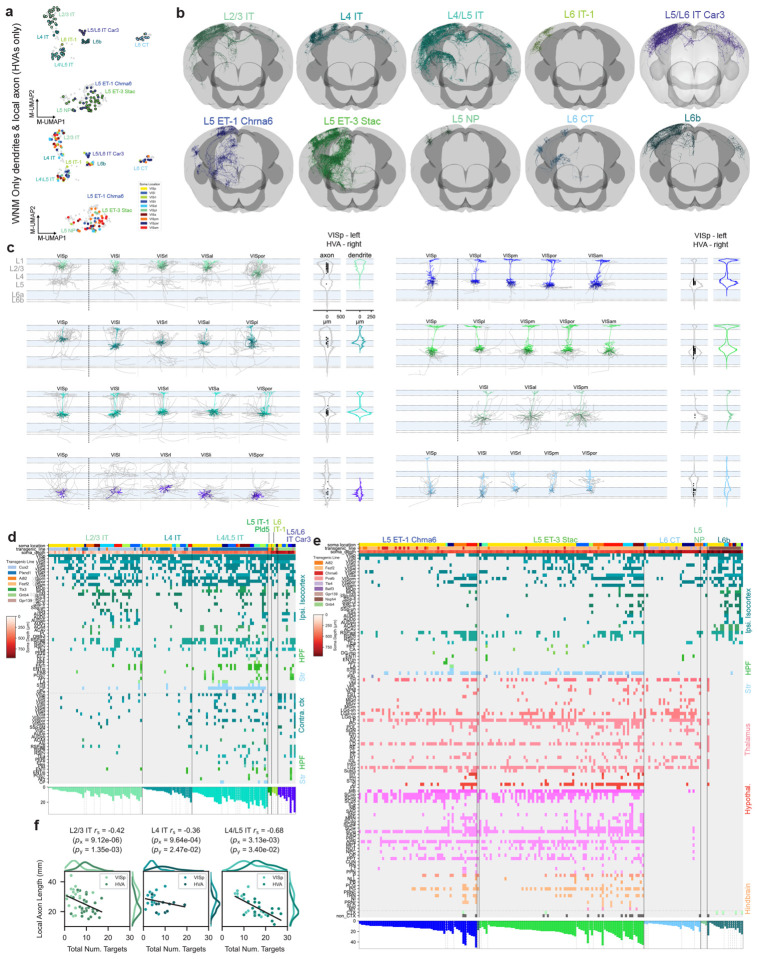
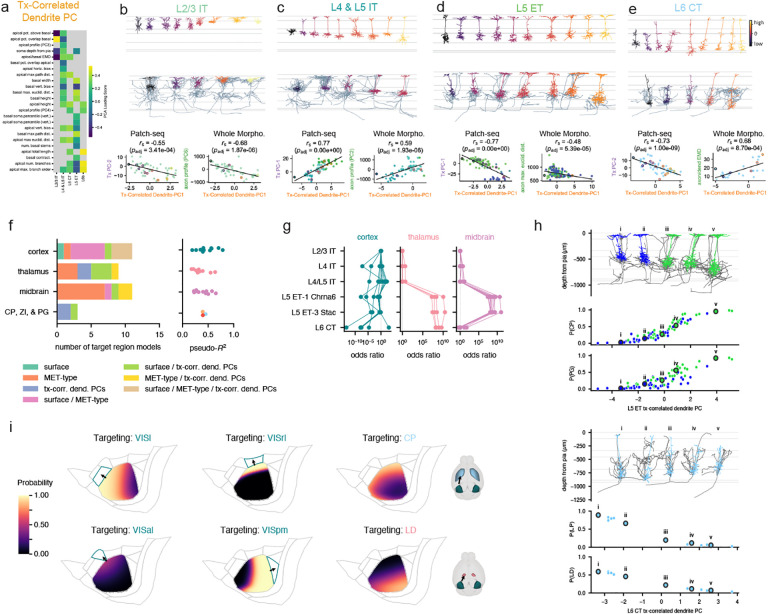
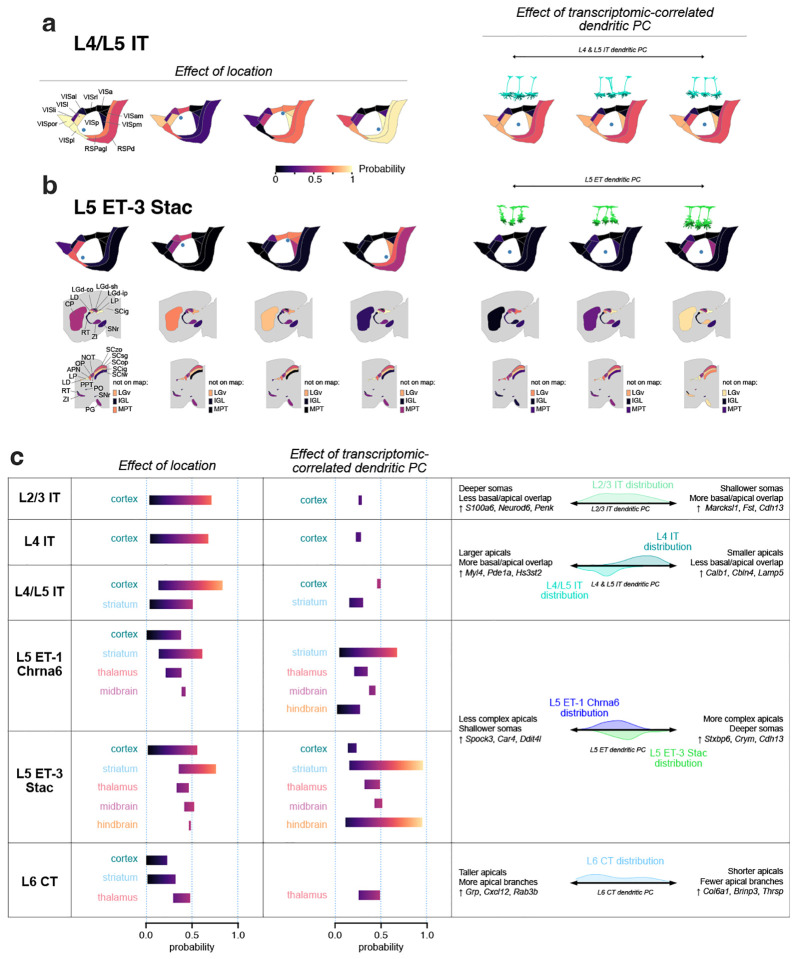
The mammalian brain is composed of diverse neuron types that play different functional roles. Recent single-cell RNA sequencing approaches have led to a whole brain taxonomy of transcriptomically-defined cell types, yet cell type definitions that include multiple cellular properties can offer additional insights into a neuron's role in brain circuits. While the Patch-seq method can investigate how transcriptomic properties relate to the local morphological and electrophysiological properties of cell types, linking transcriptomic identities to long-range projections is a major unresolved challenge. To address this, we collected coordinated Patch-seq and whole brain morphology data sets of excitatory neurons in mouse visual cortex. From the Patch-seq data, we defined 16 integrated morpho-electric-transcriptomic (MET)-types; in parallel, we reconstructed the complete morphologies of 300 neurons. We unified the two data sets with a multi-step classifier, to integrate cell type assignments and interrogate cross-modality relationships. We find that transcriptomic variations within and across MET-types correspond with morphological and electrophysiological phenotypes. In addition, this variation, along with the anatomical location of the cell, can be used to predict the projection targets of individual neurons. We also shed new light on infragranular cell types and circuits, including cell-type-specific, interhemispheric projections. With this approach, we establish a comprehensive, integrated taxonomy of excitatory neuron types in mouse visual cortex and create a system for integrated, high-dimensional cell type classification that can be extended to the whole brain and potentially across species.


Figures

Figure 1:
Figure 1:
a, Schematic of parallel experimental strategies. b, Integration of the two datasets based on shared dendritic properties. c, UMAPs based on principal components of gene expression (left: dissociated cells, second from left: cells from Patch-seq recordings), electrophysiology features (second from right) and morphology features (right), with T-types shown in colors. Broader transcriptomic subclasses are labeled for clarity. d, River plot showing the relationships between T-types (left) and assigned MET-types (right) for cells from Patch-seq recordings with all three data modalities available. e, Example cortical layer-aligned morphological reconstructions and electrophysiological responses for each excitatory cortical MET-type. Electrophysiology examples include responses evoked by a hyperpolarizing current step (70 or 90 pA), and the response evoked by a rheobase + 30 pA or + 40 pA stimulus. f, Whole neuron morphologies (WNM) registered to the Allen CCFv3, horizontal and frontal views. Each panel shows individual WNMs located in VISp (right) and/or HVAs (left), that were classified into an integrated MET-type using local morphology features.
Figure 2:
Figure 2:. MET characterization of IT subclasses.
a, Spearman correlations between transcriptomic principal components (Tx PCs) and electrophysiology/morphology features for the L2/3 IT subclass. Only statistically significant correlations are shown (B-H adjusted p-values < 0.05); the number of significant correlations per PC and modality are shown above the points. b, Relationship between L2/3 IT Tx PC-2 and the first sparse principal component (sPC-1) of the action potential (AP) waveform. c, Average AP waveforms for cells grouped by transcriptomic PC-2 values. d, Relationship between L2/3 IT Tx PC-2 and soma depth. e, Relationships between a PC derived from VISpm- vs VISal-targeting differentially expressed genes identified by Kim et al. [42] and L2/3 IT Tx PC-3 (top) and soma depth (bottom). f, Example L2/3 IT morphologies (top) ordered by their Tx PC-2 values (bottom). g, Correlations between L4 & L5 IT (L4 IT, L4/L5 IT, L5 IT-1, and L5 IT-2 Pld5) Tx PCs and electrophysiology/morphology features. h, Relationship between L4 & L5 IT Tx PC-1 and the sPC-1 of instantaneous firing frequency. i, Example responses to depolarizing current steps for cells corresponding to points i to iv in (i). j, Average instantaneous firing frequencies by interspike interval (ISI) index for cells grouped by L4 & L5 IT transcriptomic PC-1. k, Example L4 & L5 IT morphologies (top) ordered by their Tx PC-1 values (bottom). l, Correlations between L6 IT (L6 IT-1 and −2) Tx PCs and electrophysiology/morphology features. Note that L6 IT Tx PC-2 is not shown as it did not exhibit any significant correlations with electrophysiology/morphology features. m, Relationship between L6 IT Tx PC-3 and normalized instantaneous firing frequency sPC-1. n, Average instantaneous firing frequencies, normalized to the first ISI, by ISI index for cells grouped by L6 IT Tx PC-3. o, Relationship between L6 IT Tx PC-1 and the apical depth profile PC-1. p, Example L6 IT morphologies (top) ordered by their Tx PC-1 values (bottom). Example L5/L6 IT Car3 morphologies are also shown for comparison; they were not included in the L6 IT PCA as they exhibit highly distinct transcriptomic profiles and so do not have Tx PC-1 values (gray). q, Relationship between the apical vertical bias and maximum path distance within the apical dendrite. r, Example responses to subthreshold (thick line) and suprathreshold (thin line) depolarizing current steps. The interval in which the voltage rose between 10% and 90% of its steady-state value is indicated (black) and the rise time shown. Colors indicate MET-types as in (q). s, Comparison of rise times (left), membrane time constants (middle), and depolarizing ”hump” amplitudes (right) between L6 IT-1, −2, and L5/L6 IT Car3 cells. t, Differentially expressed ion channels between L6 IT-1 and L5/L6 IT Car3. L6 IT-2 also shown for comparison.
Figure 3:
Figure 3:. MET characterization of ET, NP, CT, and L6b subclasses.
a, Spearman correlations between transcriptomic principal components (Tx PCs) and electrophysiology/morphology features for the L5 ET (L5 ET-1 Chrna6, L5 ET-2, and L5 ET-3 Stac) subclass. Only statistically significant correlations are shown (B-H adjusted p-values < 0.05); the number of significant correlations per PC and modality are shown above the points. b, Example responses to depolarizing current steps showing different initial activity, including bursting. c, Relationship between the maximum instantaneous firing frequency during a current step and the number of total APs in that step (left), and the relationship between that ratio and the L5 ET Tx PC-2 (right). d, Differentially expressed ion channels between L5 ET-1 Chrna6 and L5 ET-3 Stac. L5 ET-2 also shown for comparison. e, Relationship between the width of the basal dendrites and the maximum branch order of the apical dendrite. Colors indicate the L5 ET Tx PC-1 value; see (f) for color scale. f, Example L5 ET morphologies (top) ordered by their Tx PC-1 values (bottom). g, Example responses to hyperpolarizing and depolarizing current steps from L5 NP cells. h, Example L5 NP morphologies. i, Comparison of input resistance (left) and basal dendrite maximum path distances (right) across L5 MET-types. L5 NP cells had significant differences in input resistance to all other classes except L5 IT-1 (post hoc Dunn’s test p = 3.4 × 1030 to 1.3 × 10⁷ following K-W test p = 3.8 × 1061), and significant differences in path distances to all others but L5 IT-2 Pld5 (post hoc Dunn’s test p = 3.1 × 10¹² to 0.018 following K-W test p = 2.3 × 10¹¹). j, Correlations between L6 CT Tx PCs and electrophysiology/morphology features. k, Relationship between L6 CT Tx PC-1 and the first sparse principal component (sPC-1) of the step subthreshold responses. l, Average responses to 90 pA current steps grouped by L6 CT Tx PC-1. m, Relationship between L6 CT Tx PC-2 and the maximum path distance within the apical dendrite. n, Example L6 CT morphologies (top) ordered by their Tx PC-2 values (bottom). o, Correlations between L6b (L6b-1, L6b-2 Ngf and L6b-3) Tx PCs and electrophysiology/morphology features. p, Relationship between L6b Tx PC-2 and upstroke/downstroke ratio sPC-1. q, Average upstroke/downstroke ratio by AP number grouped by L6b Tx PC-2. r, Relationship between L6b Tx PC-1 and instantaneous firing frequency sPC-3. s, Example initial responses to depolarizing current steps from each L6b MET-type. t, Average instantaneous firing frequencies versus ISI index grouped by L6b Tx PC-1. u, Relationship between L6b Tx PC-1 and number of branches in the apical dendrite. v, Example L6b morphologies (top) ordered by their Tx PC-1 values (bottom).
Figure 4:
Figure 4:. Local morphology and long-range projections of predicted VISp MET-types.
a, Example WNMs of predicted MET-types registered to CCFv3. b, UMAP based on principal components of dendritic morphology and soma location, colored by MET-type. WNMs are also circled in black. c, Local morphologies of predicted MET-types shown in (a). Example morphologies were selected by calculating a pairwise similarity score for dendrites, local axon, and laminar location. Dendrites of example neurons appear in MET-type colors. Local axon appears in gray. Starred neurons indicate the reconstructions that were generated based on T-type-specific Chrna6-IRES2-FlpO mice. d, UMAP based on principal components of dendritic and local axon morphology and soma location, colored by MET-type (WNMs only). e, Binary projection target matrix ordered first by MET-type and then by normalized cortical depth. Transgenic mouse line and soma depth are also indicated with a color bar at the top. Histograms at the bottom show the total number of targets per neuron. A ”target” was defined as a CCFv3 brain region containing a branch node or tip. Targets shown were contacted either by at least three neurons or at least two neurons from the same MET-type. A full projection target matrix appears in Supplementary Data Table 1. Stars indicate ”local” neurons that do not project out of their soma region. f, Box-and-whisker plots showing the average number of targets per MET-type. To determine significant differences in the number of MET-type targets, Kruskal-Wallis tests were performed followed by post-hoc Dunn tests. g, Projection target histogram summaries ordered by MET-type. Mean (lines) +/− SEM (shaded regions).
Figure 5:
Figure 5:. Local morphology and long-range projections of predicted MET-types in higher visual areas (HVAs), compared to VISp.
a, Top: UMAP based on principal components of dendritic and local axon morphology. HVA neurons are colored by MET-type; VISp neurons appear in gray. Middle: VIS cortical flatmap colored by structure. Bottom: UMAP based on principal components of dendritic and local axon morphology. HVA neurons are colored by soma location; VISp neurons appear in gray. Only WNMs shown in top and bottom. b, WNM of example neurons registered to CCFv3 by predicted IT MET-types and non-IT MET-types. c, Example local morphologies of predicted IT MET-types and non-IT MET-types in different VIS brain regions. Dendrites appear in MET-type colors. Local axon, which was not collected for the Patch-seq dataset, appears in gray. Only abundantly represented MET-types are shown in the figure. d, Binary projection target matrices for IT MET-types. Matrix is ordered first by MET-type, then by brain region sorted by the smallest to largest number of projection targets per region. Transgenic mouse line and soma depth are also indicated with a color bar at the top of the matrix. Histograms at the bottom show the total number of targets per neuron. e, Binary projection target matrices for non-IT MET-types. Matrix is ordered first by MET-type, then by brain region sorted by the smallest to largest number of projection targets per region. Transgenic mouse line and soma depth are also indicated with a color bar at the top of the matrix. Histograms at the bottom show the total number of targets per neuron. f, Scatter plots illustrating the relationship between local axon total length and the number of projection targets for IT MET-types in VISp and HVA neurons.
Figure 6:
Figure 6:. Projection target prediction using multimodal properties.
a, Dendritic features that were highly correlated with the transcriptomic PCs described in Figs. 2 and 3 were used to calculate a dendritic PC for each MET-type. b-e, Morphologies from Patch-seq and WNM ordered and colored by dendritic PC value. Correlations between dendritic PC and transcriptomic PC are shown for Patch-seq neurons. Correlations between dendritic PC and local axon features are shown for WNM neurons. f, Types of logistic regression models used to predict whether WNM neurons project to specific targets (left) and pseudo-R2 values for the selected models (right). Models were selected by Akaike information criterion (Methods). g, MET-type odds ratios for models that used MET-type to predict projection targets. Higher odds ratios represent higher probabilities of projection associated with those MET-types. Odds ratios were defined relative to L2/3 IT (always set to 1). h, Effects of transcriptomic-correlated dendritic PCs on projection probabilities. Higher values of the L5 ET dendritic PC were associated with a higher chance of projecting to CP and PG. Lower values of the L6 CT dendritic PC were associated with a higher chance of projecting to LP and LD thalamus. i, Effects of cortical surface location on projections to different cortical and subcortical targets.
Figure 7:
Figure 7:. Predicting target projections for MET-types.
a, Predicted probabilities of projecting to cortical targets for L4/L5 IT neurons. Probabilities are predicted at different VISp locations (left) and for different transcriptomic-correlated dendritic PC values (right). Example neurons (right, above) were chosen at low, medium, and high values of the dendritic PC range for projection probability calculations. b, Predicted probabilities of projecting to cortical and subcortical targets for L5 ET-3 Stac neurons. The effects of VISp location and dendritic PC are shown as in (a). c, Summary of the effects of location and dendritic PC variation by MET-type. Probability ranges for major structures (cortex, striatum, thalamus, midbrain, and hindbrain) were calculated by averaging the lowest and highest predictions across the regions belonging to the structure, either by varying location (second column) or dendritic PC (third column). The rightmost column summarizes the morphological features that vary along the relevant dendritic, the genes inferred to vary by the corresponding Tx PC, and the distributions of dendritic PC values by MET-type.

References

    1. Golgi C. Sulla strutura della sostanza grigia del cervello. Gazzeta Medica Italiana, Lombardia. 33, 244–246 (1873).
    1. Cajal S R. y. Histologie du système nerveux de l’homme et des vertébrés (1911).
    1. Yao Z. et al. A high-resolution transcriptomic and spatial atlas of cell types in the whole mouse brain preprint (bioRxiv, 2023). - PMC - PubMed
    1. Dorkenwald S. et al. CAVE: Connectome Annotation Versioning Engine preprint (Neuroscience, 2023).
    1. Gao L. et al. Single-neuron projectome of mouse prefrontal cortex. Nature Neuroscience 25, 515–529 (2022). - PubMed

Publication types