[Preprint]. 2024 Jan 16:2023.12.13.571566.
doi: 10.1101/2023.12.13.571566.

ROR2 regulates cellular plasticity in pancreatic neoplasia and adenocarcinoma

Affiliations

ROR2 regulates cellular plasticity in pancreatic neoplasia and adenocarcinoma

Simone Benitz et al. bioRxiv. .

Update in

  • ROR2 Regulates Cellular Plasticity in Pancreatic Neoplasia and Adenocarcinoma.
    Benitz S, Steep A, Nasser MM, Preall J, Mahajan UM, McQuithey H, Loveless I, Davis ET, Wen HJ, Long DW, Metzler T, Zwernik S, Louw M, Rempinski D, Salas-Escabillas DJ, Brender SM, Song L, Huang L, Theisen BK, Zhang Z, Steele NG, Regel I, Bednar F, Crawford HC. Benitz S, et al. Cancer Discov. 2024 Nov 1;14(11):2162-2182. doi: 10.1158/2159-8290.CD-24-0137. Cancer Discov. 2024. PMID: 38975886 Free PMC article.

Abstract

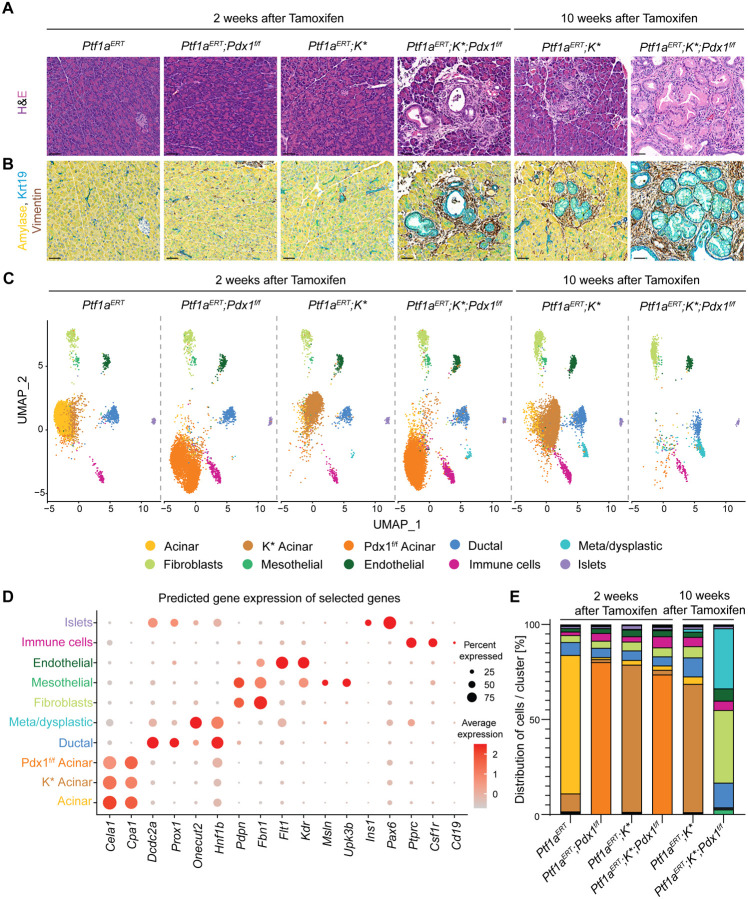
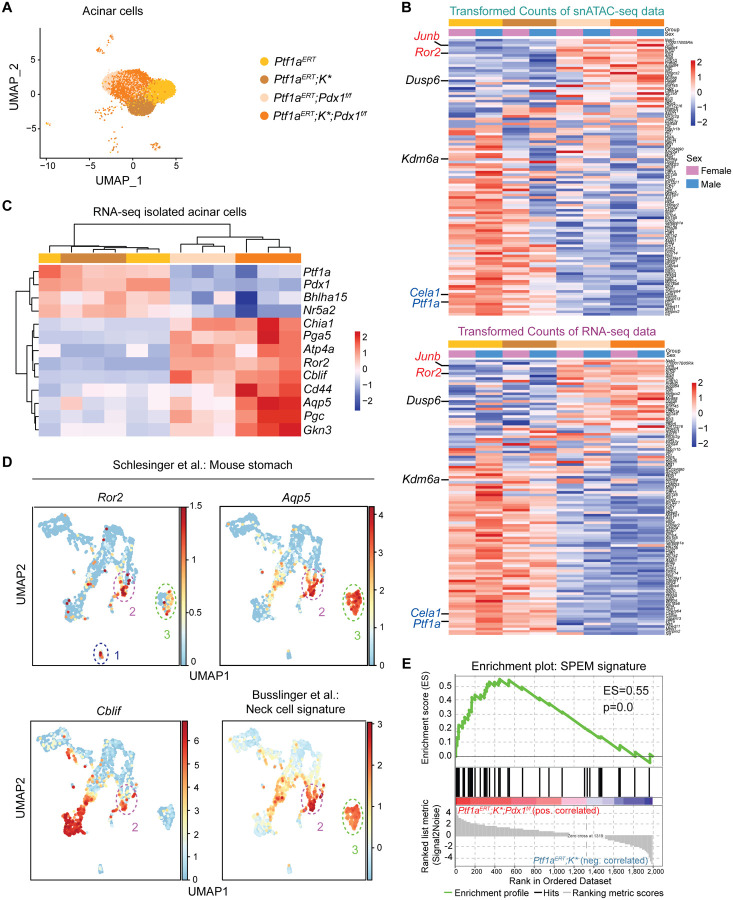
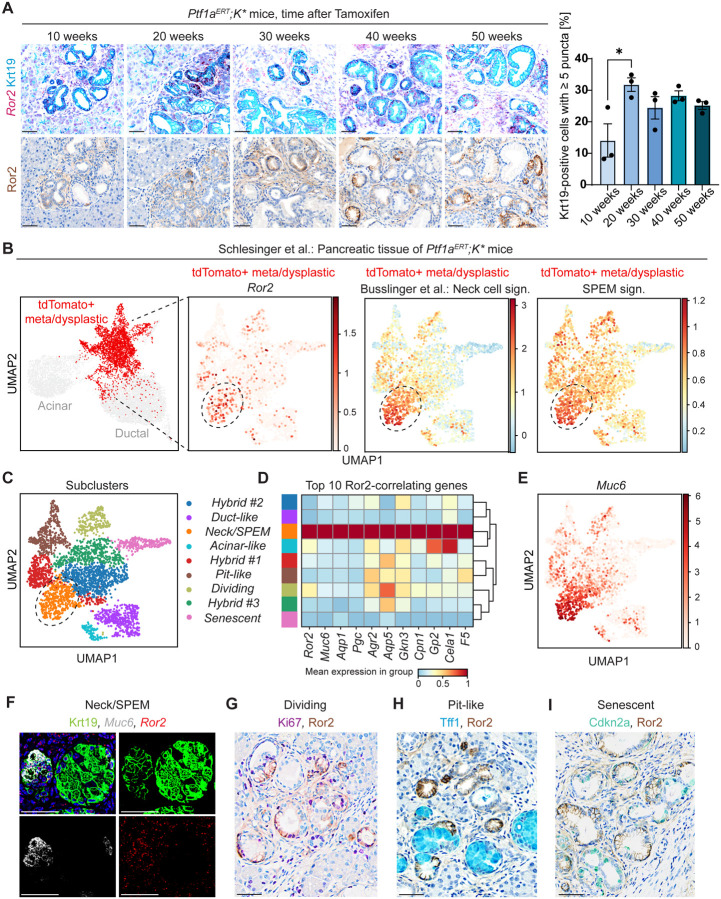
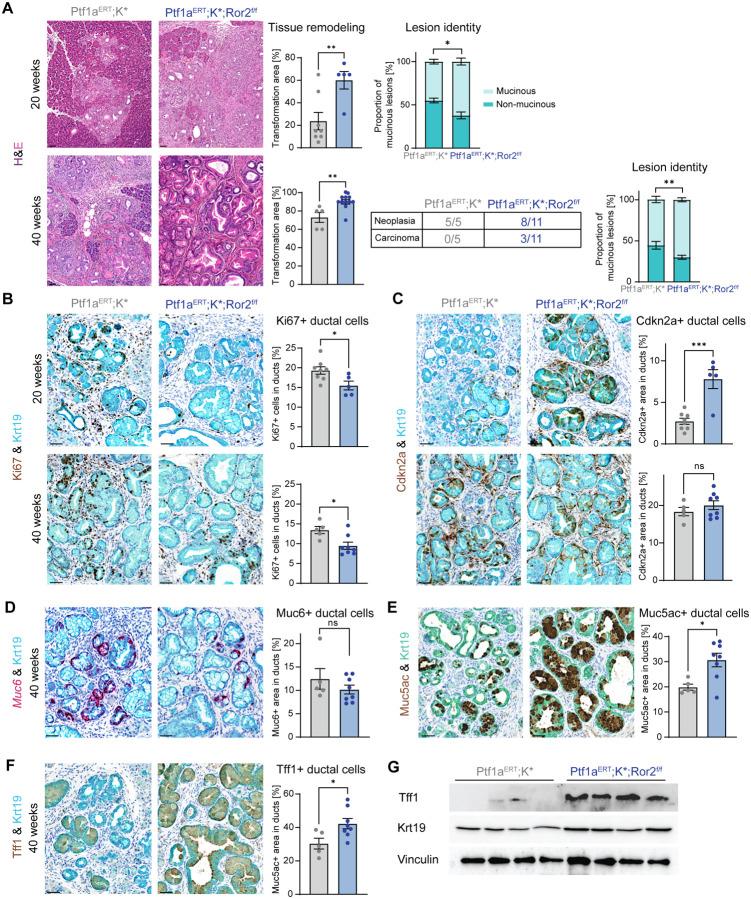
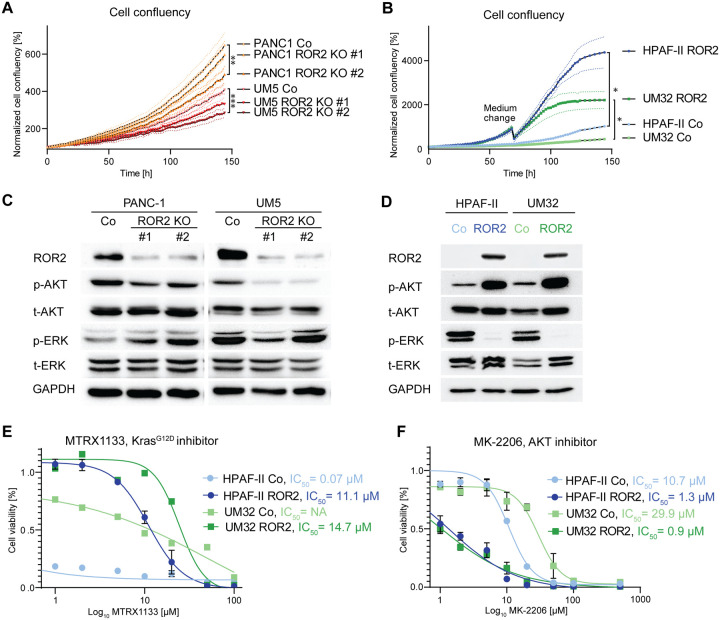
Cellular plasticity is a hallmark of pancreatic ductal adenocarcinoma (PDAC) starting from the conversion of normal cells into precancerous lesions to the progression of carcinoma subtypes associated with aggressiveness and therapeutic response. We discovered that normal acinar cell differentiation, maintained by the transcription factor Pdx1, suppresses a broad gastric cell identity that is maintained in metaplasia, neoplasia, and the classical subtype of PDAC in mouse and human. We have identified the receptor tyrosine kinase Ror2 as marker of a gastric metaplasia (SPEM)-like identity in the pancreas. Ablation of Ror2 in a mouse model of pancreatic tumorigenesis promoted a switch to a gastric pit cell identity that largely persisted through progression to the classical subtype of PDAC. In both human and mouse pancreatic cancer, ROR2 activity continued to antagonize the gastric pit cell identity, strongly promoting an epithelial to mesenchymal transition, conferring resistance to KRAS inhibition, and vulnerability to AKT inhibition.


Conflict of interest statement

The authors declare no potential conflicts of interest.

Figures

Fig. 1:
Fig. 1:
(A) Representative H&E staining of indicated mouse genotypes. Eight- to 9-week-old animals were given Tamoxifen to induce CreERT-mediated recombination and were sacrificed 2 and 10 weeks later. Scale bars, 50 μm. (B) Representative multiplex IHC staining for Amylase (yellow), Krt19 (teal) and Vimentin (brown). Scale bars, 50 μm. (C) Unsupervised clustering of snATAC-seq data from indicated mouse genotypes (n=2 each), represented as UMAP plots. Indicated cell types were identified. (D) Dot plot showing average gene expression and percentage of cells expressing selected marker genes across all identified clusters. (E) Percentage distribution of nuclei in each annotated cell cluster was determined over the total amount of nuclei in each genotype and time point (n=2).
Fig. 2:
Fig. 2:
(A) UMAP analysis depicting acinar cell clusters from indicated mouse genotypes, 2 weeks post Tamoxifen. (B) Heatmaps showing expression levels of genes, that showed highest correlation in both snATAC-seq (upper panel) and bulk RNA-seq datasets (lower panel). Expression levels are represented by color coding. (C) Heatmap depicting mRNA expression of selected acinar and gastric lineage genes. (D) UMAP plots using scRNA-seq data from mouse stomach cells (Schlesinger et al.) with gastric cell type signature annotation (Busslinger et al.). (E) Gene set enrichment analysis results for SPEM signature comparing Ptf1aERT;K* and Ptf1aERT;K*;Pdx1f/f acinar cells.
Fig. 3:
Fig. 3:
(A) Representative images of Ror2 RNA-ISH in combination with Krt19 IHC (upper panel) and Ror2 IHC (lower panel) of pancreatic tissue from Ptf1aERT;K* mice harvested at indicated time points post Tamoxifen. Scale bars, 50 μm. Percentage of Krt19-positive cells with ≥ 5 positive puncta was quantitated. All data are presented as mean ± SEM; p-values were calculated by two-tailed, unpaired Student’s t-test; * p < 0.05. (B) UMAP analysis depicting epithelial cell clusters of Ptf1aERT;K* mice (left panel), Schlesinger et al. scRNA-seq data. TdTomato-positive meta/dysplastic cells were subsetted and Ror2 expression and enrichment of gastric neck and SPEM cell signature is shown. (C) UMAP analysis illustrating subcluster identities of tdTomato-positive meta/dysplastic cells after integration with Harmony. (D) Heatmap representing expression of Ror2 and of top 10 most significantly Ror2-correlating genes across identified Harmony clusters. (E) UMAP analysis showing expression of Muc6. (F) Multiplex IF and RNA-ISH staining for Krt19 (green), Muc6 (white) and Ror2 (red) on tissue of a Ptf1aERT;K* mouse, 20 weeks post Tamoxifen. (G) Image showing Ki67 (purple) and Ror2 (brown) IHC. (H) Dual IHC depicting Tff1 (teal) and Ror2 (brown) staining. (I) Cdkn2a (green) and Ror2 (brown) dual IHC staining. For all staining, representative images are depicted. Scale bars, 50 μm.
Fig. 4:
Fig. 4:
(A) H&E staining of Ptf1aERT;K* and Ptf1aERT;K*;Ror2f/f mice, 20 and 40 weeks after Tamoxifen administration. Tissue remodeling and number of mucinous and non-mucinous lesions were quantified (n=5–11). (B) Dual IHC staining for Ki67 (brown) and Krt19 (teal). (C) Images depicting dual Cdkn2a (brown) and Krt19 (teal) IHC staining. (D) Multiplex RNA-ISH and IHC staining detecting Muc6 mRNA expression (red) and Krt19 (teal) in mice, sacrifized 40 weeks post Tamoxifen. (E) Dual IHC staining for Muc5ac (brown) and Krt19 (green). (F) Images showing Tff1 (brown) and Krt19 (teal) dual IHC. (G) Immunoblot analysis for Tff1 and Krt19 from protein lysates of Ptf1aERT;K* and Ptf1aERT;K*;Ror2f/f mice, sacrificed 40 weeks post Tamoxifen (n=4). Vinculin served as loading control. For all staining, representative images are depicted. Scale bars, 50 μm. Staining were quantified with HALO software and all data are presented as mean ± SEM; p-values were calculated by two-tailed, unpaired Student’s t-test; * p < 0.05, ** p < 0.01, *** p < 0.001.
Fig. 5:
Fig. 5:
(A) Representative images of dual IHC staining for Tff1 (teal) and Ror2 (brown) on tissue of KPC mice. Scale bars, 50 μm. (B) Pearson correlation scatter plots showing correlation of Ror2 to Tff1 gene expression in pancreatic cancer cell lines. RNA-seq data from Mueller et al., correlation coefficient and p-value are indicated. (C) Heatmap depicting expression of top 50 most enriched genes in meta/dysplastic pit-like cells (Schlesinger et al.) in pancreatic cancer cell lines (Mueller et al.). PDAC subtype annotation was performed with gene signatures from Moffitt et al.. (D) UMAP plots indicating expression signatures of meta/dysplastic pit-like cells and indicated PDAC subtypes retrieved from Ragharan et al. in 174 human scRNA-seq PDAC samples. (E) Heatmap using RNA-seq data from Mueller et al., showing expression of top 50 genes that most significantly positively or negatively correlate with Ror2. For subtype annotation, gene signatures from Moffitt et al. were used. (F) Correlation of Ror2 expression to indicated genes was determined by Pearson correlation. RNA-seq data from Mueller et al. was used.
Fig. 6:
Fig. 6:
(A) Representative brightfield images of ROR2 IHC staining on human PDAC tissue. Scale bars, 50 μm. (B) Correlation plots showing correlation of ROR2 mRNA expression to indicated genes in micro-dissected, epithelial PDAC compartment using RNA-sequencing data from Maurer et al.. (C) mRNA expression of ROR2, ZEB1, VIM, and CDH1 was determined in indicated human PDAC and organoid lines by performing qRT-PCR. Expression values were calculated in relation to the housekeeper gene GAPDH (n=3). (D) Representative immunoblot analysis of indicated proteins using protein lysates of HPAF-II, UM32, PANC1 and UM5 cells. GAPDH served as loading control. (E) Brightfield images of control and ROR2-overexpressing HPAF-II and UM32 cells (upper panel). Scale bars, 200 μm. Immunofluorescence staining for CDH1 (green), VIM (red) and nuclei (Hoechst 33342, blue) of indicated cell lines (lower panel). Scale bars, 37.6 μm. (F) Representative immunoblot analysis detecting ROR2, VIM, ZEB1 and CDH1 protein levels in control and ROR2-overexpressing HPAF-II and UM32 cells. GAPDH served as loading control. (G) Transcriptomic signatures of control and ROR2-overexpressing HPAF-II and UM32 cells were compared to EMT score, established by Groger et al.. p-values were calculated by Mann-Whitney test. (H) Sphere forming efficiency of control and ROR2-overexpressing HPAF-II and UM32 cells is depicted as number of spheres in relation to total number of seeded wells (n=3). Diameter for every sphere was determined. Data are presented as mean ± SEM; p-values were calculated by two-tailed, unpaired Student’s t-test; * p < 0.05, **** p < 0.0001.
Fig. 7:
Fig. 7:
(A) Cell confluency of PANC1 and UM5 control and ROR2 knockout cells using two different guide RNAs (ROR2 KO #1, ROR2 KO #2) was measured every 2 hours over a period of 6 days (n=4). Each data point was calculated as relative cell confluency in relation to the first measurement. Statistical significance was determined for the last measurement. (B) Cell confluency of control and ROR2-overexpressing HPAF-II and UM32 cells was monitored for a total of 6 days. (C) Representative immunoblot analysis for ROR2 and indicated signaling proteins in PANC1 and UM5 control and ROR2 knockout cells. GAPDH served as loading control. (D) Representative immunoblot analysis showing expression levels and phosphorylation status of indicated signaling pathway regulators in control and ROR2-overexpressing HPAF-II and UM32 cells. GAPDH served as loading control. (E) Control and ROR2-overexpressing HPAF-II and UM32 cells were treated with increasing concentrations of KrasG12D inhibitor MRTX1133 and dose-response curves were established (n=3). IC50 was calculated. (F) Dose-response curves after treating control and ROR2-overexpressing HPAF-II and UM32 cells with indicated concentrations of AKT inhibitor MK-2206 (n=3). For each cell line, IC50 was determined. Unless stated otherwise, all data are presented as mean ± SEM; p-values were calculated by two-tailed, unpaired Student’s t-test; * p < 0.05, ** p < 0.01, *** p < 0.001.

References

    1. Aung K.L., et al., Genomics-Driven Precision Medicine for Advanced Pancreatic Cancer: Early Results from the COMPASS Trial. Clin Cancer Res, 2018. 24(6): p. 1344–1354. - PMC - PubMed
    1. Werba G., et al., Single-cell RNA sequencing reveals the effects of chemotherapy on human pancreatic adenocarcinoma and its tumor microenvironment. Nat Commun, 2023. 14(1): p. 797. - PMC - PubMed
    1. O'Kane G.M., et al., GATA6 Expression Distinguishes Classical and Basal-like Subtypes in Advanced Pancreatic Cancer. Clin Cancer Res, 2020. 26(18): p. 4901–4910. - PubMed
    1. Krebs A.M., et al., The EMT-activator Zeb1 is a key factor for cell plasticity and promotes metastasis in pancreatic cancer. Nat Cell Biol, 2017. 19(5): p. 518–529. - PubMed
    1. Shields M.A., et al., Snail cooperates with KrasG12D to promote pancreatic fibrosis. Mol Cancer Res, 2013. 11(9): p. 1078–87. - PMC - PubMed

Publication types