[Preprint]. 2023 Dec 13:2023.12.12.571332.
doi: 10.1101/2023.12.12.571332.

Keratinocyte Piezo1 drives paclitaxel-induced mechanical hypersensitivity

Affiliations

Keratinocyte Piezo1 drives paclitaxel-induced mechanical hypersensitivity

Alexander R Mikesell et al. bioRxiv. .

Update in

Abstract

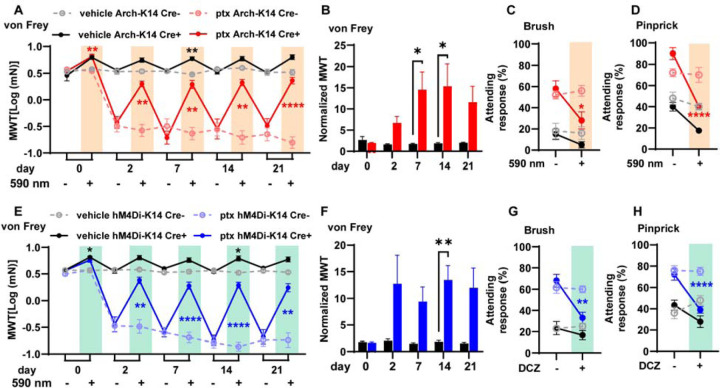
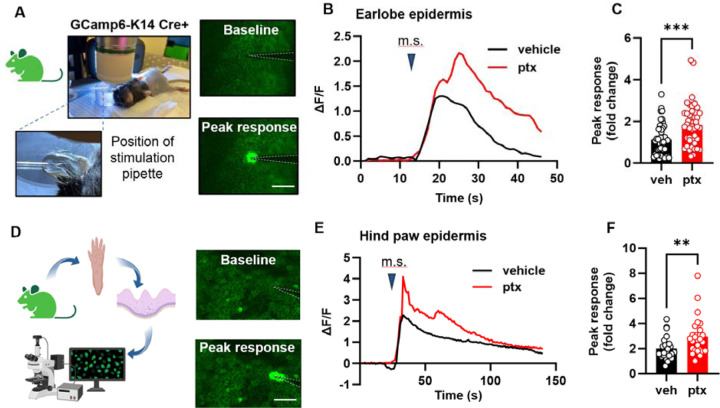
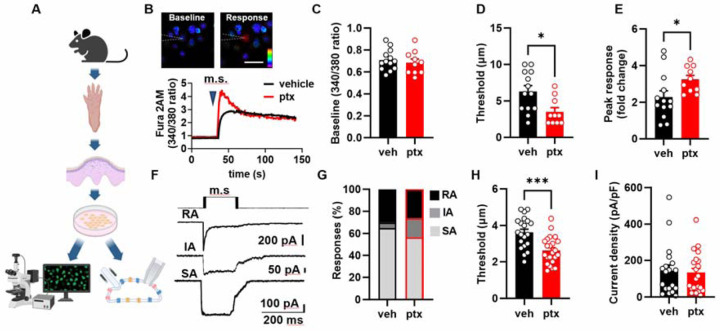
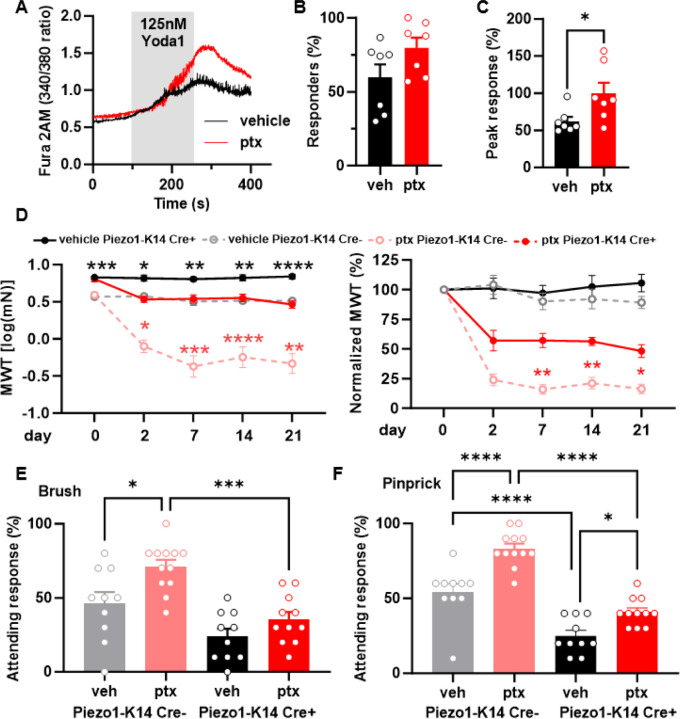
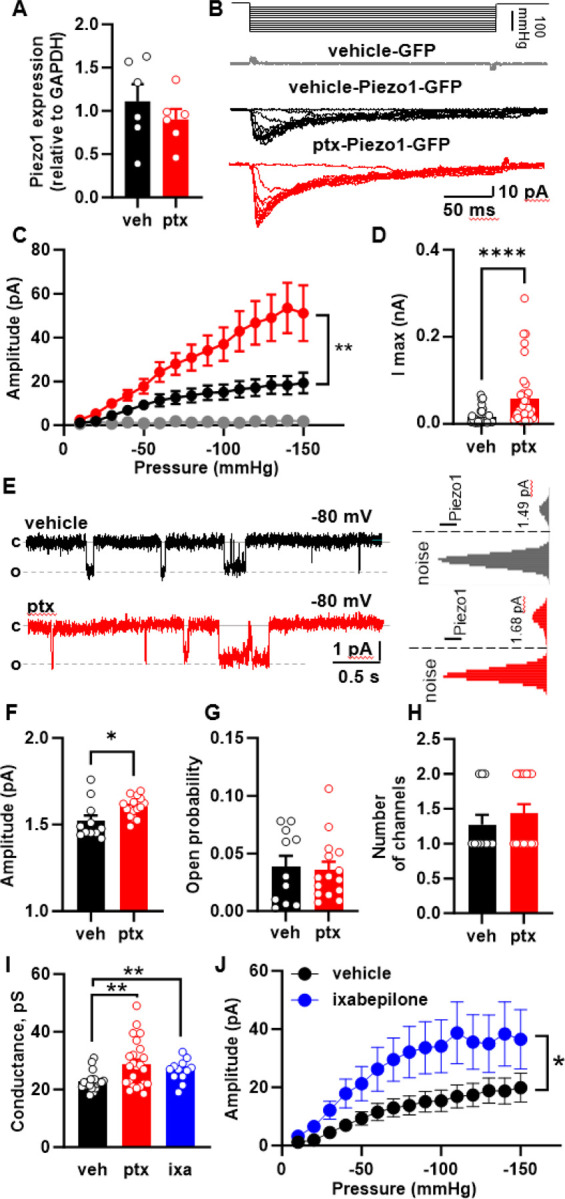
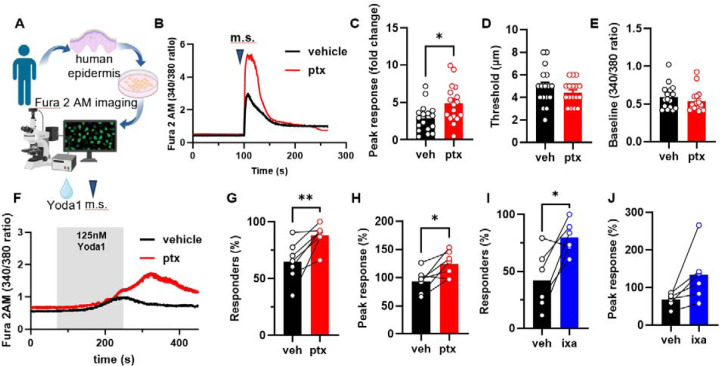
Recent work demonstrates that epidermal keratinocytes are critical for normal touch sensation. However, it is unknown if keratinocytes contribute to touch evoked pain and hypersensitivity following tissue injury. Here, we used inhibitory optogenetic and chemogenetic techniques to determine the extent to which keratinocyte activity contributes to the severe neuropathic pain that accompanies chemotherapeutic treatment. We found that keratinocyte inhibition largely alleviates paclitaxel-induced mechanical hypersensitivity. Furthermore, we found that paclitaxel exposure sensitizes mouse and human keratinocytes to mechanical stimulation through the keratinocyte mechanotransducer Piezo1. These findings demonstrate the contribution of non-neuronal cutaneous cells to neuropathic pain and pave the way for the development of new pain-relief strategies that target epidermal keratinocytes and Piezo1.


Figures

Fig. 1.
Fig. 1.. Alleviation of paclitaxel-induced mechanical hypersensitivity through optogenetic and chemogenetic inhibition of keratinocytes:
(A) Comparison of mechanical withdrawal thresholds (MWT) for Arch-K14 Cre+ and Arch-K14 Cre- mice, pre- and post-paclitaxel or vehicle initiation; sample size: n = 7–10. (B) Fold change in withdrawal thresholds at each experimental day for vehicle treated Arch-K14 Cre+ and paclitaxel treated Arch-K14 Cre+ animals. Attending responses to dynamic brush (C) and noxious needle (D) hind paw stimuli, 10 days post-paclitaxel initiation, for both Arch-K14 Cre+ and Arch-K14 Cre- groups; n = 4–5. (E) Mechanical withdrawal thresholds (MWT) of both hM4Di-K14 Cre+ and hM4Di-K14 Cre- mice, assessed before (baseline) and following paclitaxel or vehicle administration; n = 9–12. (F) Fold change in withdrawal thresholds at each experimental day for vehicle treated hM4Di-K14 Cre+ and paclitaxel treated hM4Di-K14 Cre+ animals. (G) Attending responses to dynamic brush (on the left) and noxious needle (on the right) hindpaw stimulation, gauged 10 days post-paclitaxel administration, for hM4Di-K14 Cre+ and hM4Di-K14 Cre- cohorts; n = 9–12. Statistical analysis for (A, C, D, E, G, and H) was performed using a 3 way ANOVA with Tukey’s multiple comparisons tests; for (B and F) using a 2 way ANOVA with Tukey’s multiple comparisons tests *P < 0.05, **P < 0.01, ***P < 0.001, and ****P <0.0001. Error bars represent SE. For (A, C, D, E, G, and H) Black asterisks represent comparisons between vehicle treated animals while red or blue asterisks represent comparisons between paclitaxel treated animals. Schematic created with BioRender.com.
Fig. 2.
Fig. 2.. Paclitaxel treatment sensitizes the mouse epidermis to mechanical stimulation.
(A) Visual representation and example fluorescent images of the in vivo mechanical calcium imaging setup used on the earlobe skin of GCamp6-K14 Cre+ mice. (B) Example traces illustrating calcium responses induced by mechanical stimulation (m.s.) in earlobe skin. (C) Comparative analysis of peak calcium responses to mechanical stimuli of earlobe skin in paclitaxel (ptx) and vehicle-treated mice. Data was sourced from 4 mice per group, with 5–15 recordings per mouse (totaling 45–46 recordings per treatment group). (D) Diagram showcasing the experimental approach for in situ calcium imaging on paw keratinocytes. Hindpaw skin from GCamp6-K14 Cre+ mice underwent dissection, with the epidermis subsequently separated from the dermis for imaging purposes (left). Fluorescence images of the paw epidermis both at baseline and immediately following mechanical stimulation (right). (E) Representative traces displaying calcium responses induced by mechanical stimulation (m.s.) in the hind paw epidermis. (F) Comparative analysis of peak calcium responses to mechanical stimuli of hind paw epidermis of paclitaxel (ptx) and vehicle-treated mice (right). Data comprises recordings from 5 mice per group, with 5 recordings taken per mouse (yielding 25 recordings for each treatment group). Scales are 50 μm. Statistical analysis was performed using Student’s T test; **P < 0.01, and ***P < 0.001. Error bars represent SE. Schematic created with BioRender.com.
Fig. 3.
Fig. 3.. Paclitaxel treatment lowers the threshold of keratinocyte activation by mechanical stimulation:
(A) Diagram illustrating the procedure to isolate keratinocytes from the mouse hindpaw epidermis for subsequent calcium imaging and patch clamp electrophysiology studies. (B) Representative traces accompanied by images illustrating mechanically activated calcium responses. The position of the stimulation electrode is depicted with dashed lines. The time of mechanical stimulation (m.s) is shown as a triangle. The scale is 20 μm. (C) Baseline 340/380 fluorescence ratio of keratinocytes derived from mice treated with either paclitaxel (ptx) or vehicle. (D) Activation threshold for the mechanically induced calcium responses. (E) Amplitude of mechanically activated calcium responses, normalized to baseline 340/380 ratio. (F) Example traces showcasing the variations in adaptation rates (rapidly adapting (RA), intermediately adapting (IA), and slowly adapting (SA)) of whole-cell currents induced by membrane indentation (schematic protocol of mechanical stimulation (m.s) is presented on A). Comparative analysis of the distribution of different types (G), activation threshold (H), and density (I) of mechanically-activated currents recorded from keratinocytes isolated from vehicle and paclitaxel-treated mice. Statistical analysis was performed using Student’s t-test; For (G) a chi-square test with Fischer’s Exact post-hoc test was performed *P < 0.05, and ***P < 0.001. Error bars represent SE. Schematic created with BioRender.com.
Fig. 4.
Fig. 4.. Epidermal Piezo1 mediates paclitaxel-induced mechanical hypersensitivity.
(A) Representative traces showcasing calcium responses evoked by Yoda1 (125 nM) in keratinocytes derived from either vehicle or paclitaxel-treated mice. (B) The proportion of keratinocytes exhibiting a response to Yoda1. Dots depict the average count of responsive keratinocytes per mouse. (C) Magnitude of the calcium response to Yoda1. Dots depict the average peak calcium response observed in keratinocytes for each animal (n = 7, 60–100 cells per animal). (D) Comparison of mechanical withdrawal thresholds between Piezo1-K14 Cre+ and Piezo1-K14 Cre- mice, both before and after paclitaxel or vehicle treatment (left). Mechanical withdrawal threshold data normalized to baseline values (right); data sourced from 9–12 mice. Evaluation of responses to dynamic brush (E) and to the noxious needle (pinprick, F) hindpaw stimuli, at day 10 post-paclitaxel injection, in both Piezo1-K14 Cre+ and Piezo1-K14 Cre- groups; sample size: n = 9–12. Statistical analysis for (B and C) was performed using a Student’s T test; for (D) using a 3 way ANOVA with Tukey’s multiple comparisons test; for (E and F) using a 2 way Anova with Tukey’s multiple comparisons test. *P < 0.05, **P < 0.01, ***P < 0.001, and ****P< 0.0001. Error bars represent SE. For figure (D), black asterisks represent comparisons between vehicle treated animals while red asterisks represent comparisons between paclitaxel treated animals. Schematic created with BioRender.com.
Fig. 5.
Fig. 5.. Effect of microtubule-stabilizing drugs on Piezo1 expression and activity.
(A) Piezo1 expression in epidermis of mice treated with paclitaxel or vehicle. (B) Representative cell-attached recordings of stretch-activated currents induced by a stepwise increase of negative pressure in the patch pipette at Vhold = −80 mV. Recordings were made from HEK-P1KO cells expressing GFP (grey –vehicle) and Piezo1-GFP in vehicle (black), and paclitaxel (red) pretreated cells. (C) Current-pressure relationship of stretch-activated currents recorded from HEK-P1KO cells expressing GFP (grey, n=6) and Piezo1-GFP in vehicle- (black, n=36) and paclitaxel treated (red, n=39) cells at a Vhold = −80 mV. (D) The maximal amplitude of stretch-activated Piezo1 current recorded in the vehicle (black, n = 36), and paclitaxel (red, n=39) pretreated HEK-P1KO cells. (E) Representative cell-attached recordings of spontaneous single-channel Piezo1 activity in the vehicle- and paclitaxel-treated HEK-P1KO cells with corresponding all-point amplitude histograms. (F-H) Summary graphs of single-channel Piezo1 amplitude, open probability, and number of channels recorded from vehicle- and paclitaxel-treated HEK-P1KO cells at Vhold= −80 mV. (I) Effect of paclitaxel and ixabepilone treatment on Piezo1 conductance. (J) Current-pressure relationship of stretch-activated currents recorded from Piezo1 expressing HEK-P1KO cells treated with vehicle- (black, n=36) or ixabepilone (1 μM, blue=20). Recordings were made at a Vhold = −80 mV. Statistical analysis for (C and J) was performed using 2way ANOVA with Tukey’s multiple comparisons tests; for (D and H) using the Mann-Whitney test, and for (A, F, G and I) using Student’s t test. Error bars, ± SEM. *P < 0.05, **P < 0.01, and ****P < 0.0001.
Fig. 6.
Fig. 6.. Human keratinocytes are sensitized to mechanical stimulation and Yoda1 activation following direct paclitaxel and ixabepilone exposure.
(A) Schematic of human keratinocyte isolation from tissue donor samples and subsequent Fura 2 calcium imaging. (B) Representative traces of calcium responses evoked by mechanical stimulation (m.s.) in paclitaxel or vehicle-treated human keratinocytes (keratinocytes were treated with 1 μM paclitaxel or vehicle for 30 minutes before imaging). (C) Amplitude of mechanically activated calcium responses. (D) Activation threshold for the mechanically induced calcium responses. (E) Baseline 340/380 fluorescence ratio recorded from human keratinocytes incubated with paclitaxel or vehicle. (F) Example traces of Yoda1 (125 nM) evoked calcium responses in human paclitaxel or vehicle-treated keratinocytes. The time of Yoda1 application is depicted with a grey box. (G) Proportion of human keratinocytes treated with paclitaxel or vehicle exhibiting a response to Yoda1. (H) Magnitude of the calcium response to Yoda1 in human keratinocytes treated with paclitaxel or vehicle (right). (I) Proportion of human keratinocytes treated with ixabepilone or vehicle exhibiting a response to Yoda1. (J) Magnitude of the calcium response to Yoda1 in human keratinocytes treated with ixabepilone or vehicle. Dots depict the average peak calcium response observed in keratinocytes for each human sample (n = 6–7, 25–120 cells per n). Connecting lines depict cells from the same human donor in two different treatment conditions. Statistical analysis for (C-E) was performed using a Student’s t test, and for (G-J) using a paired Student’s t test. Error bars, ± SEM. *P < 0.05, **P < 0.01, and ****P < 0.0001.

References

    1. Yared J. A. & Tkaczuk K. H. R. Update on taxane development: new analogs and new formulations. Drug Des. Devel. Ther. 6, 371–384 (2012). - PMC - PubMed
    1. Marupudi N. I. et al. Paclitaxel: a review of adverse toxicities and novel delivery strategies. Expert Opin. Drug Saf. 6, 609–621 (2007). - PubMed
    1. Zajączkowska R. et al. Mechanisms of Chemotherapy-Induced Peripheral Neuropathy. Int. J. Mol. Sci. 20, 1451 (2019). - PMC - PubMed
    1. Sibaud V. et al. Dermatological adverse events with taxane chemotherapy. Eur. J. Dermatol. EJD 26, 427–443 (2016). - PMC - PubMed
    1. Li H.-B., Wang W.-H. & Wang Z.-Y. A meta-analysis of the incidence and risk of skin toxicity with nab-paclitaxel and paclitaxel in cancer treatment. Am. J. Transl. Res. 15, 4279–4290 (2023). - PMC - PubMed

Publication types