

This is a preprint.
Empirical phenotyping in coupled patient+care systems: Generating low-dimensional categories for hypothesis-driven investigation of mechanically-ventilated patients
- PMID: 38168309
- PMCID: PMC10760265
- DOI: 10.1101/2023.12.14.23299978
Empirical phenotyping in coupled patient+care systems: Generating low-dimensional categories for hypothesis-driven investigation of mechanically-ventilated patients
Abstract
Background: Analyzing patient data under current mechanical ventilation (MV) management processes is essential to develop hypotheses about improvements and to understand MV consequences over time. However, progress is complicated by the complexity of lung-ventilator system (LVS) interactions, patient-care and patient-ventilator heterogeneity, and a lack of classification schemes for observable behavior.
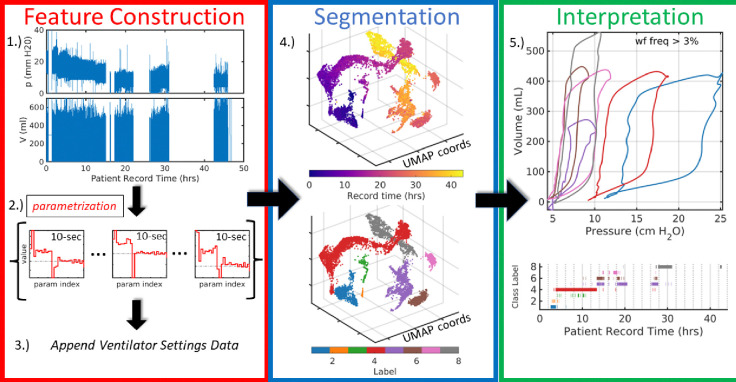
Method: Ventilator waveform data arise from patient-ventilator interactions within the LVS while care processes manage both patient and ventilator settings. This study develops a computational pipeline that segments these joint waveform data and care settings timeseries to phenotype the data generating process. The modular method supports many methodological choices for representing waveform data and unsupervised clustering.
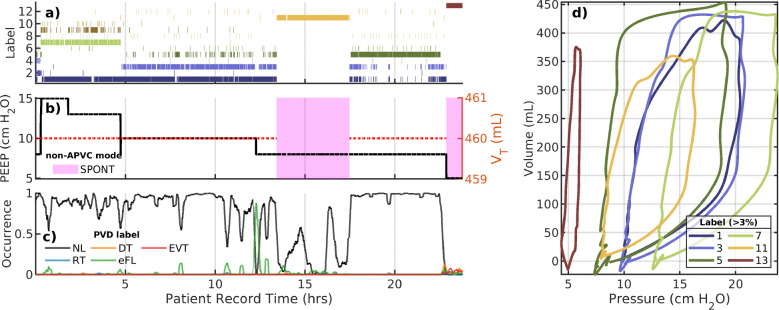
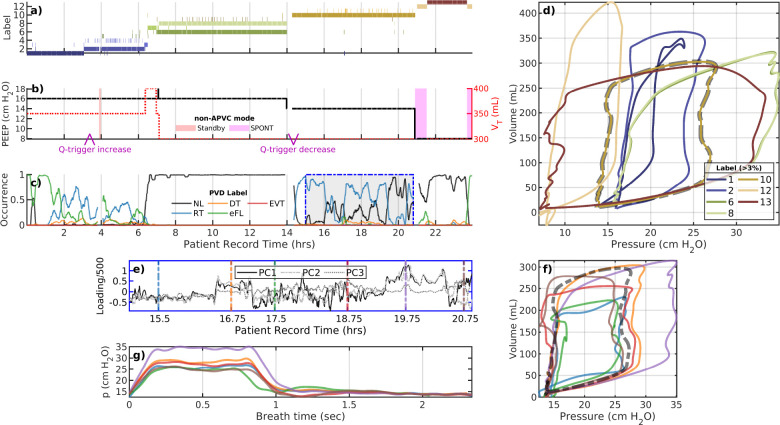
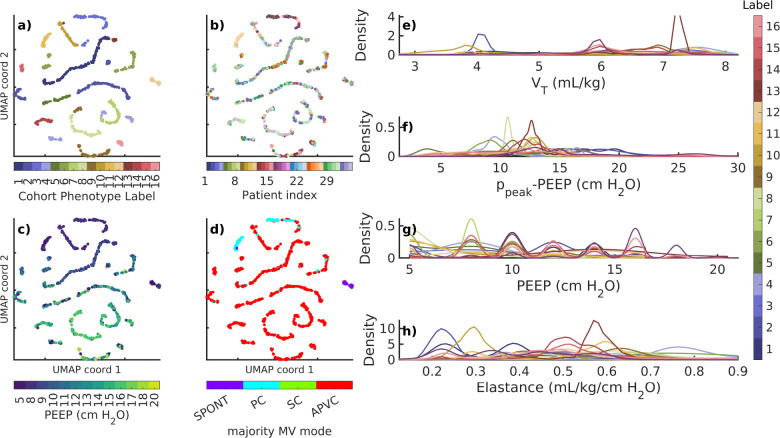
Results: Applied to 35 ARDS patients including 8 with COVID-19, typcially 8[6.8] (median[IQR]) phenotypes capture 97[3.1]% of data using naive similarity assumptions on waveform and MV settings data. Individual phenotypes organized around ventilator mode, PEEP, and tidal volume with additional segmentation reflecting waveform behaviors. Few (< 10% of) phenotype changes tie to ventilator settings, indicating considerable dynamics in LVS behaviors. Evaluation of phenotype heterogeneity reveals LVS dynamics that cannot be discretized into sub-phenotypes without additional data or alternate assumptions. Suitably normalized individual phenotypes may be aggregated into coherent groupings suitable for analysis of cohort data.
Conclusions: The pipeline is generalizable although empirical output is data- and algorithm-dependent. Further, output phenotypes compactly discretize the data for longitudinal analysis and may be optimized to resolve features of interest for specific applications.
Conflict of interest statement
Declarations of Interest None. The authors have no conflicts of interest to disclose.
Figures
Similar articles
-
Ventilation practices in subarachnoid hemorrhage: a cohort study exploring the use of lung protective ventilation.Neurocrit Care. 2014 Oct;21(2):178-85. doi: 10.1007/s12028-014-0014-8. Neurocrit Care. 2014. PMID: 25022805
-
PEEP/ FIO2 ARDSNet Scale Grouping of a Single Ventilator for Two Patients: Modeling Tidal Volume Response.Respir Care. 2020 Aug;65(8):1094-1103. doi: 10.4187/respcare.07931. Respir Care. 2020. PMID: 32712582 Free PMC article.
-
Ventilator waveform interpretation in mechanically ventilated small animals.J Vet Emerg Crit Care (San Antonio). 2011 Oct;21(5):496-514. doi: 10.1111/j.1476-4431.2011.00673.x. J Vet Emerg Crit Care (San Antonio). 2011. PMID: 22316197 Review.
-
High versus low positive end-expiratory pressure (PEEP) levels for mechanically ventilated adult patients with acute lung injury and acute respiratory distress syndrome.Cochrane Database Syst Rev. 2021 Mar 30;3(3):CD009098. doi: 10.1002/14651858.CD009098.pub3. Cochrane Database Syst Rev. 2021. PMID: 33784416 Free PMC article.
-
Ventilator settings as a risk factor for acute respiratory distress syndrome in mechanically ventilated patients.Intensive Care Med. 2005 Jul;31(7):922-6. doi: 10.1007/s00134-005-2625-1. Epub 2005 Apr 26. Intensive Care Med. 2005. PMID: 15856172
References
-
- Heart Lung National and Blood Institute ARDS Clinical Trials Network. Higher versus lower positive end-expiratory pressures in patients with the acute respiratory distress syndrome. New England Journal of Medicine, 351(4):327–336, 2004. - PubMed
-
- Gattinoni Luciano, Citerio Giuseppe, and Slutsky Arthur S. Back to the future: Ards guidelines, evidence, and opinions. Intensive Care Medicine, 49(10):1226–1228, 2023. - PubMed
-
- Karbing Dan Stieper, Spadaro Savino, Dey Nilanjan, Ragazzi Riccardo, Marangoni Elisabetta, Corte Francesca Dalla, Moro Federico, Lodahl David, Hansen Niklas Schurmann, Winding Robert, et al. An open-loop, physiologic model–based decision support system can provide appropriate ventilator settings. Critical Care Medicine, 46(7):e642–e648, 2018. - PubMed
-
- Curley Gerard F, Laffey John G, Zhang Haibo, and Slutsky Arthur S. Biotrauma and ventilator-induced lung injury: clinical implications. Chest, 150(5):1109–1117, 2016. - PubMed
Publication types
Grants and funding
LinkOut - more resources
Full Text Sources
Miscellaneous