[Preprint]. 2024 May 2:2023.12.14.571759.
doi: 10.1101/2023.12.14.571759.

The Natural Products Discovery Center: Release of the First 8490 Sequenced Strains for Exploring Actinobacteria Biosynthetic Diversity

Affiliations

The Natural Products Discovery Center: Release of the First 8490 Sequenced Strains for Exploring Actinobacteria Biosynthetic Diversity

Edward Kalkreuter et al. bioRxiv. .

Abstract

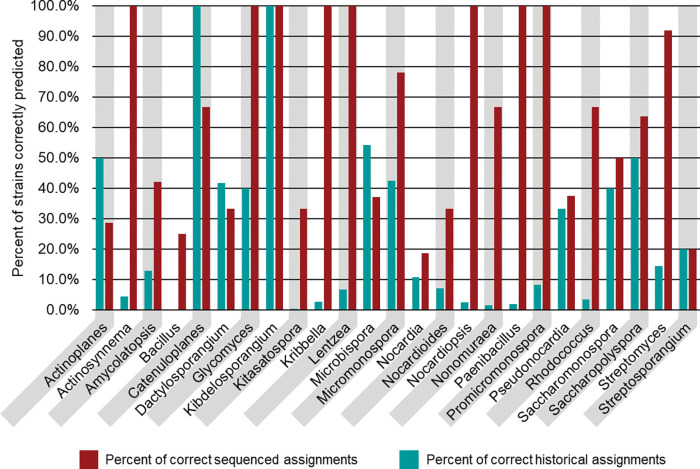
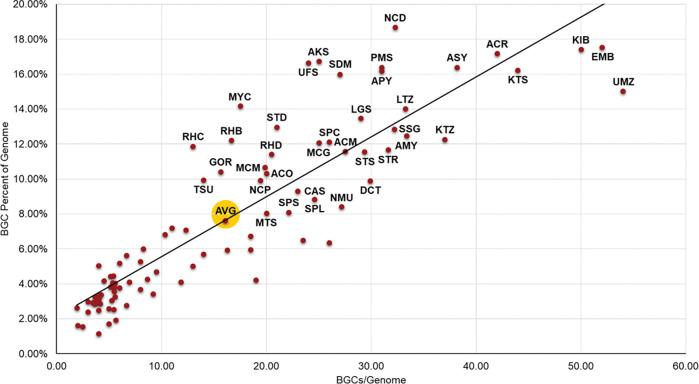
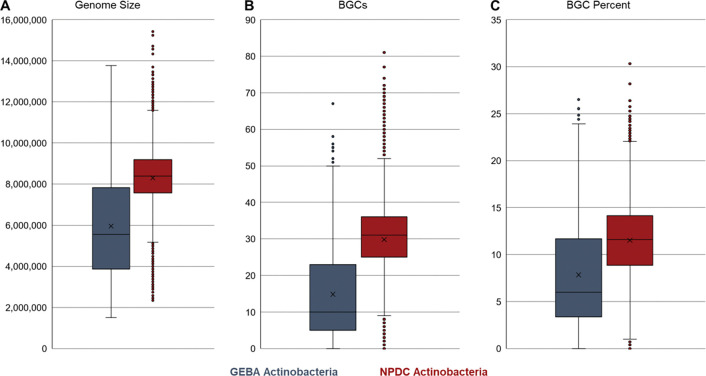
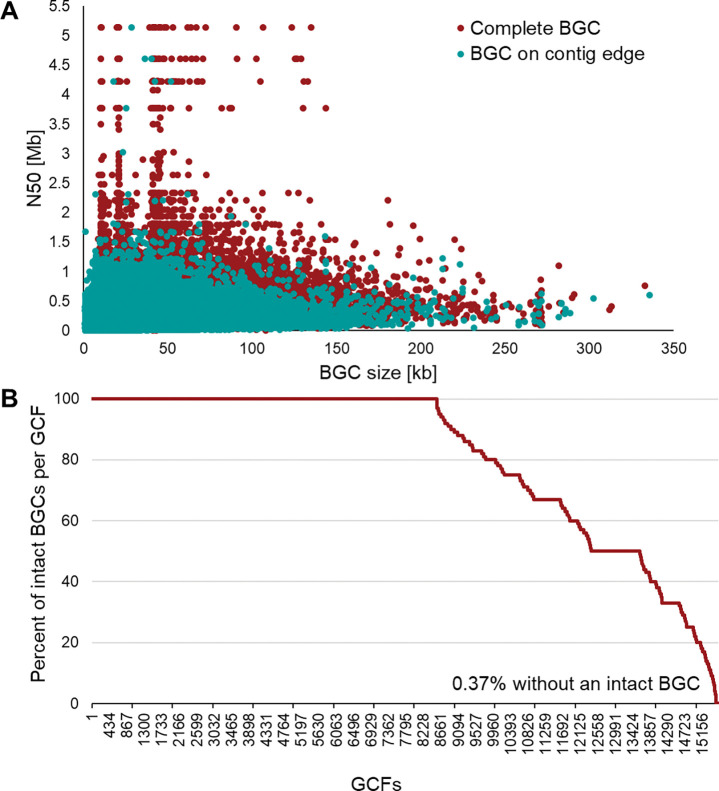
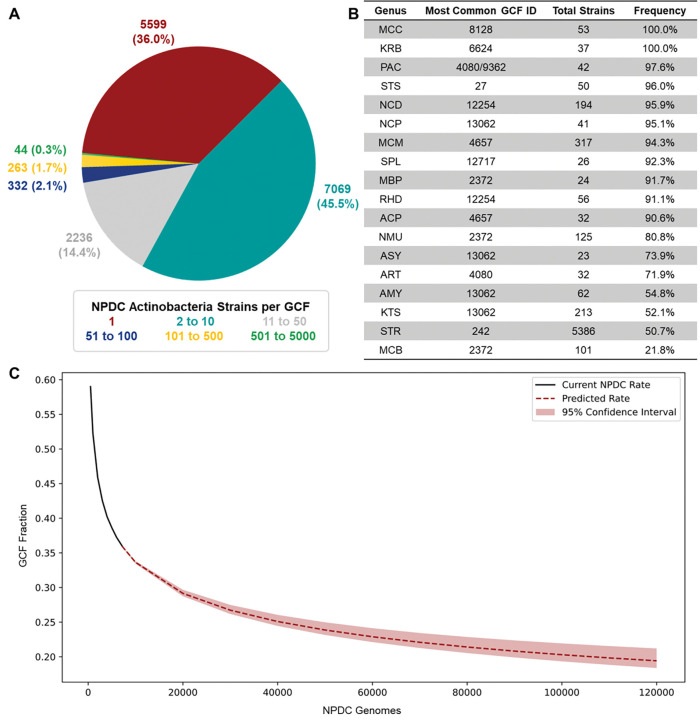
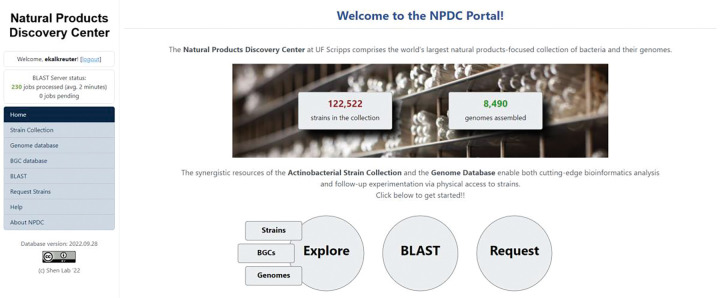
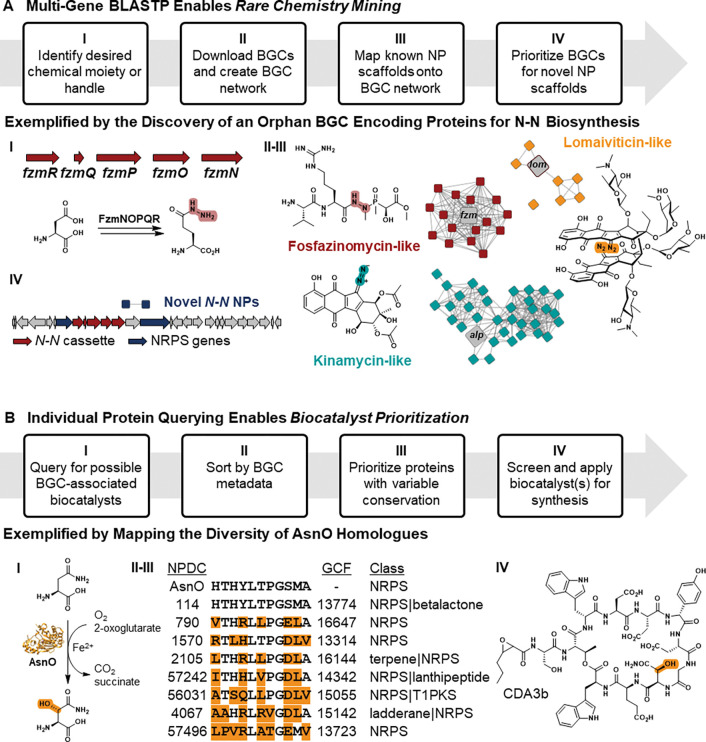
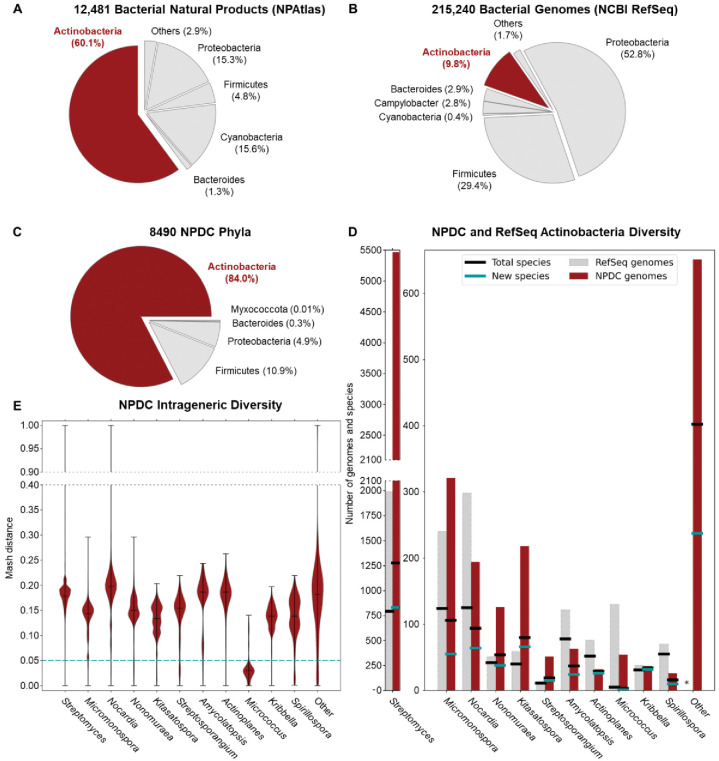
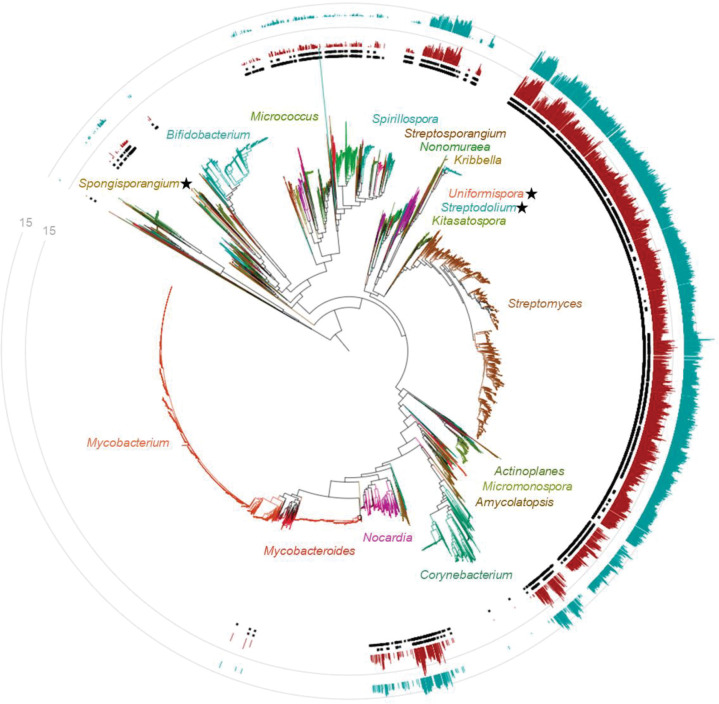
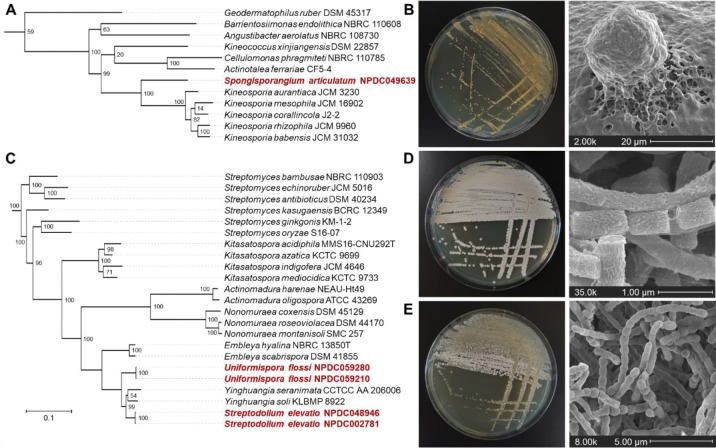
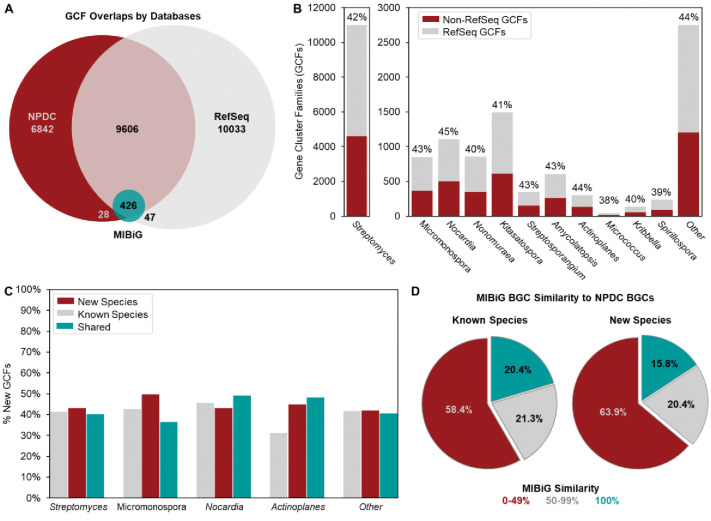
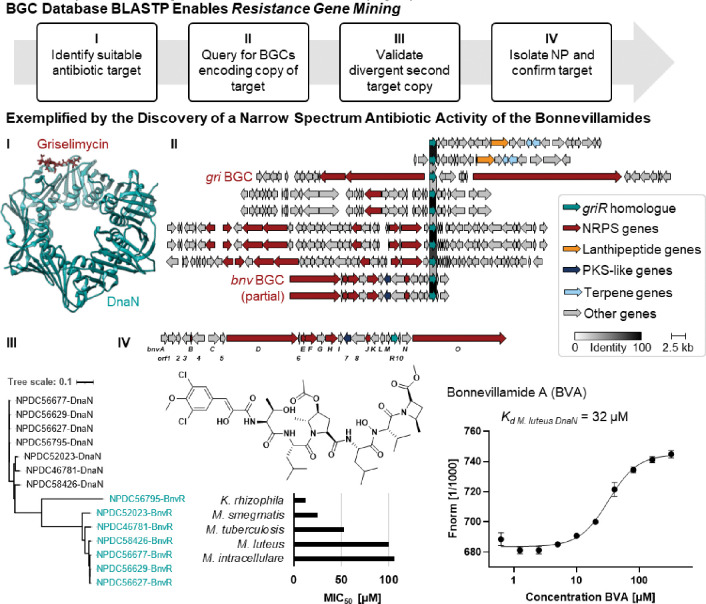
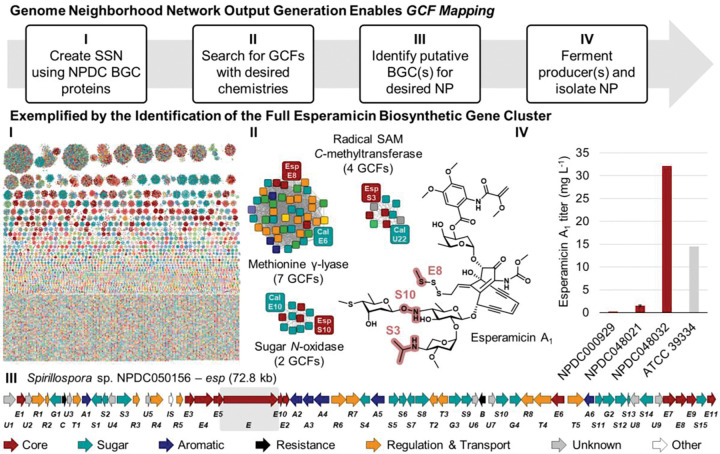
Actinobacteria, the bacterial phylum most renowned for natural product discovery, has been established as a valuable source for drug discovery and biotechnology but is underrepresented within accessible genome and strain collections. Herein, we introduce the Natural Products Discovery Center (NPDC), featuring 122,449 strains assembled over eight decades, the genomes of the first 8490 NPDC strains (7142 Actinobacteria), and the online NPDC Portal making both strains and genomes publicly available. A comparative survey of RefSeq and NPDC Actinobacteria highlights the taxonomic and biosynthetic diversity within the NPDC collection, including three new genera, hundreds of new species, and ~7000 new gene cluster families. Selected examples demonstrate how the NPDC Portal's strain metadata, genomes, and biosynthetic gene clusters can be leveraged using genome mining approaches. Our findings underscore the ongoing significance of Actinobacteria in natural product discovery, and the NPDC serves as an unparalleled resource for both Actinobacteria strains and genomes.

Keywords: Actinobacteria; Biosynthetic gene clusters; Esperamicin; Natural Products Discovery Center; Natural products.


Conflict of interest statement

Competing Interest Statement: The authors declare that they have no conflict of interest.

Figures

Extended Data Fig. 1.
Comparison of historical and sequence-based taxonomies of NPDC strains. Approximately 10% of NPDC strains had morphology-based taxonomies assigned. See Supplementary Table 3 for additional values. The teal bars represent the percentage of isolates in a whole-genome sequencing-determined genus that were properly assigned based on historical classification. The red bars represent the percentage of historically classified isolates whose genus was confirmed based on whole-genome sequencing.
Extended Data Fig. 2.
BGC dedication by Actinobacteria genus. The number of BGCs per genome follows a roughly linear relationship with the percentage of genome encoding BGCs, with some notable outliers showing up as the number of BGCs increases. All genera with above average percentages of the genome dedicated to BGCs are labeled. The average is indicated by AVG (highlighted in yellow). See Supplementary Table 10 for genus abbreviations.
Extended Data Fig. 3.
Comparison of GEBA and NPDC Actinobacteria genomes. (A) Comparison of genome sizes shows that the NPDC strains, collected for their NP biosynthetic potential, typically have much larger genomes than those from the Genomic Encyclopedia of Bacteria and Archaea (GEBA) Actinobacteria, which were primarily sequenced based on taxonomic diversity rather than biosynthetic potential. Similar trends were observed for the number of antiSMASH-predicted BGCs per genome (B) and the percentage of the genome dedicated to those BGCs (C).
Extended Data Fig. 4.
Completeness of NPDC BGCs and GCFs. (A) Relationship between intact BGCs and genome quality. In general, genomes with larger N50 values display a higher rate of BGCs predicted to be intact by antiSMASH. However, even genomes with small N50 values contain large intact BGCs. BGCs are predicted as intact if the antiSMASH-annotated boundaries do not stop at a contig edge. (B) Proportion of intact BGCs per GCF in NPDC Actinobacteria genomes. Most NPDC GCFs consist only of intact BGCs, while >99% of NPDC GCFs contain at least one BGC predicted to be intact. BGCs are predicted as intact if the antiSMASH-annotated boundaries do not stop at a contig edge. By using GCFs in place of BGCs for measuring biosynthetic diversity, GCFs containing at least one putative intact BGC can minimize the impact of fragmented BGCs on downstream analyses.
Extended Data Fig. 5.
Distribution of NPDC Actinobacteria GCFs. (A) Distribution of GCFs were colored based on how many NPDC Actinobacteria genomes they were found in (e.g., GCFs with 1 strain = red), showing that most GCFs are found in ten or fewer NPDC genomes. (B) In genera with at least 20 strains, the number of instances of the most common GCF in each genus was listed by ID. In most genera, the most common GCF appears in >90% of genomes in that genus. In some cases, BGCs belonging to the most common GCF appear multiple times within a single genome, but these instances were only counted once. (C) A rarefaction analysis was performed for all NPDC Actinobacteria GCFs and extrapolated out to 120,000 genomes (approximately the size of the NPDC collection). The fraction of GCFs found in only a single genome are plotted here, indicating the value of continued genome sequencing for biosynthetic diversity. To determine the current NPDC rate, the fraction of Actinobacteria GCFs found in only a single genome was averaged at 500, 1000, 2000, 3000, 4000, 5000, 6000, and 7139 NPDC genomes (randomly sampled 100 times per number of genomes). See Supplementary Table 10 for genus abbreviations.
Extended Data Fig. 6.
NPDC Portal home page. From the home page, users can access the strain, BGC, and genome databases, the BLASTP tool, and can request strains. Image pulled March 31, 2023.
Extended Data Fig. 7.
Genome mining using the NPDC Portal. (A) The NPDC Portal enables up to five simultaneous BLAST queries for NP diversity and novelty. (I) The five gene cassette required for N-N bond formation in fosfazinomycin was queried against the NPDC BGC database. (II) The resultant BGCs were clustered by BiG-SCAPE and (III) assigned to known and (IV) unknown NP families. For the unknown family of BGCs containing this five-gene cassette, a representative BGC is depicted. Also see Supplementary Fig. 30. (B) The NPDC Portal enables searching enzyme families for biocatalyst discovery and development. (I) Sequences of BGC-associated α-KG-dependent dioxygenases related to the asparaginyl oxygenase AsnO (PDB:2OG5) were identified with the NPDC BLASTP tool. (II) The sequences were sorted by the NPDC-provided and antiSMASH-generated BGC classes and BiG-SLICE-generated GCFs and (III) aligned to identify homologues with varying conservation, allowing (IV) development of the optimal biocatalyst for synthetic applications. ,
Figure 1.
Figure 1.
Natural product-producing Actinobacteria are well-represented among NPDC strains. (A) NPs derived from Actinobacteria (red) are overrepresented in comparison to the NPs isolated from other bacterial sources according to NPAtlas. Actinobacteria NPs are primarily isolated from Streptomyces (73%), Micromonospora (4%), and Actinomadura (2%). (B) Actinobacteria genomes (red) are underrepresented in comparison to other bacterial genomes available in NCBI RefSeq. Actinobacteria RefSeq genomes come primarily from pathogens or other health-associated bacteria such as Mycobacterium (45%), Bifidobacterium (7%), or Corynebacterium (6%). Streptomyces make up only a small fraction of Actinobacteria RefSeq genomes (9%). (C) Breakdown of NPDC genomes by phylum, confirming that most NPDC strains are Actinobacteria. (D) Actinobacteria genomes from representative genera in the NPDC (red bars) are compared to genomes from RefSeq (grey bars). Total numbers of species in a genus, based on a 0.05 Mash distance cut-off, are indicated by black lines. Numbers of new species in the NPDC, defined as lacking a closely related representative in the Genome Taxonomy Database (GTDB), are indicated by teal lines. The genomes from non-highlighted genera are combined into a single ‘Other’ category here, and the breakdowns by individual genera are depicted in Supplementary Fig. 8. (E) Intrageneric diversity in representative, well-populated NPDC genera are displayed by Mash distance distribution. Mash distances smaller than 0.05 are treated as the same species.
Figure 2.
Figure 2.
Taxonomic distribution of NPDC Actinobacteria strains and GCFs. The genome-based maximum likelihood phylogenetic tree of RefSeq and NPDC Actinobacteria is color-coded by genus, with representative genera labeled. The inner circle of black squares represents NPDC strains. The outer circle of black squares represents new species. The inner red bar chart indicates the number of new GCFs. The outer teal bar chart indicates the number of GCFs that overlap with RefSeq GCFs. New genera identified in this study are indicated with stars.
Figure 3.
Figure 3.
Proposed new genera identified in the NPDC. (A) Genome-based maximum likelihood phylogenetic tree showing the position of Spongisporangium articulatum NPDC049639 among representative type strains. (B) Representative macroscopic and SEM images of S. articulatum NPDC049639 highlighting the large spherical bodies on the spongelike culture surface inspiring the genus name. (C) Genome-based maximum likelihood phylogenetic tree showing the positions of Streptodolium elevatio NPDC002781 and NPDC048946 and Uniformispora flossi NPDC059210 and NPDC059280 among representative type strains. (D) Representative macroscopic and SEM images of S. elevatio NPDC002781 highlighting the fibrous sheath of the aerial hyphae. (E) Representative macroscopic and SEM images of U. flossi NPDC059280 highlighting the long chains of uniformly segmented aerial hyphae interconnected with thin filamentous strands. Additional SEM images are found in Supplementary Fig. 12–14.
Figure 4.
Figure 4.
The NPDC genomes expand the accessible biosynthetic potential across different genera. (A) Distribution of GCFs in RefSeq (grey) and NPDC (red) genomes, with Actinobacteria MIBiG GCFs (teal) included separately. (B) Distribution of non-RefSeq GCFs (red) and GCFs observed in both NPDC and RefSeq genomes (grey) across representative genera as visualized in a stacked bar chart. Between 40–50% of total GCFs by NPDC genus are not observed in RefSeq (indicated by percentage). Also see Supplementary Fig. 17. (C) Percentages of non-RefSeq GCFs in known species (grey), proposed new species (red), and shared between them (teal) across representative genera. Also see Supplementary Fig. 18. (D) Distribution of NPDC BGCs by antiSMASH-assigned similarity to characterized MIBiG BGCs. A higher percentage of BGCs with low similarity to MIBiG BGCs is observed for new species relative to known ones.
Figure 5.
Figure 5.
Resistance-guided genome mining for NPs acting on predicted potential targets. (I) Inspired by griselimycin, the only known DnaN-targeting NP to date and shown bound to DnaN (PDB: 6PTV), NPDC BGCs encoding DnaN homologues were identified, and (II) BGCs from four GCFs were aligned with the gri BGC using Clinker. , (III) The DIAMOND-BLASTP tool allowed querying of the BGC database allowing exclusion of most primary metabolism hits. (IV) Bonnevillamide A, a NP associated with one GCF, , was isolated and shown to bind the Micrococcus luteus DnaN and exhibited narrow-spectrum antibiotic activity.
Figure 6.
Figure 6.
Identification of esperamicin BGC and alternative producers. (I) Using combined BLASTP queries for PksE and E4, all 31,029 protein sequences encoded by 659 NPDC enediyne BGCs were downloaded and grouped using the EFI SSN tool (e-value e−100). Nodes were color-coded based on GCFs. (II) Zoomed-in protein clusters from the SSN showcase the diversity of GCFs encoding each protein responsible for the highlighted moieties in the esp BGC (red nodes) or cal BGC (teal nodes; see Supplementary Fig. 32). (III) The esp BGC is color-coded based on predicted gene product functions, and a grey box is around the previously sequenced region from the original ATCC producer. (IV) Titers of ESP A1 were calculated for NPDC strains and compared to those from the original ATCC producer under the same conditions.

Similar articles

References

    1. Newman D. J. & Cragg G. M. Natural products as sources of new drugs over the nearly four decades from 01/1981 to 09/2019. J. Nat. Prod. 83, 770–803 (2020). - PubMed
    1. Jones D., Metzger H. J., Schatz A. & Control S.A. W. of gram-negative bacteria in experimental animals by streptomycin. Science 100, 103–105 (1944). - PubMed
    1. Katz L. & Baltz R. H. Natural product discovery: past, present, and future. J. Ind. Microbiol. Biotechnol. 43, 155–176 (2016). - PubMed
    1. Atanasov A. G., Zotchev S. B., Dirsch V. M. & Supuran C. T. Natural products in drug discovery: advances and opportunities. Nat. Rev. Drug Discov. 20, 200–216 (2021). - PMC - PubMed
    1. Steele A. D., Teijaro C. N., Yang D. & Shen B. Leveraging a large microbial strain collection for natural product discovery. J. Biol. Chem. 294, 16567–16576 (2019). - PMC - PubMed

Publication types