

This is a preprint.
Unfolding and De-confounding: Biologically meaningful causal inference from longitudinal multi-omic networks using METALICA
- PMID: 38168315
- PMCID: PMC10760167
- DOI: 10.1101/2023.12.12.571384
Unfolding and De-confounding: Biologically meaningful causal inference from longitudinal multi-omic networks using METALICA
Update in
-
Unfolding and de-confounding: biologically meaningful causal inference from longitudinal multi-omic networks using METALICA.mSystems. 2024 Oct 22;9(10):e0130323. doi: 10.1128/msystems.01303-23. Epub 2024 Sep 6. mSystems. 2024. PMID: 39240096 Free PMC article.
Abstract
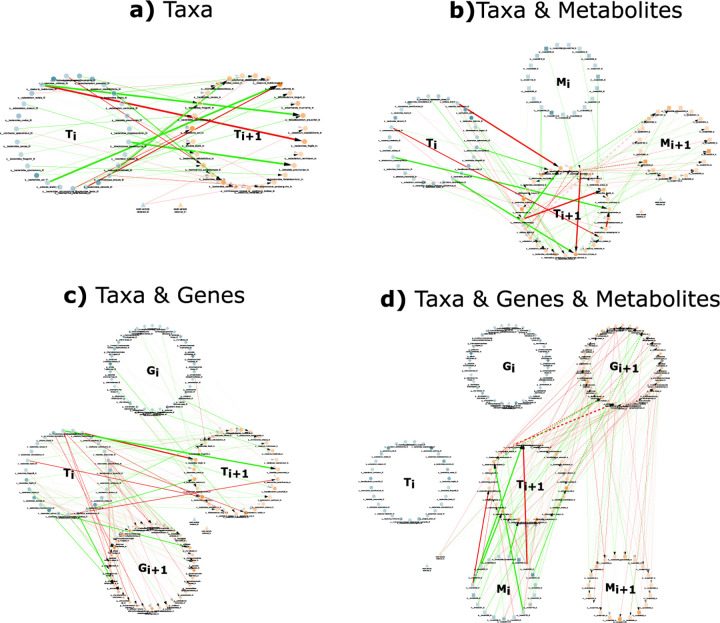
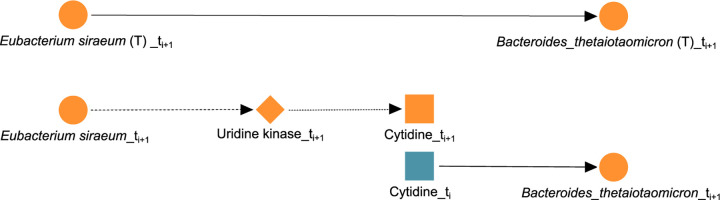
A key challenge in the analysis of microbiome data is the integration of multi-omic datasets and the discovery of interactions between microbial taxa, their expressed genes, and the metabolites they consume and/or produce. In an effort to improve the state-of-the-art in inferring biologically meaningful multi-omic interactions, we sought to address some of the most fundamental issues in causal inference from longitudinal multi-omics microbiome data sets. We developed METALICA, a suite of tools and techniques that can infer interactions between microbiome entities. METALICA introduces novel unrolling and de-confounding techniques used to uncover multi-omic entities that are believed to act as confounders for some of the relationships that may be inferred using standard causal inferencing tools. The results lend support to predictions about biological models and processes by which microbial taxa interact with each other in a microbiome. The unrolling process helps to identify putative intermediaries (genes and/or metabolites) to explain the interactions between microbes; the de-confounding process identifies putative common causes that may lead to spurious relationships to be inferred. METALICA was applied to the networks inferred by existing causal discovery and network inference algorithms applied to a multi-omics data set resulting from a longitudinal study of IBD microbiomes. The most significant unrollings and de-confoundings were manually validated using the existing literature and databases.
Keywords: Causal inference; Longitudinal microbiome analysis; Multi-omic integration; Unfolding; de-confounding.
Figures
References
-
- Riesenfeld CS, Schloss PD, Handelsman J. 2004. Metagenomics: genomic analysis of microbial communities. Annu Rev Genet 38:525–552. - PubMed
-
- Fernandez M, Aguiar-Pulido V, Riveros J, Huang W, Segal J, Zeng E, Campos M, Mathee K, Narasimhan G. 2016. Microbiome analysis: State of the art and future trends. Comput Methods for Next Gener Seq Data Anal p 401–424.
-
- Turnbaugh PJ, Gordon JI. 2008. An invitation to the marriage of metagenomics and metabolomics. Cell 134 (5):708–713. - PubMed
-
- Stebliankin V, Sazal M, Valdes C, Mathee K, Narasimhan G. 2022. A novel approach for combining the metagenome, metaresistome, metareplicome and causal inference to determine the microbes and their antibiotic resistance gene repertoire that contribute to dysbiosis. Microb Genom 8 (12):mgen000899. - PMC - PubMed
Publication types
Grants and funding
LinkOut - more resources
Full Text Sources