[Preprint]. 2023 Dec 17:2023.12.15.571954.
doi: 10.1101/2023.12.15.571954.

Image-based spatial transcriptomics identifies molecular niche dysregulation associated with distal lung remodeling in pulmonary fibrosis

Affiliations

Image-based spatial transcriptomics identifies molecular niche dysregulation associated with distal lung remodeling in pulmonary fibrosis

Annika Vannan et al. bioRxiv. .

Update in

Abstract

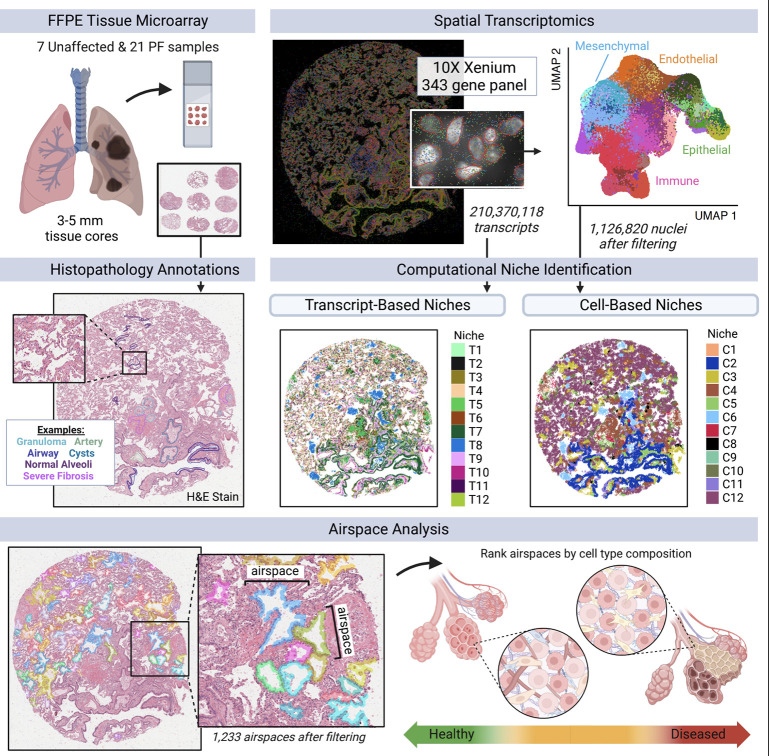
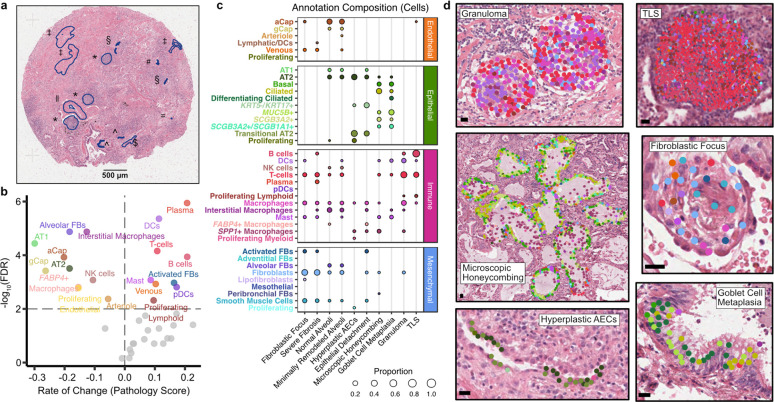
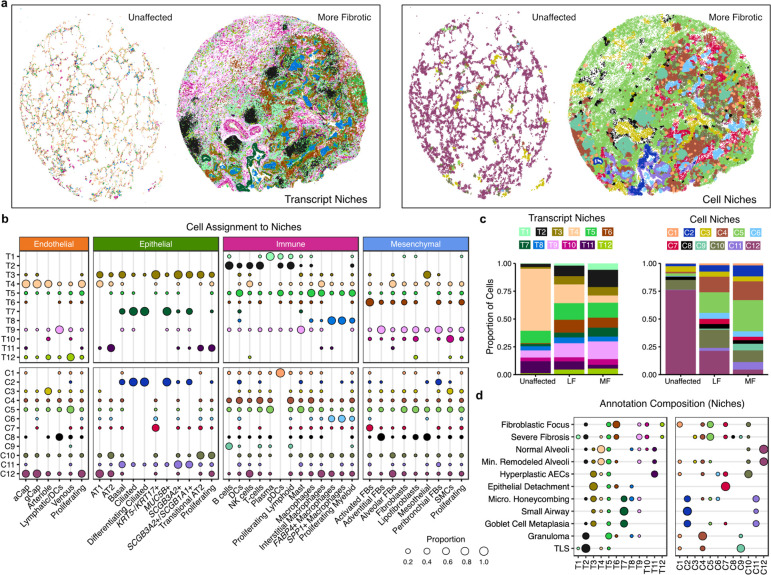
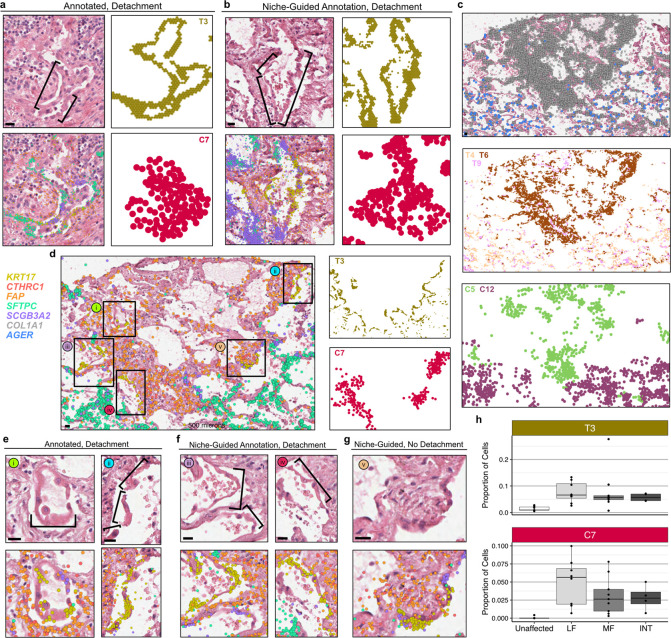
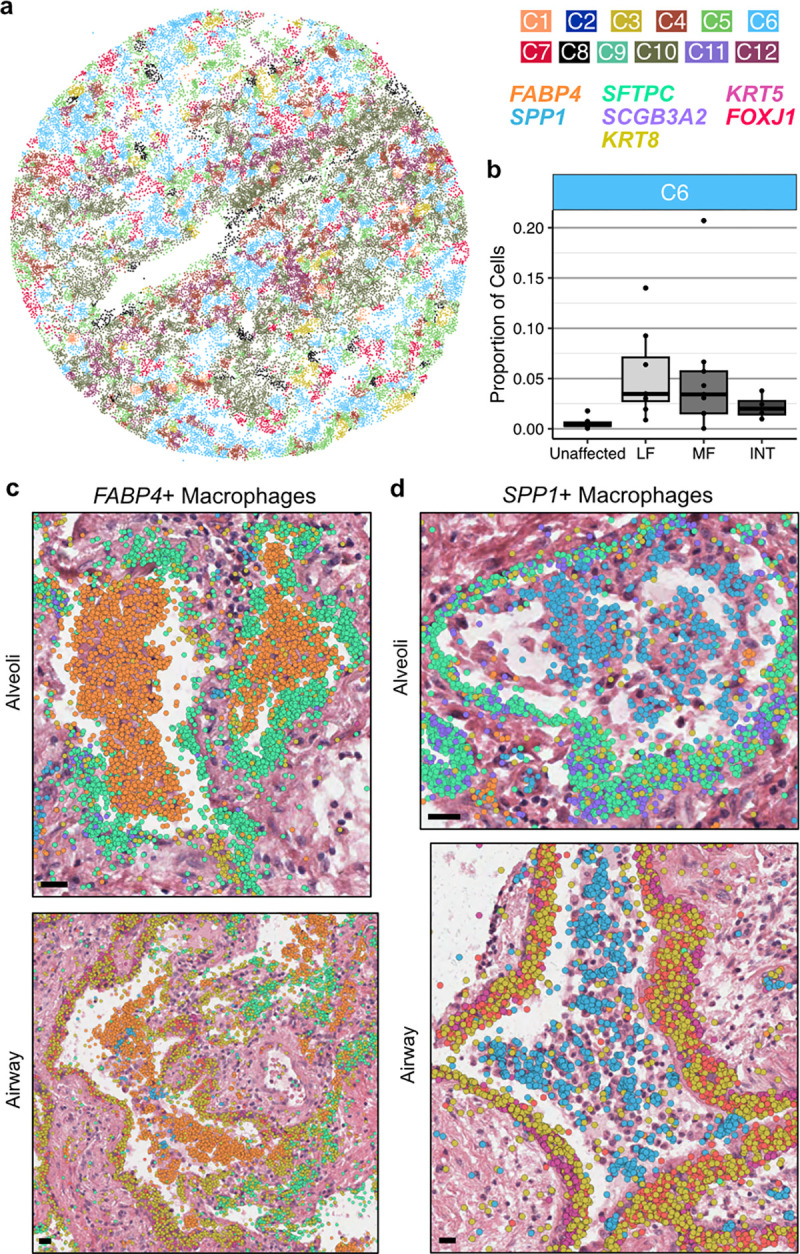
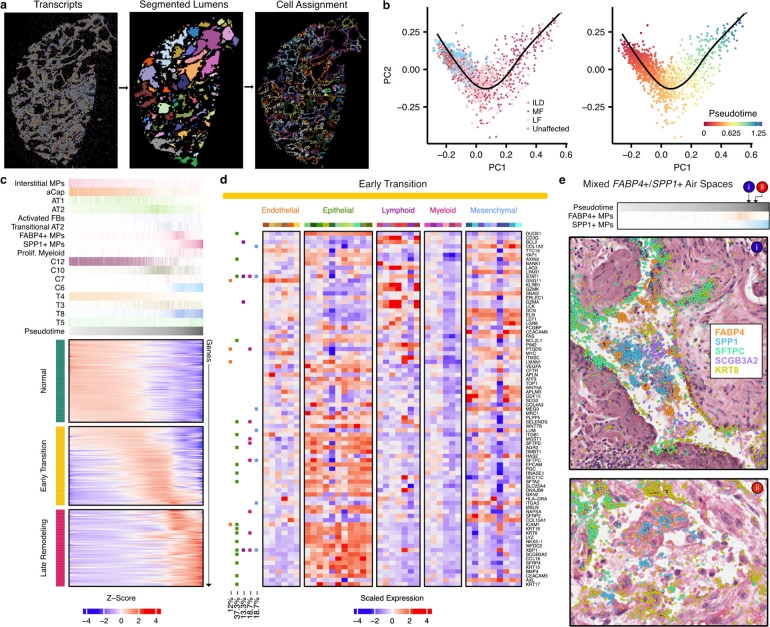
The human lung is structurally complex, with a diversity of specialized epithelial, stromal and immune cells playing specific functional roles in anatomically distinct locations, and large-scale changes in the structure and cellular makeup of this distal lung is a hallmark of pulmonary fibrosis (PF) and other progressive chronic lung diseases. Single-cell transcriptomic studies have revealed numerous disease-emergent/enriched cell types/states in PF lungs, but the spatial contexts wherein these cells contribute to disease pathogenesis has remained uncertain. Using sub-cellular resolution image-based spatial transcriptomics, we analyzed the gene expression of more than 1 million cells from 19 unique lungs. Through complementary cell-based and innovative cell-agnostic analyses, we characterized the localization of PF-emergent cell-types, established the cellular and molecular basis of classical PF histopathologic disease features, and identified a diversity of distinct molecularly-defined spatial niches in control and PF lungs. Using machine-learning and trajectory analysis methods to segment and rank airspaces on a gradient from normal to most severely remodeled, we identified a sequence of compositional and molecular changes that associate with progressive distal lung pathology, beginning with alveolar epithelial dysregulation and culminating with changes in macrophage polarization. Together, these results provide a unique, spatially-resolved characterization of the cellular and molecular programs of PF and control lungs, provide new insights into the heterogeneous pathobiology of PF, and establish analytical approaches which should be broadly applicable to other imaging-based spatial transcriptomic studies.


Figures

Figure 1.
Figure 1.. Outline of spatial transcriptomics processing and analysis pipeline.
28 lung tissue cores (3–5 mm) from unaffected and PF donors were processed on tissue microarrays (TMAs) of 3–9 samples each on the Xenium Analyzer instrument. We quantified expression of 343 genes at sub-cellular resolution using a custom panel. After filtering, we retained 210,370,118 high-quality transcripts. After additional filtering, we annotated cell types for 1,126,820 segmented nuclei across the endothelial, epithelial, immune, and mesenchymal lineages.
Figure 2.
Figure 2.. The molecular and cellular basis of clinically relevant PF histopathologies.
a, Each sample was assigned a pathology score based on a semiquantitative scale assessing the number/severity of pathologic features. Here, we show a representative sample (VUILD107MF; IPF diagnosis) with annotated features. Features are represented by symbols as follows: ‖ muscularized artery; ‡ severe fibrosis; § hyperplastic AECs; # epithelial detachment; = multinucleated cell; ^ remodeled epithelium; $ goblet cell metaplasia; * mixed inflammation. b, Cell types significantly associated with pathology score are labeled in the volcano plot. The horizontal and vertical dashed lines show the significance threshold (FDR < 0.01) and split the plot into genes negatively and positively associated with pathology score, respectively. Cell types on the right are present in higher proportions in samples with high pathology scores. c, The cell type composition of select annotations of interest, as a proportion of the number of cells across an annotation (each column sums to 1). d, Examples of select annotations on H&E images overlain with cell types in the annotated region. Each point represents a cell centroid. Cell type colors are matched to b. Scale bars represent 20 μm. Example annotations were taken from the following samples: granuloma - VUILD96MF (sarcoidosis); tertiary lymphoid structure, TLS - VUILD110 (CTD-ILD); microscopic honeycombing - VUILD78MF (IPAF); fibroblastic focus - VUILD105LF (IPF); hyperplastic AECs - VUILD107MF (IPF); goblet cell metaplasia - VUILD104MF (IPF).
Figure 3.
Figure 3.. Complementary spatial niche analyses provide comprehensive annotation of tissue remodeling in PF.
a, Representative examples from both unaffected and PF samples showing transcript- (left) and cell-based niches (right). Shown are VUHD113 and VUILD107MF (IPF diagnosis). For transcript niches, hexbin plots are shown (see Methods). For cell niches, each point is a cell centroid. b, Cell assignment to transcript- (top) and cell-based niches (bottom), as a proportion of the number of cells of each type (each column sums to 1). c, Bar plots depicting the total proportion of cells across the unaffected, less fibrotic (LF), and more fibrotic (MF) sample types assigned to each transcript and cell niche. d, The niche composition of select annotations, as a proportion of the number of cells across an annotation (each row sums to 1). For b,d, proportions under 0.01 are not shown.
Figure 4.
Figure 4.. KRT5−/KRT17+ cells detach at sites of active fibrosis identified by spatial niches.
a, H&E images of epithelial detachment (denoted by brackets) annotated by a clinician, overlain with transcript expression of the listed genes and compared with the T3 and C7 niches. b, an example of epithelial detachment that was not annotated by a clinician but marked by the same niches/genes c-d, In one sample, we observed a dense fibrotic region marked by fibrotic niches (T6/T9/C5) and COL1A1 expression that was lined with epithelial detachment marked by T3 and C7 adjacent to normal alveolar niches (T4/C12) expressing the AT1 cell marker AGER. e, This region contained two sites of epithelial detachment originally annotated by the clinician (f) as well as two additional examples of detaching KRT5−/KRT17+ and other transitional epithelial cells. g, An instance of KRT5−/KRT17+ cells flanked by activated fibroblasts that were not detaching from the alveolar basement membrane. For a,b,d-g, expression is shown for KRT17, CTHRC1, FAP, SFTPC, and SCGB3A2, for c, expression is only shown for COL1A1 and AGER. Scale bars on the bottom left of each H&E represent 20 μm. Samples depicted are as follows: (a) VUILD107MF, (b) VUILD91MF, and (c-g) VUILD91LF, all diagnosed with IPF. h, Boxplots showing the proportion of cells assigned to the T3 and C7 niches for each sample, split by sample type - unaffected, less fibrotic (LF), more fibrotic (MF), and intermixed (INT).
Figure 5.
Figure 5.. FABP4+ and SPP1+ macrophages accumulate in PF airspaces and are characterized by a spatial niche.
a, Representative example of cell niches, including the C6 macrophage accumulation niche (light blue) in sample VUILD102MF (IPF diagnosis). b, Boxplot showing the proportion of cells assigned to the C6 niche across sample types, including unaffected, less fibrotic (LF), more fibrotic (MF), and intermixed (INT) samples. c,d, H&E images of FABP4+ (c) and SPP1+ (d) macrophage accumulations in alveoli (top) and airway (bottom), overlaid with transcript expression for listed genes c depicts examples from VUILD91MF (top; IPF) and VUILD96LF (bottom; sarcoidosis), and d shows samples VUILD78MF (top; IPAF) and VUILD96MF (bottom; sarcoidosis). For both c and d, all listed genes are potentially visible in each example image if expressed, except SCGB3A2 which is not shown on the two airway figures. Scale bars on the bottom left of each H&E represent 20 μm.
Figure 6.
Figure 6.. Alveolar remodeling at airspace resolution.
a, Representation of lumen segmentation pipeline. b, Principal components analysis (PCA) and pseudotime analysis projected into the first two PCs, cells are pseudocolored by sample type and pseudotime. c, Heatmap of predicted expression of each gene that was significantly associated with pseudotime. The top annotation shows select cell types, cell niches, and transcript niches that were associated with pseudotime, with the darkest shade of each color representing the maximum proportion of that cell type or niche found across all airspaces. d, Scaled expression across cell types for the 87 genes with altered expression in the early transition stages in alveolar remodeling from c, utilizing only cells that were contained within one of the 1,233 airspaces. Cell type colors match those in Fig. 2a. On the left, boxes are filled in for each gene if it showed a significant change in expression in at least one cell type across the pseudotime of each of the following lineages: endothelial (orange), epithelial (green), lymphoid (purple), myeloid (pink), and mesenchymal (blue). e, H&E images of mixed FABP4+ and SPP1+ macrophage accumulations in two alveoli ranked near the end of the pseudotime trajectory, overlaid with transcript expression for all listed genes. Above the H&Es, each alveolus is marked by its position in pseudotime, and the proportion of FABP4+ and SPP1+ macrophages is shown for each airspace across pseudotime as in c. The example alveoli shown are VUILD115_L1184 (cHP diagnosis; top) and VUILD102_L463 (IPF; bottom). Scale bars on the bottom left of each H&E represent 20 μm.

Similar articles

References

    1. Hewlett J. C., Kropski J. A. & Blackwell T. S. Idiopathic pulmonary fibrosis: Epithelial-mesenchymal interactions and emerging therapeutic targets. Matrix Biol. 71–72, 112–127 (2018). - PMC - PubMed
    1. Lederer D. J. & Martinez F. J. Idiopathic Pulmonary Fibrosis. N. Engl. J. Med. 378, 1811–1823 (2018). - PubMed
    1. Richeldi L. et al. Efficacy and safety of nintedanib in idiopathic pulmonary fibrosis. N. Engl. J. Med. 370, 2071–2082 (2014). - PubMed
    1. King T. E., Jr et al. A phase 3 trial of pirfenidone in patients with idiopathic pulmonary fibrosis. N. Engl. J. Med. 370, 2083–2092 (2014). - PubMed
    1. Liebow A. A., Carrington C. B., Simon M. & Potchen E. J. Frontiers of pulmonary radiology. Alveolar diseases: the (1969).

Publication types