[Preprint]. 2023 Dec 14:2023.12.13.571479.
doi: 10.1101/2023.12.13.571479.

A distinctive evolution of alveolar T cell responses is associated with clinical outcomes in unvaccinated patients with SARS-CoV-2 pneumonia

Affiliations

A distinctive evolution of alveolar T cell responses is associated with clinical outcomes in unvaccinated patients with SARS-CoV-2 pneumonia

Nikolay S Markov et al. bioRxiv. .

Update in

Abstract

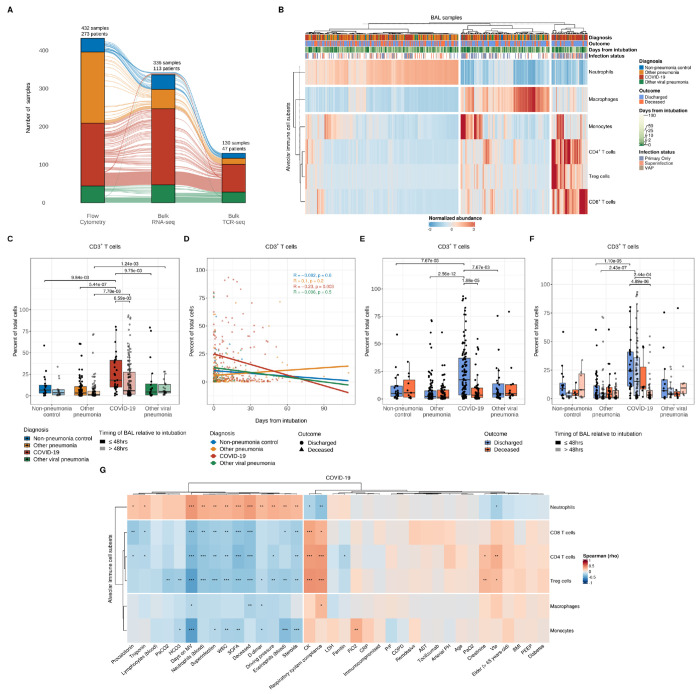
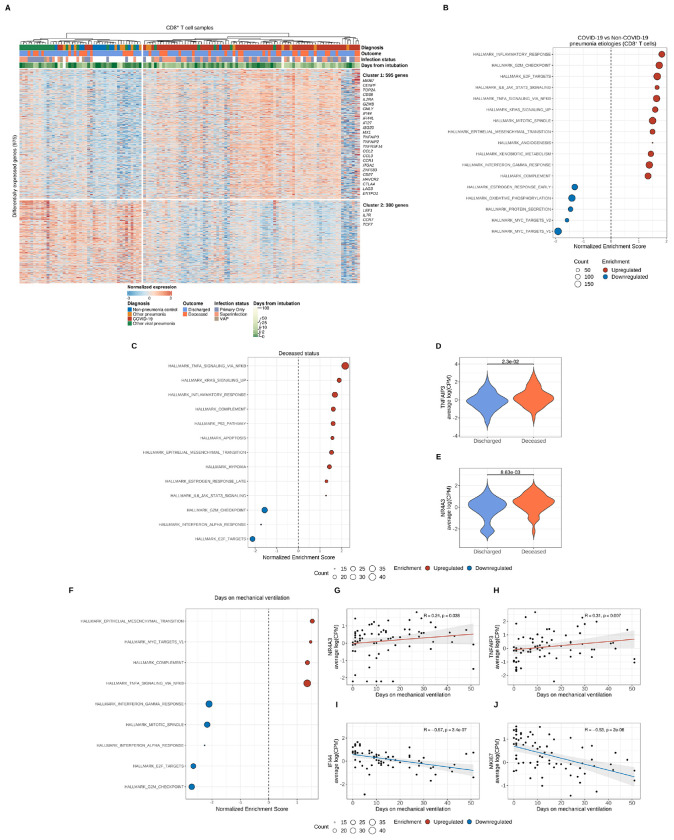
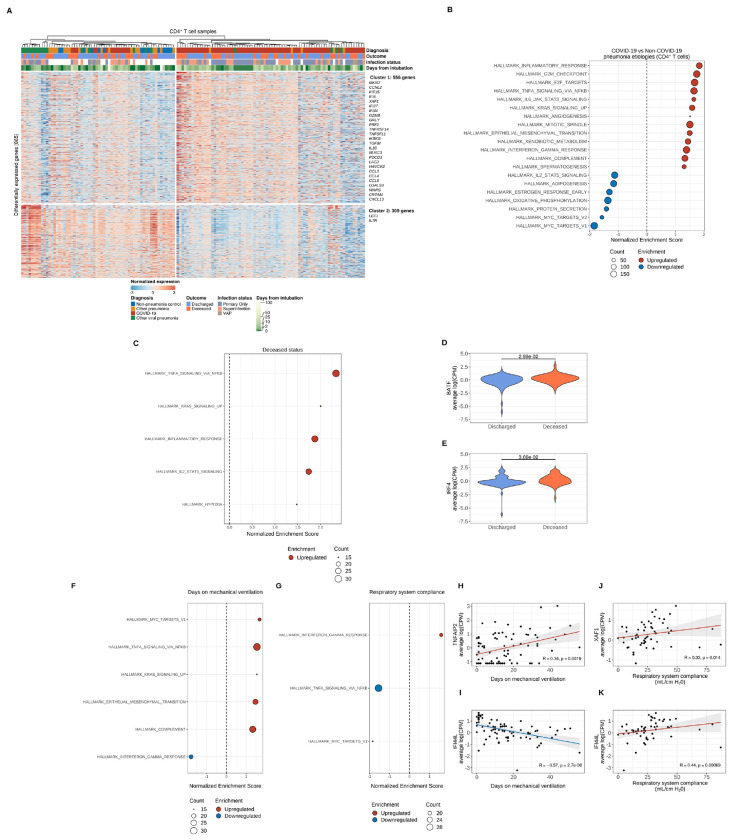
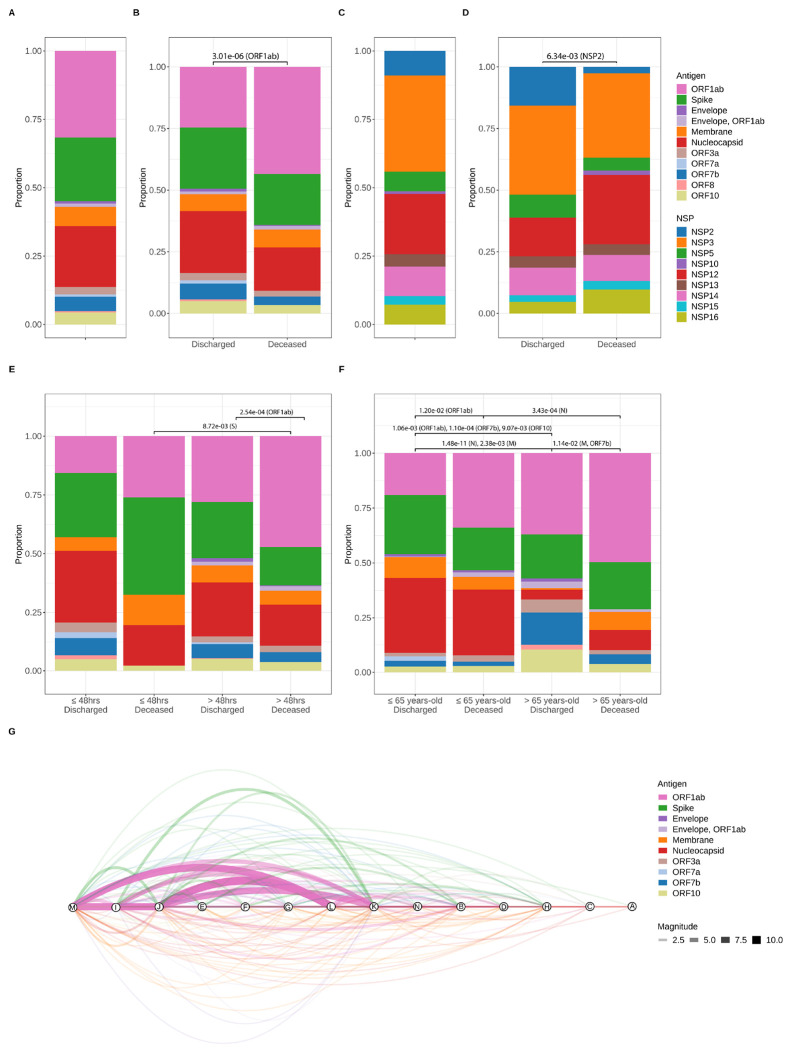
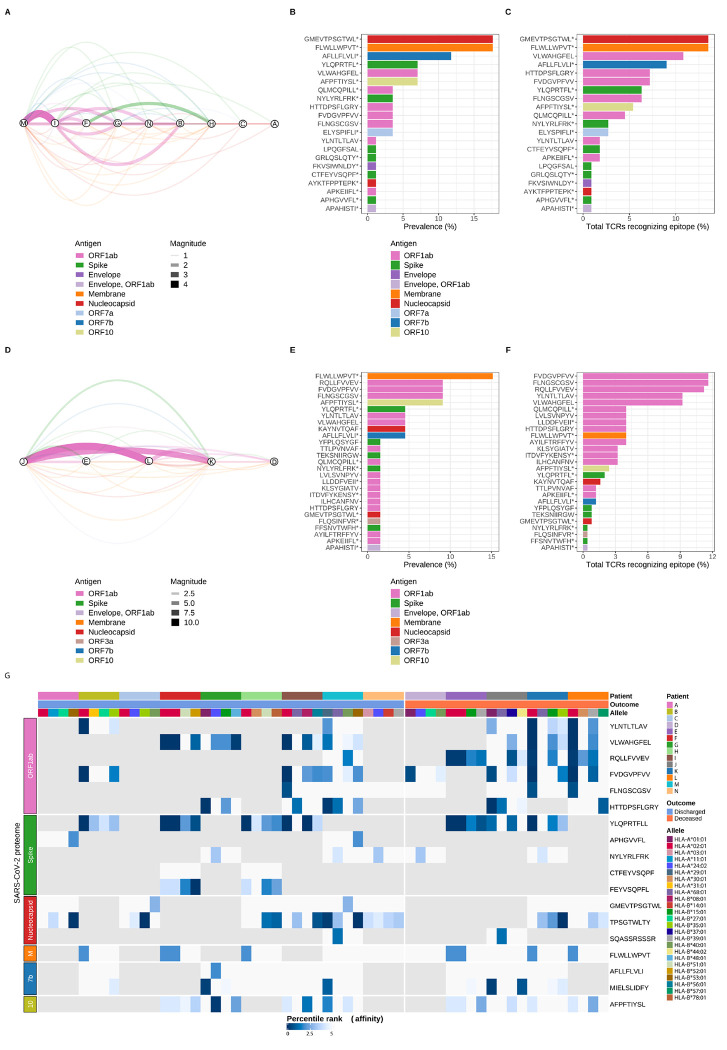
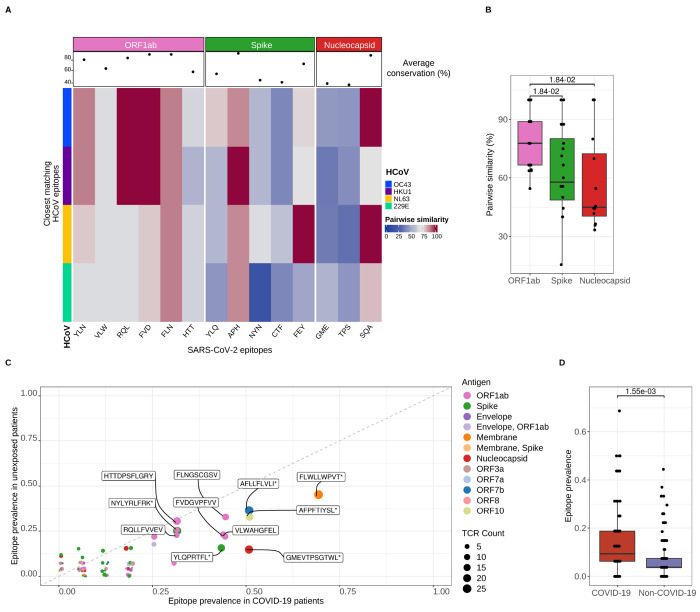
Pathogen clearance and resolution of inflammation in patients with pneumonia require an effective local T cell response. Nevertheless, local T cell activation may drive lung injury, particularly during prolonged episodes of respiratory failure characteristic of severe SARS-CoV-2 pneumonia. While T cell responses in the peripheral blood are well described, the evolution of T cell phenotypes and molecular signatures in the distal lung of patients with severe pneumonia caused by SARS-CoV-2 or other pathogens is understudied. Accordingly, we serially obtained 432 bronchoalveolar lavage fluid samples from 273 patients with severe pneumonia and respiratory failure, including 74 unvaccinated patients with COVID-19, and performed flow cytometry, transcriptional, and T cell receptor profiling on sorted CD8+ and CD4+ T cell subsets. In patients with COVID-19 but not pneumonia secondary to other pathogens, we found that early and persistent enrichment in CD8+ and CD4+ T cell subsets correlated with survival to hospital discharge. Activation of interferon signaling pathways early after intubation for COVID-19 was associated with favorable outcomes, while activation of NF-κB-driven programs late in disease was associated with poor outcomes. Patients with SARS-CoV-2 pneumonia whose alveolar T cells preferentially targeted the Spike and Nucleocapsid proteins tended to experience more favorable outcomes than patients whose T cells predominantly targeted the ORF1ab polyprotein complex. These results suggest that in patients with severe SARS-CoV-2 pneumonia, alveolar T cell interferon responses targeting structural SARS-CoV-2 proteins characterize patients who recover, yet these responses progress to NF-κB activation against non-structural proteins in patients who go on to experience poor clinical outcomes.


Conflict of interest statement

Competing Interest Statement: BDS holds United States Patent No. US 10,905,706 B2, “Compositions and Methods to Accelerate Resolution of Acute Lung Inflammation”, and serves on the Scientific Advisory Board of Zoe Biosciences, outside of the submitted work. The other authors have no competing interests to declare.

Figures

Figure 1.
Figure 1.. Alveolar T cell enrichment is associated with clinical outcomes in patients with severe SARS-CoV-2 pneumonia.
(A) Alluvial diagram depicting multi-step analysis of BAL fluid samples with flow cytometry, bulk RNA-sequencing, and bulk TCR-sequencing in patients from non-pneumonia control, other pneumonia, COVID-19, and other viral pneumonia groups. The number of analyzed samples from unique SCRIPT-enrolled patients are illustrated at the top of each stratum. (B) Hierarchical clustering of flow cytometry analysis of alveolar immune cell subset composition from all samples. Each column represents a BAL sample and headers are color-coded by diagnosis, binary outcome (whether a given patient was discharged or died during hospitalization), duration of mechanical ventilation (blanks indicate chronically ventilated patients), and infection status (presence or absence of bacterial superinfection in patients with COVID-19 or other viral pneumonia). The VAP (ventilator-associated pneumonia) flag designates samples from non-pneumonia controls or patients with COVID-19 or other viral pneumonia who cleared the virus and then developed a bacterial pneumonia. Samples were clustered using Euclidean distance and Ward’s minimum variance linkage method. (C) Comparison of CD3+ T cell percentage between early (≤48 hours following intubation) and late (>48 hours following intubation) samples (q < 0.05, pairwise Wilcoxon rank-sum tests with FDR correction). (D) Correlation analysis between the percentage of alveolar CD3+ T cells and duration of mechanical ventilation with Pearson correlation coefficient. (E-F) Comparison of percent of alveolar CD3+ T cells between patients who were discharged from the hospital or died during their hospital course (E) and between early and late samples (F) (q < 0.05, pairwise Wilcoxon rank-sum tests with FDR correction). (G) Correlation analysis between the percentage of alveolar immune cell subsets and clinical, physiologic, and laboratory variables with Spearman rank correlation coefficient and FDR correction (q < 0.05 [*], q < 0.01 [**] and q < 0.001 [***]). Abbreviations: PaCO2 (partial arterial carbon dioxide pressure), HCO3 (bicarbonate), Days on MV (days on mechanical ventilation), SOFA (Sequential Organ Failure Assessment), WBC (peripheral white blood cells), CK (creatinine kinase), Vte (minute ventilation), LDH (lactate dehydrogenase), FiO2 (fraction of inspired oxygen), CRP (C-reactive protein), PEEP (positive end-expiratory pressure), BMI (body mass index), AST (aspartate aminotransferase), PaO2 (partial arterial oxygen pressure), P/F (ratio of partial arterial oxygen pressure to fraction of inspired oxygen), COPD (chronic obstructive pulmonary disease).
Figure 2.
Figure 2.. Transcriptional profiling of alveolar CD8+ T cells reveals distinct effector activation signatures that are associated with clinical outcomes that shift throughout the course of severe SARS-CoV-2 pneumonia.
(A) K-means clustering of 975 differentially expressed genes (q < 0.05, likelihood-ratio test with FDR correction) across pneumonia diagnoses. Columns represent unique samples and column headers are color-coded by diagnosis, binary outcome (whether a given patient was discharged from the hospital alive or died during hospitalization), duration of mechanical ventilation (blanks indicate chronically ventilated patients), and infection status (presence or absence of bacterial superinfection in patients with COVID-19 or other viral pneumonia). The VAP (ventilator-associated pneumonia) flag designates samples from non-pneumonia controls or patients with COVID-19 or other viral pneumonia who cleared the virus and then developed a bacterial pneumonia. Samples were clustered using Ward’s minimum variance clustering method. Representative genes are shown for each cluster. (B) Gene set enrichment analysis (GSEA) of Hallmark gene sets for the pairwise comparison between COVID-19 samples and combined non-COVID-19 samples (non-pneumonia control, other pneumonia, and other viral pneumonia). Count denotes pathway size after removing genes not detected in the expression dataset. Enrichment denotes significant (q < 0.25 with FDR correction) upregulated (red) and downregulated (blue) pathways by normalized enrichment score. (C) GSEA of genes from COVID-19 samples after performing correlation analysis of differentially expressed genes in CD8+ T cells and binary outcome variable with Spearman rank correlation coefficient computation. Count denotes pathway size after removing genes that were not detected. Enrichment denotes significant (q < 0.25 with FDR correction) upregulated (red) and downregulated (blue) pathways by normalized enrichment score (NES). (D-E) Leading edge analysis reveals selected core genes driving pathway enrichment signal in the binary outcome variable. (F) GSEA of COVID-19 samples after performing correlation analysis of differentially expressed genes in CD8+ T cells and the duration of mechanical ventilation variable with Spearman rank correlation coefficient computation. Count denotes pathway size after removing genes that were not detected. Enrichment denotes significant (q < 0.25 with FDR correction) upregulated (red) and downregulated (blue) pathways by normalized enrichment score. (G-J) Leading edge analysis reveals selected core genes driving pathway enrichment signal in the duration of mechanical ventilation variable.
Figure 3.
Figure 3.. Transcriptional profiling of alveolar CD4+ T cells reveals distinct effector activation signatures that are associated with clinical outcomes that shift throughout the course of severe SARS-CoV-2 pneumonia.
(A) K-means clustering of 865 differentially expressed genes (q < 0.05, likelihood-ratio test with FDR correction) across pneumonia diagnoses. Columns represent unique samples and column headers are color-coded by diagnosis, binary outcome (whether a given patient was discharged from the hospital alive or died during hospitalization), duration of mechanical ventilation (blanks indicate chronically ventilated patients), and infection status (presence or absence of bacterial superinfection in patients with COVID-19 or other viral pneumonia). The VAP (ventilator-associated pneumonia) flag designates samples from non-pneumonia controls or patients with COVID-19 or other viral pneumonia who cleared the virus and then developed a bacterial pneumonia. Samples were clustered using Ward’s minimum variance clustering method. Representative genes are shown for each cluster. (B) Gene set enrichment analysis (GSEA) of Hallmark gene sets for the pairwise comparison between COVID-19 samples and combined non-COVID-19 samples (non-pneumonia control, other pneumonia and other viral pneumonia). Count denotes pathway size after removing genes that were not detected. Enrichment denotes significant (q < 0.25 with FDR correction) upregulated (red) and downregulated (blue) pathways by normalized enrichment score. (C) GSEA of COVID-19 samples after performing correlation analysis of differentially expressed genes in CD4+ T cells and the binary outcome variable with Spearman rank correlation coefficient computation. Count denotes pathway size after removing genes not present in expression dataset. Enrichment denotes significant (q < 0.25 with FDR correction) upregulated (red) and downregulated (blue) pathways by normalized enrichment score. (D-E) Leading edge analysis reveals selected core genes driving pathway enrichment signal in the binary outcome variable. (F-G) GSEA of COVID-19 samples after performing correlation analysis of differentially expressed genes in CD4+ T cells and the duration of mechanical ventilation variable (F) and respiratory system compliance variable (G) with Spearman rank correlation coefficient computation. Count denotes pathway size after removing genes not present in expression dataset. Enrichment denotes significant (q < 0.25 with FDR correction) upregulated (red) and downregulated (blue) pathways by normalized enrichment score. (H-I) Leading edge analysis reveals selected core genes driving pathway enrichment signal in the duration of mechanical ventilation variable. (J-K) Leading edge analysis reveals selected core genes driving pathway enrichment signal in the respiratory system compliance variable.
Figure 4.
Figure 4.. Alveolar CD8+ T cell targets exhibit a distinctive pattern of antigen hierarchy that is associated with clinical outcomes throughout the course of severe SARS-CoV-2 pneumonia.
(A) Proportion of alveolar CD8+ T cell responses by SARS-CoV-2 protein. TCR sequences identified in samples from patients with COVID-19 were cross-referenced with the MIRA I dataset to identify reactivity against specific SARS-CoV-2 antigens. n of patients = 14, n of samples = 29. (B) SARS-CoV-2 antigen cross-referenced TCR sequences grouped by binary outcome. n of patients (Discharged = 9 and Deceased = 5), n of samples (Discharged = 15, Deceased = 14). q-value < 0.05, row wise Fisher exact tests with FDR correction (per antigen). (C) Nonstructural proteins (NSP) within the ORF1ab complex. n of patients = 13 and n of samples = 24. (D) NSP and binary outcome. n of patients (Discharged = 8 and Deceased = 5), n of samples (Discharged = 12 and Deceased = 12). q-value < 0.05, row wise Fisher exact tests with FDR correction (per NSP). (E) Timing of BAL sampling and binary outcome. n of patients (Discharged, ≤48 hours = 5; Deceased, ≤48 hours = 2; Discharged, >48 hours = 6; Deceased, >48 hours = 5) and n of samples (Discharged and ≤48 hours = 5; Deceased, ≤48 hours = 2; Discharged, >48 hours = 10; Deceased, >48 hours = 12). q-value < 0.05, row wise Fisher exact tests with FDR correction (per antigen). (F) Age and outcome. n of patients (Discharged, ≤65 years-old = 6; Deceased, ≥65 years-old = 2; Discharged, >65 years-old = 3; Deceased, >65 years-old = 3) and n of samples (Discharged, ≤65 years-old = 10; Deceased, ≤65 years-old = 5; Discharged, >65 years-old = 6; Deceased, >65 years-old = 8). q-value < 0.05, row wise Fisher exact tests with FDR correction (per antigen). (G) Network analysis of shared TCR sequences recognizing SARS-CoV-2 epitopes. Nodes represent unique patients in the COVID-19 group (labeled here A-N), edges constitute TCR sequences shared by at least 2 patients mapped to a MIRA class I dataset epitope pool, and width of edges (magnitude) denotes total number of shared TCR sequences. Edges are color-coded by SARS-CoV-2 antigens.
Figure 5.
Figure 5.. SARS-CoV-2 epitope mapping reveals a distinctive landscape of peptide immunodominance and immunoprevalence associated with outcomes in patients with COVID-19.
(A) Network analysis of shared TCR sequences from CD8+ T cells recognizing SARS-CoV-2 epitopes. Nodes represent the nine unique patients with COVID-19 who survived hospital discharge (labeled here using the lettering scheme from Figure 4G), edges constitute shared TCR sequences by at least two patients mapped to a MIRA class I dataset epitope pool, and width of edges (magnitude) denotes total number of shared TCR sequences. Edges are color-coded by SARS-CoV-2 antigens. (B) Immunoprevalence of SARS-CoV-2 epitopes in discharged patients was calculated by counting the number of events when a given epitope was shared by at least two patients. Total counts from all 21 identified epitopes are represented as percentage (%) of TCRs recognizing a given epitope. (C) Overall number of TCR sequences mapped to a given SARS-CoV-2 epitope in discharged patients was calculated by counting all events of TCRs recognizing an epitope. Total counts from all 21 identified epitopes are represented as percentage (%). (D) Network analysis of shared TCR sequences recognizing SARS-CoV-2 epitopes in the five unique patients with COVID-19 who died during hospitalization (labeled here using the lettering scheme from Figure 4G), edges constitute shared TCR sequences by at least two patients mapped to a MIRA class I dataset epitope pool, and width of edges (magnitude) denotes total number of shared TCR sequences. Edges are color-coded by SARS-CoV-2 antigens. (E) Immunoprevalence of SARS-CoV-2 epitopes in deceased patients was calculated by counting the number of events when a given epitope was shared by at least two patients. Total counts from all 27 identified epitopes are represented as percentage (%). (F) Overall number of TCR sequences mapped to a given SARS-CoV-2 epitope in deceased patients was calculated by counting all events of TCRs recognizing an epitope. Total counts from all 27 identified epitopes are represented as percentage (%). (G) Heatmap of predicted SARS-CoV-2 epitope binding affinity to patient-specific HLA molecules grouped by unique patient, binary outcome, HLA alleles, and SARS-CoV-2 antigens. Percentile rank denotes predicted affinity strength with percentile ranks <1% and <5% denote strong and weak MHC binder sequences, respectively. Gray tiles represent epitopes not detected within a given patient. Column labels are color-coded by patient, binary outcome, and HLA alleles. Row labels are color-coded by SARS-CoV-2 antigens. M (Membrane), 7b (ORF7b), 10 (OFR10), * denotes other epitopes are present within MIRA class I dataset peptide pool.
Figure 6.
Figure 6.. Predicted alveolar CD8+ T cell receptor targets cross-react with other human coronaviruses.
(A) Heatmap of conserved sequence similarity between dominant SARS-CoV-2 epitopes detected in alveolar CD8+ T cells and human coronaviruses (HCoV). Columns represent SARS-CoV-2 epitopes grouped and color-coded by antigen region. Rows are color-coded by distinct HCoV. Pairwise similarity denotes percentage of sequence homology between viruses. An average sequence homology percentage across all HCoV for each SARS-CoV-2 epitope is depicted as a dot in the column header. (B) Pairwise sequence similarity scores between SARS-CoV-2 epitopes and closest matching epitopes from human coronaviruses. q < 0.05, pairwise Wilcoxon rank-sum tests with FDR correction. (C) Scatter plot of SARS-CoV-2 epitope prevalence of CD8+ T cells in patients with COVID-19 (n = 14) and without COVID-19 (unexposed, n = non-pneumonia control [4], other pneumonia [7], and other viral pneumonia [8]). Dots are color coded by SARS-CoV-2 antigen. Dot size corresponds to the number of detected TCR sequences recognizing a given antigen. Random variation to location of points was added with geom_jitter function from ggplot2 v.3.4.4 for improved visualization. (D) SARS-CoV-2 epitope prevalence in overall patient cohort from bulk CD8+ TCR sequencing grouped by COVID-19 status (n of patients = non-pneumonia control [4], other pneumonia [7], COVID-19 [14] and other viral pneumonia [8]). Wilcoxon rank sum test, p < 0.05.

Similar articles

References

    1. Budinger GRS, Misharin AV, Ridge KM, Singer BD, Wunderink RG. Distinctive features of severe SARS-CoV-2 pneumonia. J Clin Invest. 2021;131(14). - PMC - PubMed
    1. Grasselli G, et al. Baseline characteristics and outcomes of 1591 patients infected with SARS-CoV-2 admitted to ICUs of the lombardy region, Italy. JAMA. 2020;323(16):1574–1581. - PMC - PubMed
    1. Huang C, et al. Clinical features of patients infected with 2019 novel coronavirus in Wuhan, China. Lancet. 2020;395(10223):497–506. - PMC - PubMed
    1. Grant RA, et al. Circuits between infected macrophages and T cells in SARS-CoV-2 pneumonia. Nature. 2021;590(7847):635–641. - PMC - PubMed
    1. Wendisch D, et al. SARS-CoV-2 infection triggers profibrotic macrophage responses and lung fibrosis. Cell. 2021;184(26):6243–6261 e6227. - PMC - PubMed

Publication types