[Preprint]. 2023 Dec 15:2023.12.13.571553.
doi: 10.1101/2023.12.13.571553.

Personalized Pangenome References

Affiliations

Personalized Pangenome References

Jouni Sirén et al. bioRxiv. .

Update in

  • Personalized pangenome references.
    Sirén J, Eskandar P, Ungaro MT, Hickey G, Eizenga JM, Novak AM, Chang X, Chang PC, Kolmogorov M, Carroll A, Monlong J, Paten B. Sirén J, et al. Nat Methods. 2024 Nov;21(11):2017-2023. doi: 10.1038/s41592-024-02407-2. Epub 2024 Sep 11. Nat Methods. 2024. PMID: 39261641

Abstract

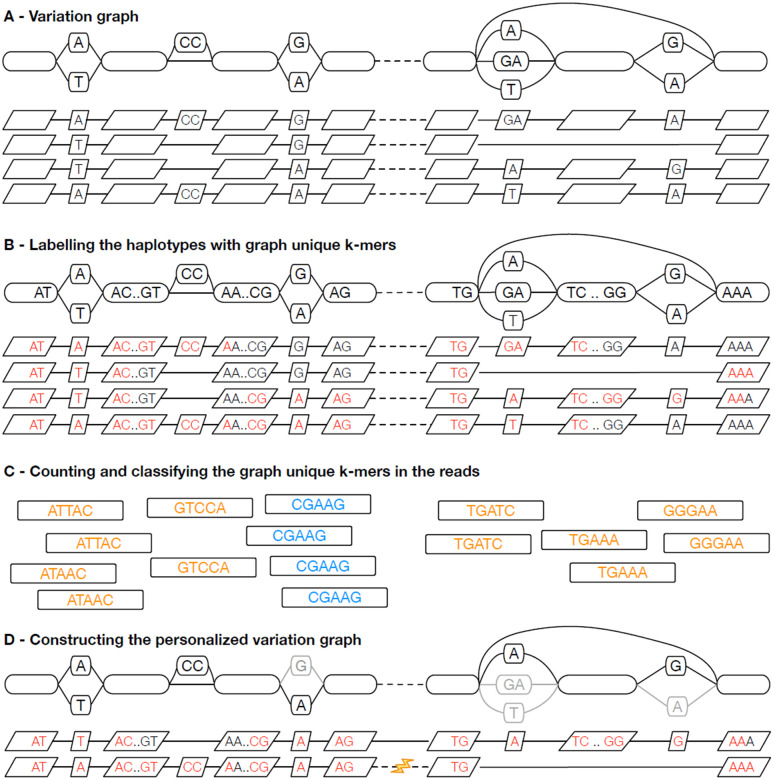
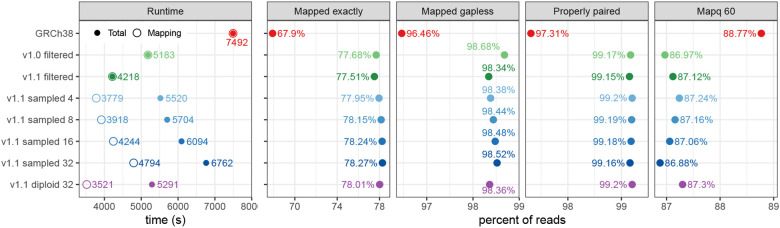
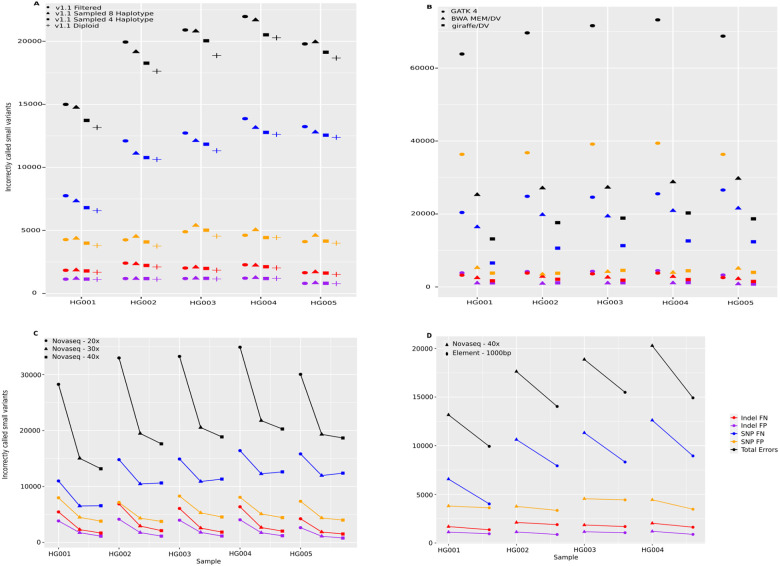
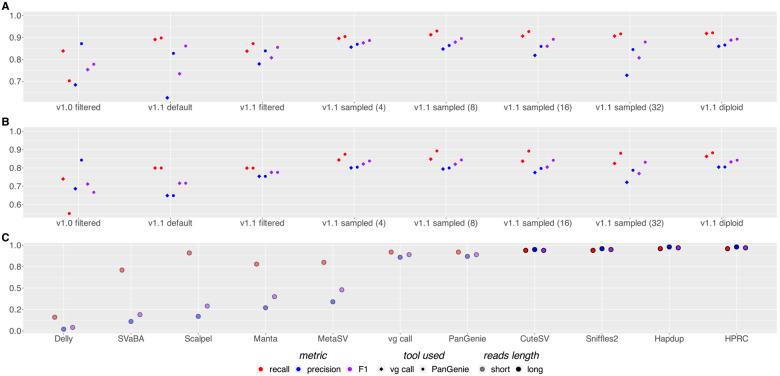
Pangenomes, by including genetic diversity, should reduce reference bias by better representing new samples compared to them. Yet when comparing a new sample to a pangenome, variants in the pangenome that are not part of the sample can be misleading, for example, causing false read mappings. These irrelevant variants are generally rarer in terms of allele frequency, and have previously been dealt with using allele frequency filters. However, this is a blunt heuristic that both fails to remove some irrelevant variants and removes many relevant variants. We propose a new approach, inspired by local ancestry inference methods, that imputes a personalized pangenome subgraph based on sampling local haplotypes according to k-mer counts in the reads. Our approach is tailored for the Giraffe short read aligner, as the indexes it needs for read mapping can be built quickly. We compare the accuracy of our approach to state-of-the-art methods using graphs from the Human Pangenome Reference Consortium. The resulting personalized pangenome pipelines provide faster pangenome read mapping than comparable pipelines that use a linear reference, reduce small variant genotyping errors by 4x relative to the Genome Analysis Toolkit (GATK) best-practice pipeline, and for the first time make short-read structural variant genotyping competitive with long-read discovery methods.


Figures

Figure 1:
Figure 1:. Illustrating haplotype sampling at adjacent blocks in the pangenome.
(A) A variation graph representing adjacent locations in the pangenome, composed of a bidirected sequence graph (top) and a set of embedded haplotypes (below); the dotted lines represent the boundary between the two blocks. (B) k-mers that occur once within the graph, termed graph-unique k-mers, are identified in the haplotypes; here k = 5 and graph-unique k-mers are colored red. The presence and absence of these graph-unique k-mers identifies each haplotype. (C) The graph-unique k-mers are counted in the reads, and based upon counts classified as present, likely heterozygous (shown in orange), present, likely homozygous (shown in blue), or absent (all red kmers in (B) not identified in the reads). (D) Using the identified graph-unique k-mer classifications, a subset of haplotypes are selected at each location, defining a personalized pangenome reference subgraph of the larger graph. Where needed, recombinations are introduced (see lightning bolt) to create contiguous haplotypes.
Figure 2:
Figure 2:. Mapping 30x NovaSeq reads for HG002 to GRCh38 (with BWA-MEM) and to HPRC graphs (with Giraffe).
The graphs (y-axis) are Minigraph–Cactus graphs built using GRCh38 as the reference. For the sampled graphs, we tested sampling 4, 8, 16, and 32 haplotypes. For the v1.1 diploid graph, 32 candidate haplotypes were used for diploid sampling. We show the overall running time and the time spent for mapping only (left), and the fraction of reads with an exact, gapless, properly paired, and mapping quality 60 alignment.
Figure 3:
Figure 3:. Small Variants evaluation across samples HG001 to HG005.
(A) The number of false positive (FPs) and false negative (FNs) indels and SNPs across four different graphs, each using GRCh38 as the reference: v1.1 filtered, v1.1 sampled with 4 and 8 haplotypes, and v1.1 diploid, using the Giraffe/DeepVariant pipeline. (B) Comparing the Giraffe/DeepVariant using the v1.1 diploid graph to BWA MEM/DeepVariant and GATK best practice pipelines, both using the GRCh38 reference. (C) The performance of the Giraffe/DeepVariant pipeline using the v1.1 diploid graph with different coverage levels of NovaSeq reads (20x, 30x, and 40x). (D) Comparing the number of errors using either NovaSeq 40x data or Element 36x - 1000bp insert data; in both cases, using the Giraffe/DeepVariant pipeline with the v1.1 diploid graph. HG005 Element sequencing data was not available for comparison.
Figure 4:
Figure 4:. SVs benchmark evaluation.
(A) Precision, recall, and F1 scores of both vg call and PanGenie for different pangenome reference graphs on the GIAB v0.6 Tier1 call set. Graphs were built using GRCh38 as the reference. (B) As with (A) but using a benchmark set of SVs created with DipCall from the T2T v0.9 HG002 genome assembly, comparing genome-wide but excluding centromeres. (C) Comparing the performance of PanGenie and vg call using the 1.1 diploid graph to other genotyping methods. Illumina short reads were used with Delly [27], SVaBA [37], Scalpel [8], Manta [4] and MetaSV [22] as well as with vg call [12] and PanGenie [6]. Also shown are long-read methods (CuteSV [15], Sniffles2 [32], Hapdup [17], and Human Pangenome Reference Consortium de novo assemblies [20]).

References

    1. Baid Gunjan et al. “An Extensive Sequence Dataset of Gold-Standard Samples for Benchmarking and Development”. bioRxiv. 2020. DOI: 10.1101/2020.12.11.422022. - DOI
    1. Carroll Andrew et al. “Accurate human genome analysis with Element Avidity sequencing”. bioRxiv. 2023. DOI: 10.1101/2023.08.11.553043. - DOI
    1. Chang Xian et al. “Distance indexing and seed clustering in sequence graphs”. In: Bioinformatics 36.Supplement_1 (2020), pp. i146–i153. DOI: 10.1093/bioinformatics/btaa446. - DOI - PMC - PubMed
    1. Chen Xiaoyu et al. “Manta: rapid detection of structural variants and indels for germline and cancer sequencing applications”. In: Bioinformatics 32.8 (2016), pp. 1220–1222. DOI: 10.1093/bioinformatics/btv710. - DOI - PubMed
    1. Dufresne Yoann et al. “The K-mer File Format: a standardized and compact disk representation of sets of k-mers”. In: Bioinformatics 38.18 (2022), pp. 4423–4425. DOI: 10.1093/bioinformatics/btac528. - DOI - PMC - PubMed

Publication types