[Preprint]. 2024 Apr 4:2023.12.07.570716.
doi: 10.1101/2023.12.07.570716.

Visual imagery vividness correlates with afterimage conscious perception

Affiliations

Visual imagery vividness correlates with afterimage conscious perception

Sharif I Kronemer et al. bioRxiv. .

Update in

Abstract

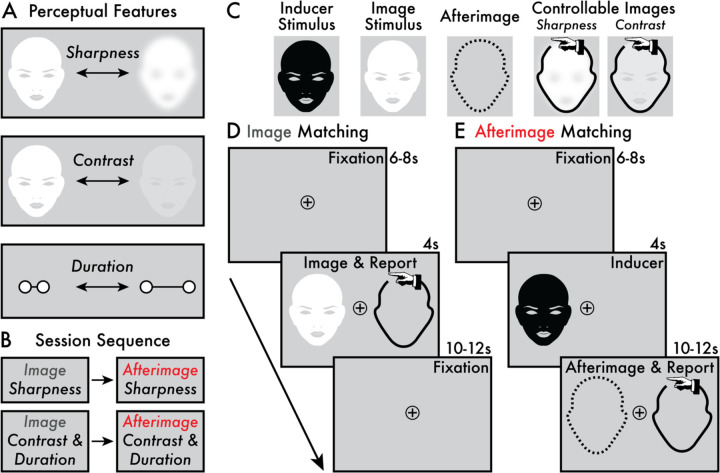
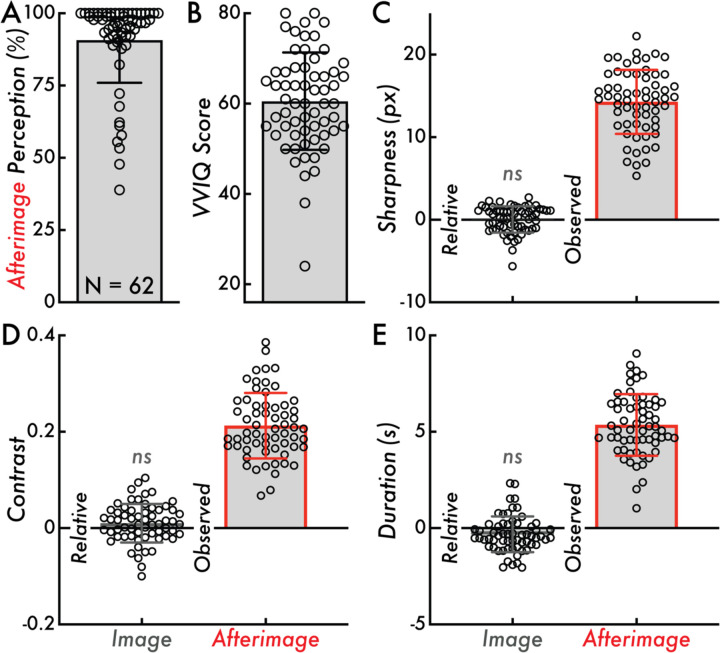
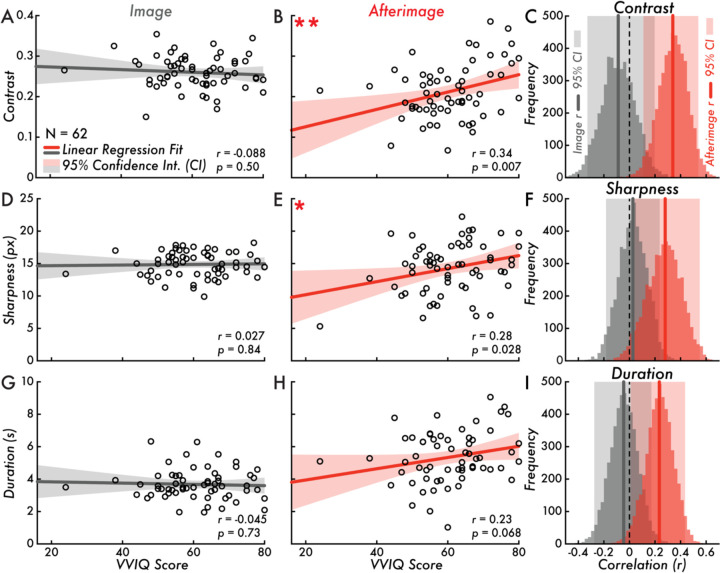
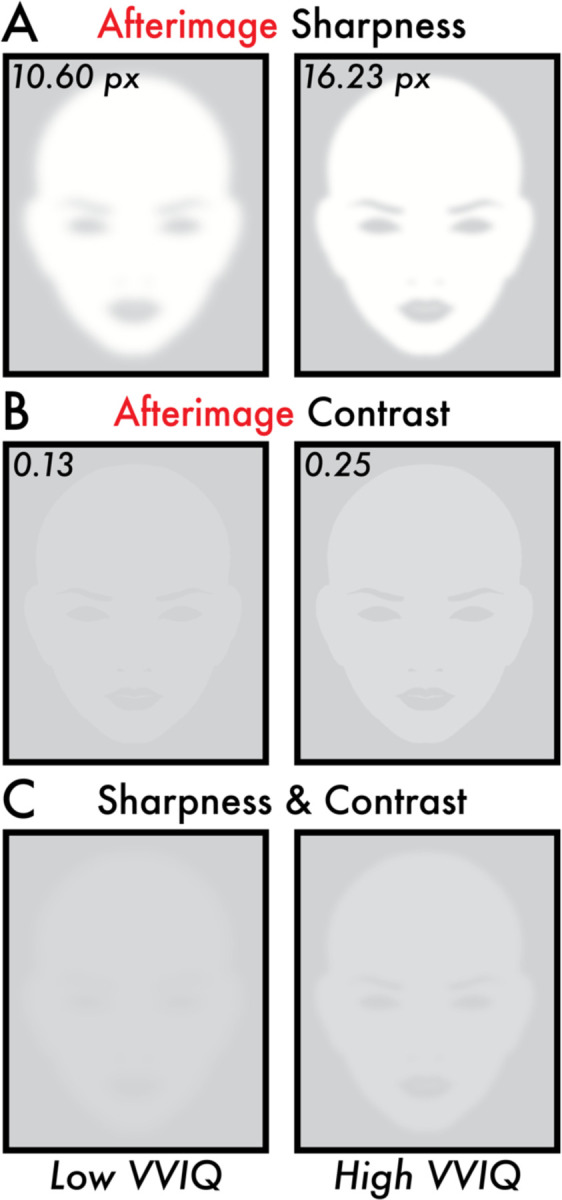
Afterimages are illusory, visual conscious perceptions. A widely accepted theory is that afterimages are caused by retinal signaling that continues after the physical disappearance of a light stimulus. However, afterimages have been reported without preceding visual, sensory stimulation (e.g., conditioned afterimages and afterimages induced by illusory vision). These observations suggest the role of top-down, brain mechanisms in afterimage conscious perception. Therefore, some afterimages may share perceptual features with sensory-independent conscious perceptions (e.g., imagery, hallucinations, and dreams) that occur without bottom-up, sensory input. In the current investigation, we tested for a link between the vividness of visual imagery and afterimage conscious perception. Participants reported their vividness of visual imagery and perceived sharpness, contrast, and duration of negative afterimages. The afterimage perceptual features were acquired using perception matching paradigms that were validated on image stimuli. Relating these perceptual reports revealed that the vividness of visual imagery positively correlated with afterimage contrast and sharpness. These behavioral results support shared neural mechanisms between visual imagery and afterimages. This study encourages future research combining neurophysiology recording methods and afterimage paradigms to directly examine the neural mechanisms of afterimage conscious perception.


Conflict of interest statement

Declaration of Interests The authors declare no competing interests.

Figures

Figure 1.
Figure 1.. Target perceptual features, session sequence, and perception matching paradigms.
(A) The target image and afterimage perceptual features were: (1) sharpness, (2) contrast, and (3) duration. (B) Participants completed four task phases in the following order: (1) image and (2) afterimage sharpness perception matching and (3) image and (4) afterimage contrast and duration perception matching. (C) The stimuli and controllable images presented in the perception matching tasks. The afterimage perception is depicted as a dashed outline because no image was physically presented – the afterimage is an illusory conscious perception. Depending on the task phase, the controllable image allowed participants to manually adjust its sharpness or contrast. The controllable image is depicted with a hand icon (not present during the task) to indicate that participants manually adjusted these images with key presses. (D) The main trial phases of the image perception matching task (Supplementary Movies 2 and 4). Each trial began with a fixation interval (6–8 seconds [s]). When the image stimulus appeared (4 s) on either the left or right side of the central fixation, participants were instructed to immediately adjust the controllable image using key presses to match with the image stimuli according to the target perceptual feature (i.e., sharpness and contrast/duration; see Image Sharpness and Contrast and Duration Perception Matching Paradigm Methods sections). A subsequent fixation interval (10–12 s) followed the Image & Report stage prior to initiating the next trial. (E) The main trial events of the afterimage perception matching task (Supplementary Movies 3 and 5). Each trial began with a jittered fixation interval (6–8 s). Next, the inducer stimulus was shown (4 s) on either the left or right side of the central fixation and, subsequently, an afterimage might appear. If an afterimage was perceived, participants were instructed to immediately adjust the controllable image to match with the target perceptual feature of their afterimage (i.e., sharpness and contrast/duration; see Afterimage Sharpness and Contrast and Duration Perception Matching Paradigm Methods sections). The Afterimage & Report stage completed when the participant no longer perceived their afterimage, and the remaining duration of time (10–12 s) was a fixation interval prior to initiating the next trial.
Figure 2.
Figure 2.. Afterimage perception rate, VVIQ score, and relative image and observed afterimage sharpness, contrast, and duration.
(A) Afterimage perception rate calculated as the percentage of inducers where a subsequent afterimage was reported across all trials of the afterimage perception matching tasks (90 trials total). The bar graph indicates the mean afterimage perception percentage across participants (90.79%) and the error bar displays standard deviation (SD; 14.84%). (B) The Vividness of Visual Imagery Questionnaire (VVIQ) score calculated as the sum of scores across all questionnaire items within participant (score range: 16–80; larger values indicating more vivid visual imagery). The bar graph indicates the mean VVIQ score (60.55) and the error bars display the SD (10.78). (C) Relative image and observed afterimage reported maximum sharpness in pixels (px). The relative image sharpness is compared on a trial level against the true image sharpness (true values: 10, 15, or 20 px). The bar height indicates the group mean (Relative = 0.033 px; Observed = 14.27 px) and the error bars display SD (Relative = 1.60 px; Observed = 3.88 px). (D) Relative image and observed afterimage reported maximum contrast. The relative image contrast is compared against the true image maximum contrast (0.25). The bar height indicates the group mean (Relative = 0.01; Observed = 0.21) and the error bars display SD (Relative = 0.04; Observed = 0.068). (E) Relative image and observed afterimage reported duration in seconds (s). The relative image contrast is compared against the true image duration (4 s). The bar height indicates the group mean (Relative = −0.33 s; Observed = 5.35 s) and the error bars display SD (Relative = 0.93 s; Observed = 1.60 s). Comparing the relative image contrast, sharpness, and duration values from zero was not statistically significant (ns; Wilcoxon Rank Sum tests, p > 0.05). In all subplots, the open circles represent individual participants (N = 62).
Figure 3.
Figure 3.. VVIQ score versus image and afterimage contrast, sharpness, and duration.
(A) Vividness of Visual Imagery Questionnaire (VVIQ) score versus image contrast (correlation is not statistically significant; Pearson correlation coefficient [r] = −0.088; p = 0.50). (B) VVIQ score versus afterimage contrast (correlation is statistically significant **; r = 0.34; p = 0.007). (C) Bootstrapped image and afterimage VVIQ score and contrast correlation distributions and estimated 95% confidence interval (CI; image: [−0.33, 0.20]; afterimage: [0.11, 0.54]). (D) VVIQ score versus image sharpness (correlation is not statistically significant; r = 0.027; p = 0.84). (E) VVIQ score versus afterimage sharpness (correlation is statistically significant *; r = 0.28; p = 0.028). (F) Bootstrapped image and afterimage VVIQ score and sharpness correlation distributions and estimated 95% CI (image: [−0.18, 0.24]; afterimage: [0.041, 0.55]). (G) VVIQ score versus image duration (correlation is not statistically significant; r = −0.045; p = 0.73). (H) VVIQ score versus afterimage duration (correlation is not statistically significant; r = 0.23; p = 0.068). (I) Bootstrapped image and afterimage VVIQ score and duration correlation distributions and estimated 95% CI (image: [−0.28, 0.17]; afterimage: [0.01, 0.44]). Subplots A, B, D, E, G, and H, display the VVIQ score along the horizontal axis (score range: 16–80; larger values indicating more vivid visual imagery). The gray and red lines draw the linear regression fit of VVIQ score versus image or afterimage contrast, sharpness, and duration. The shaded area on either side of the main trend line is the 95% CI of the linear regression fit. The open circles represent individual participants (N = 62). In subplots C, F, and I, the gray and red vertical lines draw the Pearson correlation coefficient r value of VVIQ score versus image or afterimage contrast, sharpness, and duration. The shaded area behind the bootstrap correlation distributions is the estimated 95% CI.
Figure 4.
Figure 4.. Image reconstruction of the estimated perceived afterimage sharpness and contrast for low and high VVIQ score participants.
All subplots display image reconstructions of the estimated perceived afterimage sharpness and contrast values according to the fitted linear regression trend lines (Figure 3B, E) for low and high Vividness of Visual Imagery Questionnaire (VVIQ) scores. The low and high VVIQ scores are the minimum (24) and maximum (80) VVIQ scores reported among participants (Figure 2B). (A) Image reconstruction of the estimated perceived afterimage sharpness for low (10.60 pixels [px]) and high (16.23 px) VVIQ scores. (B) Image reconstruction of the estimated perceived afterimage contrast for low (0.13) and high (0.25) VVIQ scores. (C) Image reconstruction combining the estimated perceived afterimage sharpness (A) and contrast (B) for low (10.60 px and 0.13) and high (16.23 px and 0.25) VVIQ scores. Image reconstructions show apparent differences in overall visibility and facial feature details for the estimated perceived sharpness and contrast of afterimages between low and high VVIQ score participants.

Similar articles

Cited by

References

    1. Rosenblith W. A., Miller G. A., Egan J. P., Hirsh I. J. & Thomas G. J. An Auditory Afterimage? Science 106, 333–335 (1947). 10.1126/science.106.2754.333 - DOI - PubMed
    1. Wiegrebe L., Kössl M. & Schmidt S. Auditory sensitization during the perception of acoustical negative afterimages: Analogies to visual processing? Naturwissenschaften 82, 387–389 (1995). 10.1007/BF01134569 - DOI - PubMed
    1. Zwicker E. “Negative afterimage” in hearing. The Journal of the Acoustical Society of America 36, 2413–2415 (1964). 10.1121/1.1919373 - DOI - PubMed
    1. Williams J. L. Evidence of complementary afterimages in the pigeon. J Exp Anal Behav 21, 421424 (1974). 10.1901/jeab.1974.21-421 - DOI - PMC - PubMed
    1. Duysens J., Orban G. A., Cremieux J. & Maes H. Visual cortical correlates of visible persistence. Vision Res 25, 171–178 (1985). 10.1016/0042-6989(85)90110-5 - DOI - PubMed

Publication types