[Preprint]. 2023 Dec 14:2023.12.13.571184.
doi: 10.1101/2023.12.13.571184.

Loss of Endothelial TDP-43 Leads to Blood Brain Barrier Defects in Mouse Models of Amyotrophic Lateral Sclerosis and Frontotemporal Dementia

Affiliations

Loss of Endothelial TDP-43 Leads to Blood Brain Barrier Defects in Mouse Models of Amyotrophic Lateral Sclerosis and Frontotemporal Dementia

Ashok Cheemala et al. bioRxiv. .

Update in

Abstract

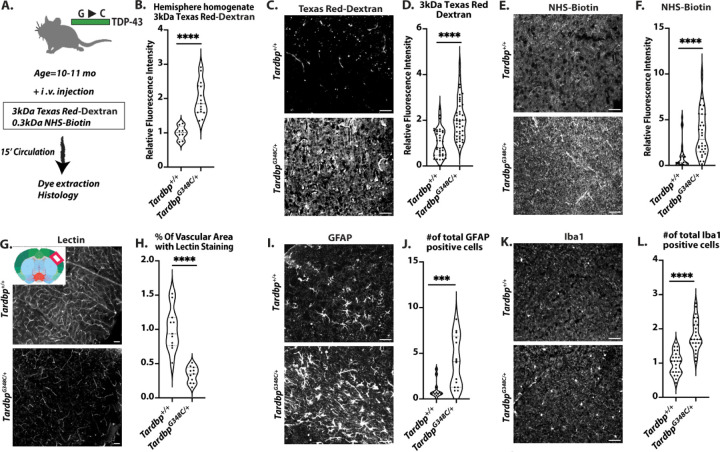
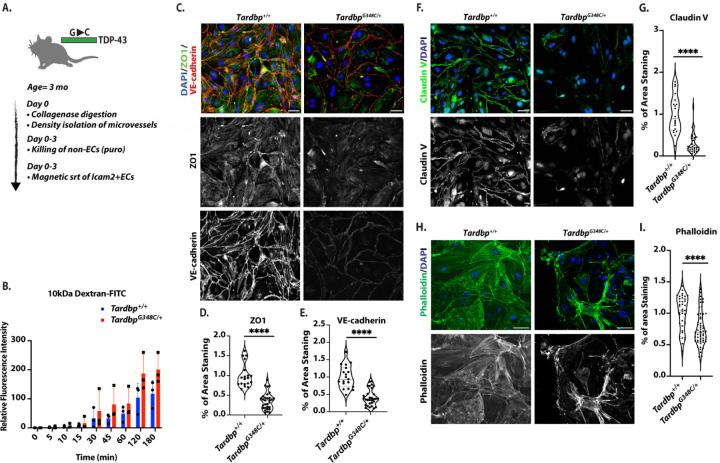
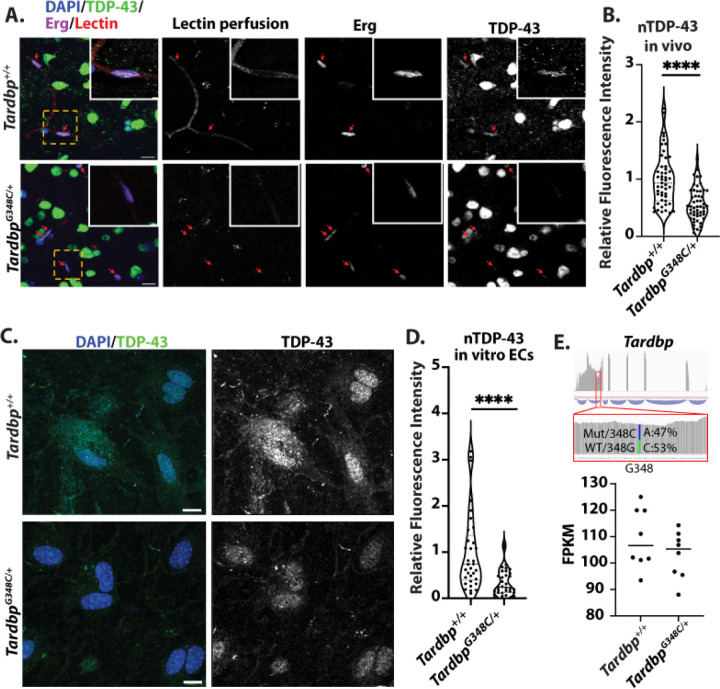
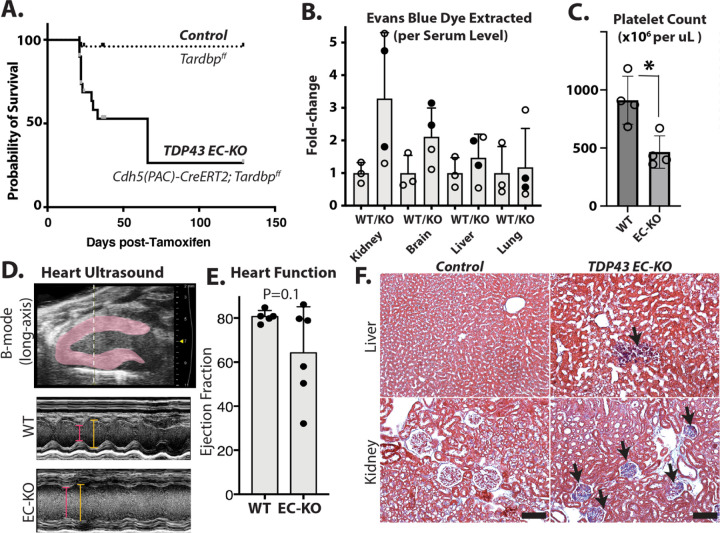
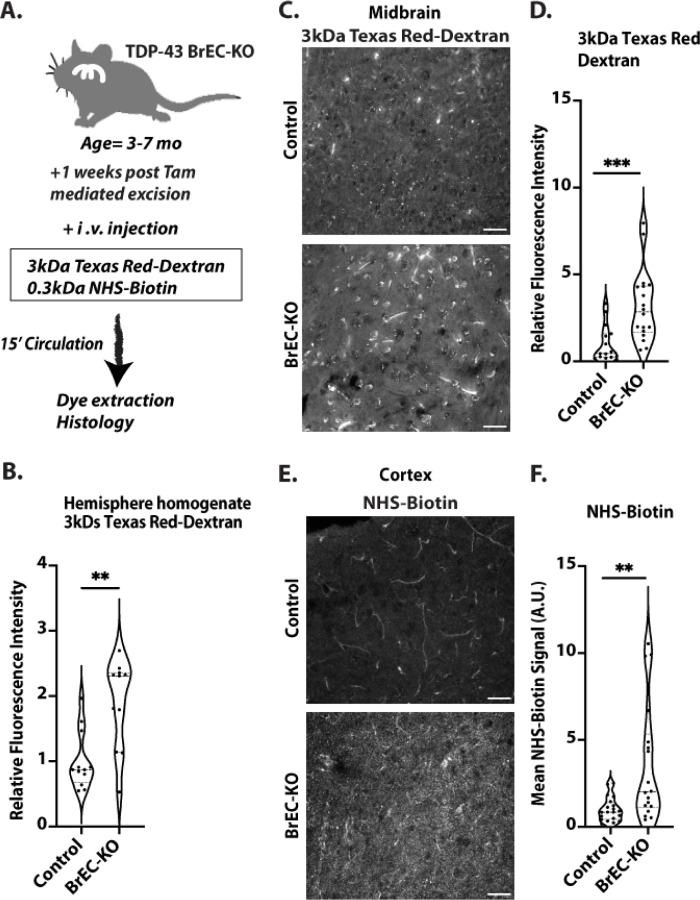
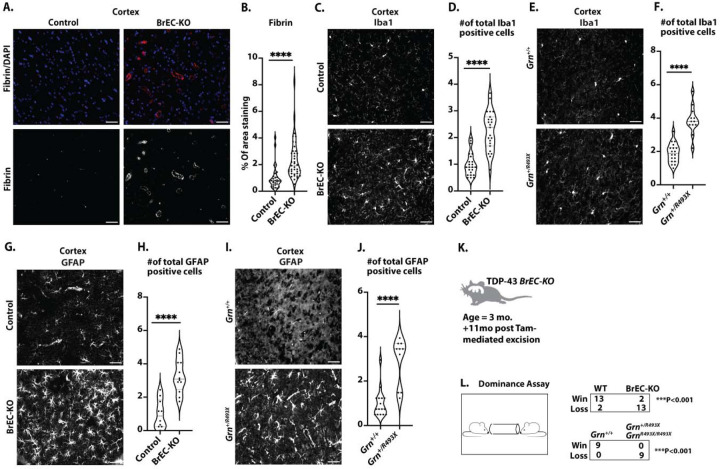
Loss of nuclear TDP-43 occurs in a wide range of neurodegenerative diseases, and specific mutations in the TARDBP gene that encodes the protein are linked to familial Frontal Temporal Lobar Dementia (FTD), and Amyotrophic Lateral Sclerosis (ALS). Although the focus has been on neuronal cell dysfunction caused by TDP-43 variants, TARDBP mRNA transcripts are expressed at similar levels in brain endothelial cells (ECs). Since increased permeability across the blood brain barrier (BBB) precedes cognitive decline, we postulated that altered functions of TDP-43 in ECs contributes to BBB dysfunction in neurodegenerative disease. To test this hypothesis, we examined EC function and BBB properties in mice with either knock-in mutations found in ALS/FTLD patients (TARDBP G348C and GRN R493X ) or EC-specific deletion of TDP-43 throughout the endothelium (Cdh5(PAC)CreERT2; Tardbp ff ) or restricted to brain endothelium (Slco1c1(BAC)CreERT2; Tardbp ff ). We found that TARDBP G348C mice exhibited increased permeability to 3kDa Texas Red dextran and NHS-biotin, relative to their littermate controls, which could be recapitulated in cultured brain ECs from these mice. Nuclear levels of TDP-43 were reduced in vitro and in vivo in ECs from TARDBP G348C mice. This coincided with a reduction in junctional proteins VE-cadherin, claudin-5 and ZO-1 in isolated ECs, supporting a cell autonomous effect on barrier function through a loss of nuclear TDP-43. We further examined two models of Tardbp deletion in ECs, and found that the loss of TDP-43 throughout the endothelium led to systemic endothelial activation and permeability. Deletion specifically within the brain endothelium acutely increased BBB permeability, and eventually led to hallmarks of FTD, including fibrin deposition, microglial and astrocyte activation, and behavioral defects. Together, these data show that TDP-43 dysfunction specifically within brain ECs would contribute to the BBB defects observed early in the progression of ALS/FTLD.


Figures

Figure 1.
Figure 1.. Blood brain barrier disruption and vascular sequelae in TardbpG348C/+ mice
(A) A schematic illustration of the assay for measuring BBB permeability is presented in Figure A. (B) The quantification process involved homogenizing brain tissue samples from 10–11month-old wild-type Tardbp+/+ mice (n=8) and their heterozygous littermates, TardbpG348C/+ mice (n=15), followed by measuring fluorescence intensity at 590 nm. Representative images of (C) 3kDa Texas Red-dextran leakage, (E) NHS-Biotin, (G) Tomato-lectin perfusion, (I) GFAP staining of astrocytes and (K) Iba1 staining of microglia in the mouse brain cortex reveal consistent results across Tardbp+/+ mice (n=3) and TardbpG348C/+ mice (n=3). (D, F, H) Quantification of data, with each data point representing the fluorescence image intensity in one image. (J, L) Quantification of data with each data point representing the number of activated cells in an image. multiple images per mouse. Scale bars, 50 μm. Data are presented as means ± SEM. Statistical analysis was conducted using an unpaired Mann Whitney test, with significance levels indicated as follows: ***P 0.0001, ****P<0.0001.
Figure 2.
Figure 2.. Endothelial cells isolated from TardbpG348C/+ mice exhibited decreased levels of cell junction proteins, altered actin organization, and increased permeability
(A) Schematic illustration of the isolation and purification of ECs. (B) Passage of 10kDa FITC-Dextran dye across confluent monolayers of endothelial cells isolated from Tardbp+/+ (n=3) and TardbpG348C/+ (n=3). Statistical analysis was conducted using linear regression, ****P ≤ 0.0001. (C, F, H) Representative images of mouse brain endothelial cells isolated from 3-month-old wild-type Tardbp+/+ (n=6) and their heterozygous littermates, TardbpG348C/+ mice (n=6), immunostained with antibodies to the indicated proteins. (D, G, I) Quantification of data, with each data point representing the fluorescence image intensity in one image, multiple images taken of cells from each mouse. Scale bars: 50 μm. Data are presented as means ± SEM. Data are presented as means ± SEM. Statistical analysis was conducted using an unpaired Mann Whitney test, with significance levels indicated as follows: ****P ≤ 0.0001.
Figure 3.
Figure 3.. Reduced nuclear levels of TDP-43 in endothelial cells of TardbpG348C/+ Mice
(A) Representative confocal images of mouse brain frontal cortex sections from 10-month-old wild-type Tardbp+/+ (n=6) and their heterozygous littermates, TardbpG348C/+ mice (n=6), Shown are representative low magnification and high magnification (insert) immunofluorescence images for the indicated markers. Each red arrow indicates vascular endothelial nuclear TDP-43 immunostaining. (B) Quantification of TDP-43, each data point represents one vascular endothelial cell nucleus. (C) Representative confocal images of mouse brain endothelial cells isolated from 3-month-old wild-type Tardbp+/+ (n=6) and their heterozygous littermates, TardbpG348C/+ mice (n=6), immunostained with antibodies against endogenous TDP-43 (green) and DAPI (blue). (D) Quantification of nuclear TDP-43 levels in isolated endothelial cells, confirming a reduction in TDP-43 in TardbpG348C/+ mice, each data point represents one endothelial cell nucleus. (E) RNA-sequencing analysis of endothelial cells derived from TardbpG348C/+ mice and littermate controls showed no significant differences in mRNA expression. Phased analysis of transcripts derived from the mutated G348C allele and the wildtype allele in the same cells revealed no differences in mRNA transcript levels. Data are presented as means ± SEM. Statistical analysis was conducted using an unpaired Mann Whitney test, with significance levels indicated as follows :****P ≤ 0.0001. (A&C) Scale bar: 50 μm.
Figure 4.
Figure 4.. Tardbp EC-KO mice exhibit endothelial dysfunction and vascular leak in multiple tissues.
Phenotypic analysis of TDP-43 EC-KO mice versus littermate controls at 3–4 weeks of age. (A) Mice are moribund by 3–4 weeks post-Tam treatment and gene excision. (B) Vascular leak assessed by Evans blue (EB) dye extraction (tissue EB normalized by plasma EB, presented as a fold change over the same tissue from control mice). (C) Absolute platelet count measured by flow cytometry of blood, normalized to littermate controls. (D, E) Ultrasound with quantitation, demonstrating impaired ejection fraction in EC-KO mice (n=6 EC-KO and 5 littermate controls). (F) Fibrosis was observed in trichrome-stained tissues (blue staining indicates collagen). (C) Statistical analysis was performed using an unpaired two-tailed Student’s t-test. (C&E) Statistical analysis was conducted using the Mann-Whitney test, *P<0.05.
Figure 5.
Figure 5.. Blood brain barrier disruption in Tardbp BrEC-KO mice
(A) Schematic representation of the assay for measuring blood-brain barrier (BBB) permeability. (B) Measurement of 3kDa Texas Red-Dextran in homogenized brain tissue one week after Tamoxifen treatment of BrEC-KO mice (n=11) and littermate controls (n=12). **P<0.0034. (C&E) Representative images of (C) 3kDa Texas Red-Dextran leakage and (E) NHS-biotin in the cortex of 3–7-month-old mice (n=3 BrEC-KO and n=3 littermate controls). (D&F) Quantification signal, with each data point representing the fluorescence image intensity from one image, multiple images per mouse. Scale bars, 50 μm. Data are presented as means ± SEM. Statistical analysis was conducted using an unpaired Mann Whitney test, with significance levels indicated as follows: **P<0.0019, ***P<0.0002.
Figure 6.
Figure 6.. Consistent perturbations of transcriptional levels indicates core pathways targeted by partial or complete loss of nuclear TDP-43.
(A-C) Outline of approach, indicating the biological replicates of each condition. (A) Shows conditions from which brain endothelial cells were sorted by flow cytometry. (B) Shows isolation procedure from carotid artery with disturbed flow. (C) Shows in vitro conditions, using primary human brain endothelial cells or purified endothelial cells isolated from BrEC-KO or KI mice. Additional details on the samples used for RNA isolation and transcriptional analysis are contained in the methods. (E) Heat map and clustering (UPGMA algorithm) of the most consistently affected KEGG and Hallmark pathways (human to mouse liftover by Biomart). Other datasets including show the top 200 transcripts up or down regulated, by p-value and after setting expression level cutoff, from a range of datasets in the literature or the lab. (F-L) Example GSEA plots for top scoring pathways. FDR value derived from GSEA analysis is shown, ***P<0.001, **P<0.01, *P<0.05.
Figure 7.
Figure 7.. Splicing alterations associated with the loss of nuclear TDP-43 affect proteins in pathways enriched in altered mRNA transcripts.
(A) Leafcutter (Leafviz) analysis of example splicing events differentially regulated in BrEC-KO cells in vivo, some of which are also seen in KI cells in vivo. Line plots to the right show read density in each of the replicates across the alternatively spliced region. (B) Heat map and clustering (UPGMA algorithm) of the most consistently affected KEGG and Hallmark pathways, and determine by GseaPy ENRICHR. (B) FDR value derived from GSEA analysis is shown.
Figure 8:
Figure 8:. Pathological and behavioral consequences of chronic endothelial TDP-43 loss.
(A) Representative immunofluorescence images of fibrin deposition in mouse brain frontal cortex sections from 8–11-month-old mice (n=3 BrEC-KO and n=3 littermate controls) are shown. (C, E) Iba1 staining of microglia in the mouse brain cortex reveals consistent results across n=3 BrEC-KO and n=3 littermate controls mice (n=3), as well as n=3 GrnR493X/+ and n=3 littermate controls mice (n=3) and (G, I) GFAP staining of astrocytes reveals a substantial increase in astrocyte numbers, resembling astrogliosis observed in FTD. (K, L) Behavioral Testing: Tube dominance test results for BrEC-KO mice and GrnR493X/+ mice, showing a high “loss” percentage in both models. (B) Quantification of data, with each data point representing the fluorescence image intensity in one image. (D, F, H, J) Quantification of data with each data point representing the number of activated cells in an image. multiple images per mouse. Scale bars, 50 μm. Data are presented as means ± SEM. Statistical analysis was conducted using an unpaired Mann Whitney test, with significance levels indicated as follows: ****P<0.0001.

References

    1. Tziortzouda P, Van Den Bosch L, Hirth F. Triad of TDP43 control in neurodegeneration: autoregulation, localization and aggregation. Nat Rev Neurosci. 2021. Apr;22(4):197–208. - PubMed
    1. Brown AL, Wilkins OG, Keuss MJ, Hill SE, Zanovello M, Lee WC, et al. TDP-43 loss and ALS-risk SNPs drive mis-splicing and depletion of UNC13A. Nature. 2022. Mar;603(7899):131–7. - PMC - PubMed
    1. Ma XR, Prudencio M, Koike Y, Vatsavayai SC, Kim G, Harbinski F, et al. TDP-43 represses cryptic exon inclusion in the FTD-ALS gene UNC13A. Nature. 2022. Mar;603(7899):124–30. - PMC - PubMed
    1. Ling JP, Pletnikova O, Troncoso JC, Wong PC. TDP-43 repression of nonconserved cryptic exons is compromised in ALS-FTD. Science. 2015. Aug 7;349(6248):650–5. - PMC - PubMed
    1. Melamed Z, López-Erauskin J, Baughn MW, Zhang O, Drenner K, Sun Y, et al. Premature polyadenylation-mediated loss of stathmin-2 is a hallmark of TDP-43-dependent neurodegeneration. Nat Neurosci. 2019. Feb;22(2):180–90. - PMC - PubMed

Publication types