[Preprint]. 2023 Dec 13:2023.12.13.571474.
doi: 10.1101/2023.12.13.571474.

Genome-wide CRISPRi Screen in Human iNeurons to Identify Novel Focal Cortical Dysplasia Genes

Affiliations

Genome-wide CRISPRi Screen in Human iNeurons to Identify Novel Focal Cortical Dysplasia Genes

Andrew M Tidball et al. bioRxiv. .

Abstract

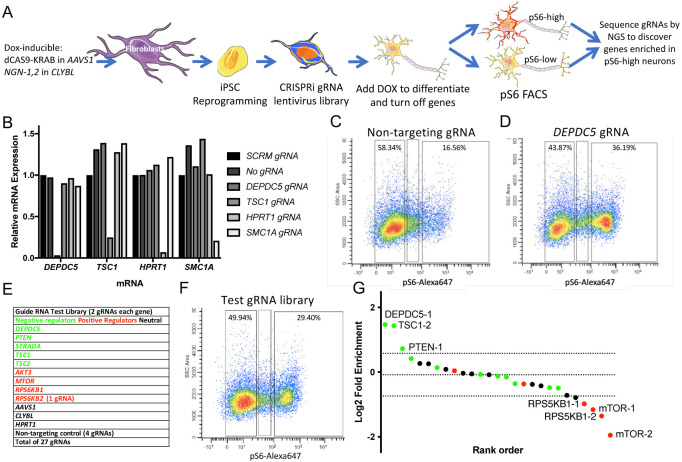
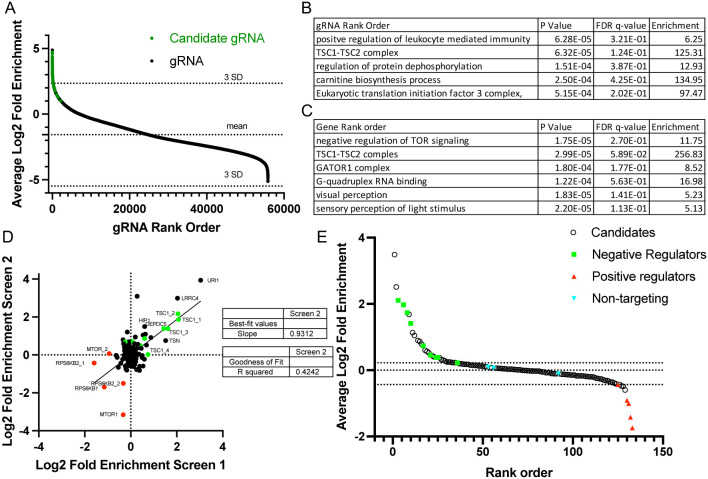
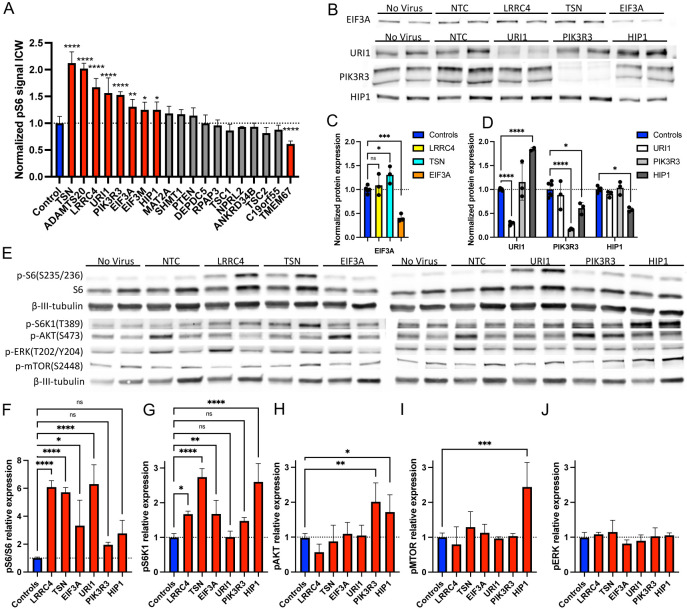
Focal cortical dysplasia (FCD) is a common cause of focal epilepsy that typically results from brain mosaic mutations in the mTOR cell signaling pathway. To identify new FCD genes, we developed an in vitro CRISPRi screen in human neurons and used FACS enrichment based on the FCD biomarker, phosphorylated S6 ribosomal protein (pS6). Using whole-genome (110,000 gRNAs) and candidate (129 gRNAs) libraries, we discovered 12 new genes that significantly increase pS6 levels. Interestingly, positive hits were enriched for brain-specific genes, highlighting the effectiveness of using human iPSC-derived induced neurons (iNeurons) in our screen. We investigated the signaling pathways of six candidate genes: LRRC4, EIF3A, TSN, HIP1, PIK3R3, and URI1. All six genes increased phosphorylation of S6. However, only two genes, PIK3R3 and HIP1, caused hyperphosphorylation more proximally in the AKT/mTOR/S6 signaling pathway. Importantly, these two genes have recently been found independently to be mutated in resected brain tissue from FCD patients, supporting the predictive validity of our screen. Knocking down each of the other four genes (LRRC4, EIF3A, TSN, and URI1) in iNeurons caused them to become resistant to the loss of growth factor signaling; without growth factor stimulation, pS6 levels were comparable to growth factor stimulated controls. Our data markedly expand the set of genes that are likely to regulate mTOR pathway signaling in neurons and provide additional targets for identifying somatic gene variants that cause FCD.

Keywords: Biological sciences; CRISPRi screen; Neuroscience/Genetics; epilepsy; focal cortical dysplasia; iNeuron; mTOR.


Conflict of interest statement

Competing Interest Statement: The authors declare no conflict of interest. The funders had no role in the design of the study; in the collection, analyses, or interpretation of data; in the writing of the manuscript; or in the decision to publish the results.

Figures

Figure 1.
Figure 1.
CRISPRi gRNA library screening identifies positive and negative regulators of mTOR signaling in human iPSC-derived iNeurons. (A) Schematic depicting the screening platform design, including the cell line generation, gRNA lentiviral transduction, dox treatment, pS6-based FACS, and next-gen sequencing of the gRNAs. (B) Quantitative RT-PCR data for 4 genes (DEPDC5, TSC1, HPRT1, and SMC1A) in iNeurons transduced with 5 different gRNAs (NTC, DEPDC5, TSC1, HPRT1, and SMC1A). (C,D) FACS analysis for pS6-Alexa-647 immunostaining and side-scatter area in iNeurons with non-targeting gRNA (C) or DEPDC5 gRNA (D). (E) Table of gRNAs in test library comprised of negative regulators of mTOR signaling (green), positive regulators (red), and neutral gRNAs that should have no effect (black). (F) FACS analysis for iNeurons transduced with the test library. The left gate was collected as the pS6-low population (49.9% of total), and the right gate was collected as the pS6-high population (29.4% of total). (G) Log2 fold enrichment of the gRNA sequencing reads in the pS6-high sample vs. pS6-low sample. Dotted lines are mean and 2 SD for the NTC gRNAs. Color coding is the same as for the table in panel (E).
Figure 2.
Figure 2.
Whole genome gRNA library screening is enriched for known negative regulators of mTOR signaling, and candidate screen identifies gRNAs from novel genes with robust effect on pS6. (A) The average log-2 fold enrichment scores for the whole genome gRNA library. gRNAs with less than 5 total NGS reads combined between the pS6-high and pS6-low samples for all 3 independent experiments were excluded. Candidate gRNAs are labeled in green. (B) Top significant gene ontology terms from the gRNA rank order averaged from the 3 independent experiments. (C) Top significant gene ontology terms from the gene rank order averaged from the 5 gRNAs for each gene across the 3 independent experiments. (D) Plot of log2 fold enrichment in the pS6-high population for the candidate library (129 gRNAs) comparing 2 independent experiments (Screen 1 on x-axis, Screen 2 on y-axis). Green depicts known negative regulators of mTOR signaling, and red depicts known positive regulators of mTOR signaling. (E) Average log2 fold enrichment for the candidate library screen across 3 independent experiments is plotted against rank order in the x-axis.
Figure 3.
Figure 3.
Six candidate genes validated for CRISPRi knockdown and elevated pS6, and the finding of altered upstream AKT/mTOR/S6 signaling in PIK3R3 and HIP1 knockdown cells. (A) In-cell western data for 20 gRNAs with n = 4 except for PTEN where n – 3 due to one well peeling/lifting. (B) Representative immunoblots for targeted proteins EIF3A, URI1, PIK3R3, and HIP1 from iNeuron lysates after various gRNA transductions (listed at top of blots). (C) Quantification of EIF3A protein level from 4 independent experiments. The gRNAs used are indicated in the legend. Normalized to beta-III-tubulin. No virus and NTC were combined as “controls.” (D) Quantification of URI1, HIP1, and PIK3R3 protein level from 4 independent experiments. The gRNAs used are indicated in the color legend. (E) Phospho-specific mTOR pathway immunoblot images for iNeurons transduced with gRNAs targeting each gene listed at top. (F-J) Quantification of immunoblot data for 3 independent replicates. (F) The level of pS6(S235/S236) was normalized to the level of total S6 protein. (G) Level of pS6K1(T389) normalized to beta-III-tubulin. (H) Level of pAKT(S473) normalized to beta-III-tubulin. (I) Level of pERK(T202/Y204) normalized to beta-III-tubulin. (J) Level of pMTOR(S2448) normalized to beta-III-tubulin. Side-by-side bands with the same labels are biological replicates from independent transduction/differentiation replicates. Statistical analysis performed by one-way ANOVA with Dunnet’s multiple comparison test. Error bars are means with SD. * p < 0.05, ** p < 0.01, *** p < 0.001, **** p < 0.0001.
Figure 4.
Figure 4.
Validated candidate genes cause resistance to loss of glial-derived neurotrophic factor (GDNF) but not nutrient deprivation. (42) ICW for pS6 in iNeurons. Each dot indicates a single well. Each graph is from a single experiment that has been replicated with similar results (not shown). Statistical analysis performed by two-way ANOVA with Tukey’s multiple comparisons test or one-way ANOVA with Dunne’s multiple comparisons test. Error bars are means with SD. * p < 0.05, ** p < 0.01, *** p < 0.001, **** p < 0.0001. (A) iNeurons were transduced with either NTC or DEPDC5 gRNA and with or without BDNF and GDNF added to the culture media. (B) iNeurons were transduced with either NTC or LRRC4 gRNA and cultured in the presence or absence of BDNF and GDNF. (C) iNeurons were treated with BDNF, GDNF, NT3 or FGF2, and only GDNF increased pS6. (D) iNeurons were transduced with the gRNAs labeled on the x-axis and were cultured with (green) or without (black) GDNF. Comparisons in the top row indicate statistical significance for vehicle vs. GDNF conditions for each gRNA, while individual asterisks below indicate significance from the vehicle-treated NTC. (E) Representative immunoblotting for phosphorylated proteins associated with increased mTOR pathway signaling in iNeurons transduced with gRNAs targeting each gene listed at the top, and cultured in the presence (+) or absence (−) of BDNF and GDNF. (F-I) Quantification of immunoblot data for 2 independent replicates. (F) The level of pS6(S235/S236) was normalized to the level of total S6 protein. (G) Level of pS6K1(T389) normalized to beta-III-tubulin. (H) Level of pAKT(S473) normalized to beta-III-tubulin. (I) Level of pERK(T202/Y204) normalized to beta-III-tubulin. (J) Pearson’s correlation matrix for candidate screen experimental data for the 4 experiments without growth factors and the one experiment with growth factors but with nutrient deprivation. (K) The same plot as in (J) but limited to data from validated candidate genes, known FCD genes, and controls. (L) The log2 fold enrichment in the pS6 high population by gRNA with either growth factor or nutrient withdrawal. Statistical analysis performed with multiple Wilcoxon tests (paired non-parametric). Error bars are means with SD. * p < 0.05, ** p < 0.01, *** p < 0.001, **** p < 0.0001.

References

    1. Engel J., Pedley T. A., Aicardi J., Epilepsy: a comprehensive textbook (Lippincott Williams & Wilkins, 2008), vol. 3.
    1. Bast T., Ramantani G., Seitz A., Rating D., Focal cortical dysplasia: prevalence, clinical presentation and epilepsy in children and adults. Acta Neurologica Scandinavica 113, 72–81 (2006). - PubMed
    1. D’Gama A. M. et al. , Somatic mutations activating the mTOR pathway in dorsal telencephalic progenitors cause a continuum of cortical dysplasias. Cell reports 21, 3754–3766 (2017). - PMC - PubMed
    1. Møller R. S. et al. , Germline and somatic mutations in the MTOR gene in focal cortical dysplasia and epilepsy. Neurology Genetics 2, e118 (2016). - PMC - PubMed
    1. Baldassari S. et al. , Dissecting the genetic basis of focal cortical dysplasia: a large cohort study. Acta neuropathologica 138, 885–900 (2019). - PMC - PubMed

Publication types