[Preprint]. 2023 Dec 12:2023.12.12.570420.
doi: 10.1101/2023.12.12.570420.

miRNA-mediated control of gephyrin synthesis drives sustained inhibitory synaptic plasticity

Affiliations

miRNA-mediated control of gephyrin synthesis drives sustained inhibitory synaptic plasticity

Theresa M Welle et al. bioRxiv. .

Update in

Abstract

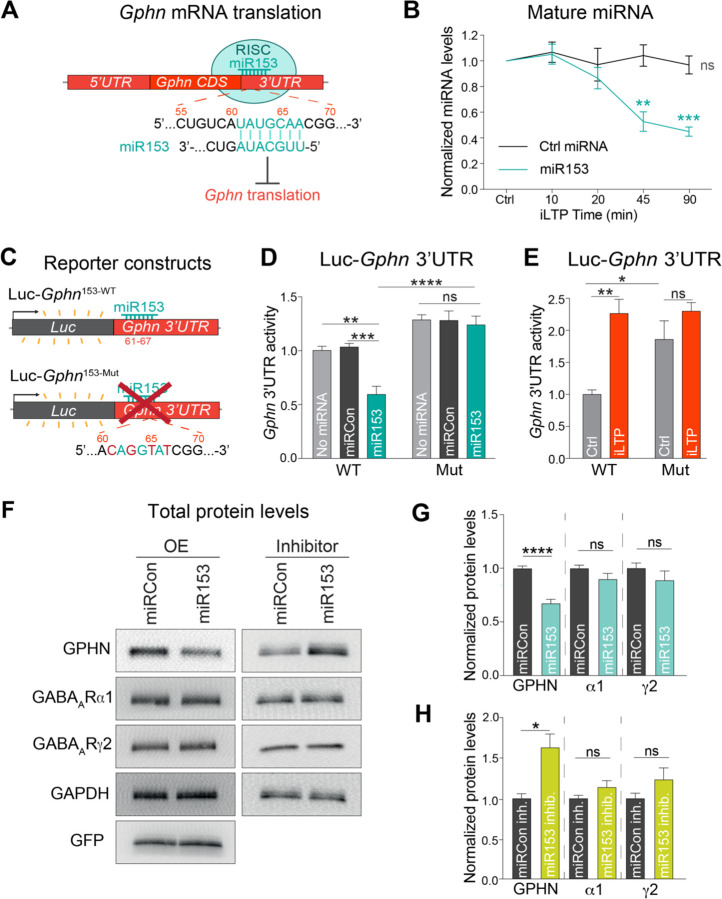
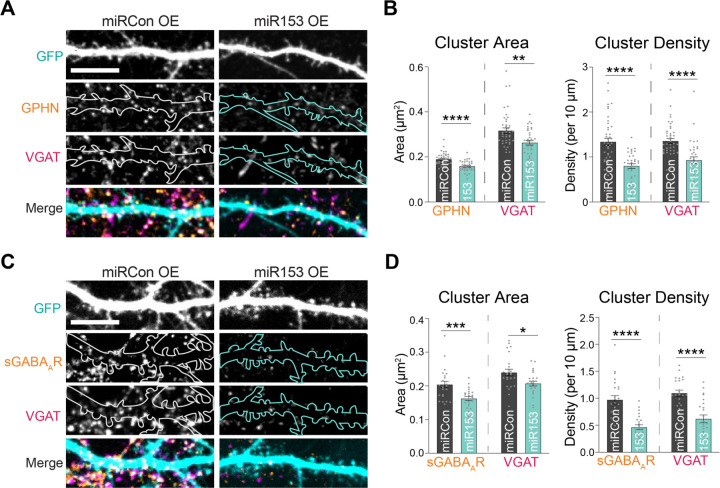
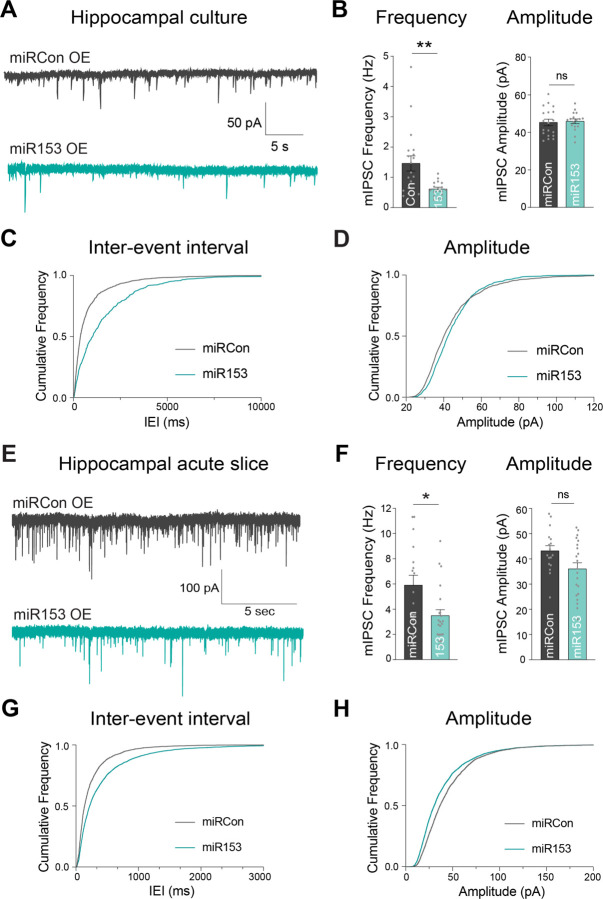
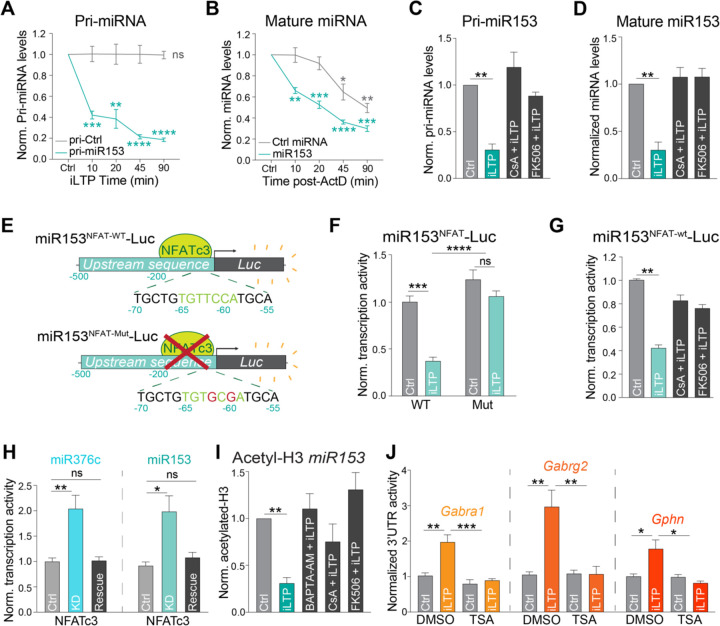
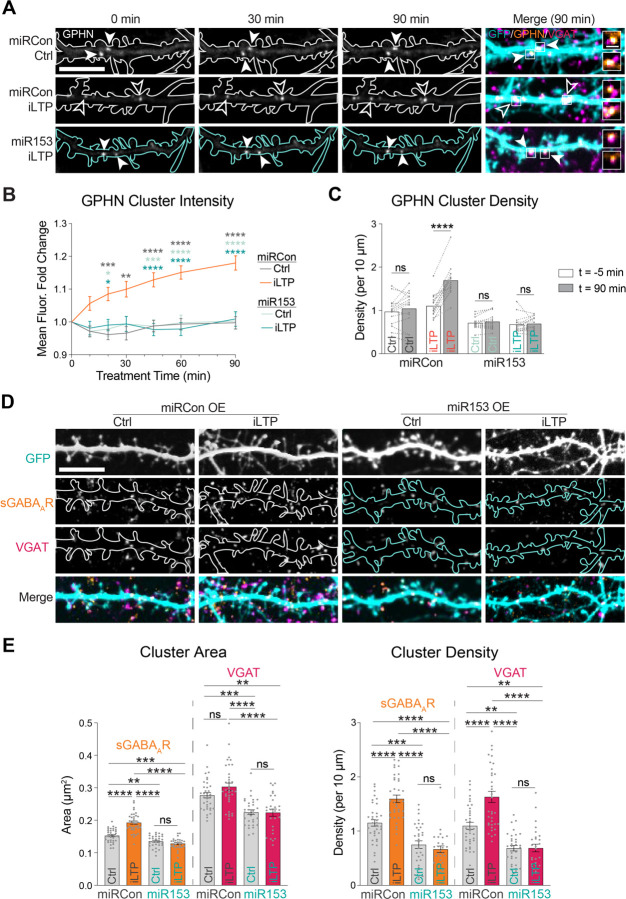
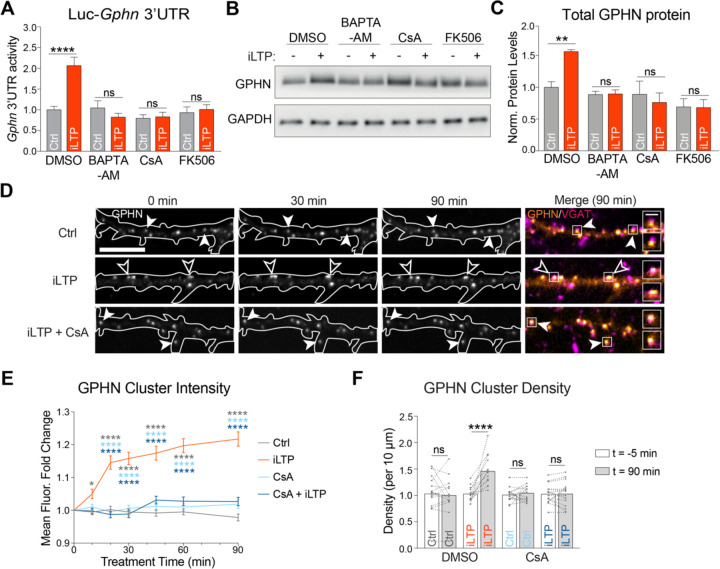
Activity-dependent protein synthesis is crucial for many long-lasting forms of synaptic plasticity. However, our understanding of the translational mechanisms controlling inhibitory synapses is limited. One distinct form of inhibitory long-term potentiation (iLTP) enhances postsynaptic clusters of GABAARs and the primary inhibitory scaffold, gephyrin, to promote sustained synaptic strengthening. While we previously found that persistent iLTP requires mRNA translation, the precise mechanisms controlling gephyrin translation during this process remain unknown. Here, we identify miR153 as a novel regulator of Gphn mRNA translation which controls gephyrin protein levels and synaptic clustering, ultimately impacting GABAergic synaptic structure and function. We find that iLTP induction downregulates miR153, reversing its translational suppression of Gphn mRNA and allowing for increased de novo gephyrin protein synthesis and synaptic clustering during iLTP. Finally, we find that reduced miR153 expression during iLTP is driven by an excitation-transcription coupling pathway involving calcineurin, NFAT and HDACs, which also controls the miRNA-dependent upregulation of GABAARs. Overall, this work delineates a miRNA-dependent post-transcriptional mechanism that controls the expression of the key synaptic scaffold, gephyrin, and may converge with parallel miRNA pathways to coordinate gene upregulation to maintain inhibitory synaptic plasticity.


Figures

Figure 1.
Figure 1.. miR153 is downregulated during iLTP and controls endogenous gephyrin expression
(A) Schematic of RNA-Induced Silencing Complex (RISC) and miR153 interaction with the seed site in Gphn 3’UTR, which is predicted to suppress translation of this mRNA. (B) qRT-PCR of miR153 and miR15a (Ctrl miRNA) expression in cultured hippocampal neurons harvested at different time-points following iLTP stimulation. miRNA levels were normalized to U6. n = 4. (C) Schematic of the Luc-Gphn luciferase reporters. miR153 seed site is mutated in Luc-Gphn153-Mut. (D) Quantification of Luc-Gphn activities in HEK293T cells co-expressing control miRNA (miRCon), miR153, or no miRNA. Firefly was normalized to Renilla, and the data quantified as relative change in normalized Luc activity. n = 5. (E) Quantification of Luc-Gphn activities in hippocampal neurons under control conditions (Ctrl) or 90 min post-iLTP stimulation. n = 5. (F) Western blots of gephyrin (GPHN), GABAAR subunits α1 and γ2, GAPDH, and GFP protein levels in neurons overexpressing miRCon or miR153 (left), and miRCon inhibitor or miR153 inhibitor (right). miRNA overexpression (OE) constructs contain a GFP reporter. (G) Quantification of GPHN, α1, and γ2 levels in miRCon or miR153 OE neurons. Protein levels were normalized to GAPDH, and the data quantified as relative change in normalized protein expression. n = 5. (H) Quantification of GPHN, α1, and γ2 in neurons expressing miRCon or miR153 inhibitors. n = 4. All values represent mean ± SEM. *p<0.05 and **p<0.01, ***p<0.005, ****p<0.0001; one-sample t-test (B), two-way ANOVA with Tukey’s multiple comparisons post-hoc test (D,E), and Mann-Whitney test (G,H).
Figure 2.
Figure 2.. miR153 overexpression disrupts gephyrin and GABAAR synaptic clustering
(A) Representative dendritic segments of miRCon or miR153 OE-expressing neurons labeled with antibodies to gephyrin (GPHN) and VGAT. Scale bar, 10 μm. (B) Quantification of GPHN and VGAT cluster area (left) and cluster density (right) in neurons from (A). n = 35–42 neurons per condition. (C) Representative dendritic segments of miRCon or miR153 OE-expressing neurons labeled with antibodies to surface GABAAR subunit γ2 (sGABAAR) and VGAT. Scale bar, 10 μm. (D) Quantification of sGABAAR and VGAT cluster area (left) and cluster density (right) in neurons from (C). n = 24 neurons per condition. All values represent mean ± SEM. *p<0.05 and **p<0.01, ***p<0.005, ****p<0.0001; Mann-Whitney test.
Figure 3.
Figure 3.. miR153 overexpression impacts GABAergic synaptic transmission
(A) Representative mIPSC current traces from miRCon and miR153 OE-expressing neurons in hippocampal culture. (B) Quantification of mIPSC frequency (left) and amplitude (right) from miRCon and miR153 OE-expressing neurons. n = 17–19 neurons per condition. (C) Cumulative frequency distribution of mIPSC inter-event intervals (IEI) for events in miRCon and miR153 OE-expressing neurons. (D) Cumulative frequency distribution of mIPSC amplitude for events in miRCon and miR153 OE-expressing neurons. (E) Representative traces recorded from miRCon and miR153 OE-expressing neurons in acute hippocampal slices. (F) Quantification of mIPSC frequency (left) and amplitude (right) from miRCon and miR153 OE-expressing neurons. n = 17–22 neurons per condition. (G) Cumulative frequency distribution of mIPSC IEI for events in miRCon and miR153 OE-expressing neurons. (H) Cumulative frequency distribution of mIPSC amplitude for events in miRCon and miR153 OE-expressing neurons. All values represent mean ± SEM. *p<0.05 and **p<0.01, ***p<0.005, ****p<0.0001; Mann-Whitney test.
Figure 4.
Figure 4.. miR153 and miR376c transcriptional repression are controlled by a common CaN-NFAT signaling pathway during iLTP
(A) qRT-PCR of primary miR153 transcript (pri-miR153) and pri-miR410 (pri-Ctrl) expression in neurons harvested at increasing time-points following iLTP stimulation. pri-miRNA levels were normalized to U6 and quantified as fold change from Ctrl condition. n = 4. (B) qRT-PCR of mature miR153 and miR410 (Ctrl miRNA) expression in neurons harvested at increasing time-points following treatment with actinomycin-D (ActD). miRNA levels normalized to U6 and quantified as fold change from Ctrl condition. n = 4. (C) qRT-PCR of pri-miR153 expression in hippocampal neurons following control treatment (Ctrl) or 90 min post-iLTP stimulation in the presence or absence of CaN inhibitors cyclosporin A (CsA) and FK506. Quantified as fold change in pri-miR153 levels from Ctrl condition. n=4 (D) qRT-PCR of mature miR153 expression in Ctrl and iLTP-90 neurons in the presence or absence of CsA and FK506. Quantified as miR153 fold change from Ctrl condition. n=5 (E) Schematic of the miR153-Luc luciferase reporters. Predicted NFAT binding site is mutated in miR153NFAT-Mut-Luc. (F) Quantification of miR153-Luc activities in neurons under control conditions (Ctrl) or 90 min post-iLTP stimulation. Firefly was normalized to Renilla, and the data quantified as relative change in normalized Luc activity with error-corrected control values. n = 4. (G) Quantification of miR153-Luc activities in Ctrl and iLTP-90 neurons in the presence or absence of CsA and FK506. n = 4. (H) Quantification of miR376c-Luc and miR153-Luc activities in Ctrl, NFATc3 knockdown (KD) and NFATc3 KD + rescue (Rescue) neurons. n = 7. (I) qPCR readout of acetyl-histone H3 chromatin immunoprecipitation (ChIP) from neurons to show acetylation status of the miR153 promoter in Ctrl and iLTP-90 conditions in the presence or absence BAPTA-AM, CsA, and FK506. n = 4. (J) Quantification of miR153-Luc activities in Ctrl and iLTP-90 neurons in the presence or absence of CsA and FK506. Quantified as fold change in miR153-Luc activity from Ctrl condition. n = 4. (K) Quantification of Luc-Gabra1, Luc-Gabrg2, and Luc-Gphn activities in Ctrl and iLTP-90 neurons in the presence or absence of HDAC inhibitor trichostatin-A (TSA). n = 4. All values represent mean ± SEM. *p<0.05 and **p<0.01, ***p<0.005, ****p<0.0001; one-sample t-test (A-D,I), two-way ANOVA with Tukey’s multiple comparisons post-hoc test (F,J), and Kruskal-Wallis with Dunn’s multiple comparisons post-hoc test (G,H).
Figure 5.
Figure 5.. miR153 overexpression prevents increased GABAergic synaptic clustering during iLTP
(A) Representative dendritic segments of miRCon or miR153 OE-expressing neurons over time in control and iLTP conditions. Neurons co-expressed the gephyrin intrabody (GPHN IB, arrowheads) and labeled live with VGAT Oyster650. Puncta are labeled with filled arrowheads when the fluorescence is unchanged and open arrowheads when fluorescence increases over time. Boxes indicate the fluorescent puncta enlarged in the merged images (dendrite scale bar, 10 μm; synapse scale bar, 2 μm). (B) Quantification of fold change in GPHN puncta fluorescence intensity over time following treatment in neurons from (A). n = 15 neurons per condition, 10 puncta per neuron. (C) Paired measurements of GPHN cluster density in dendrites prior to (−5 min) and 90 min following treatment. n = 15 neurons per condition. (D) Representative dendritic segments of miRCon or miR153 OE-expressing neurons labeled with antibodies to surface GABAAR γ2 subunit (sGABAAR) and VGAT following control treatment or 90 min post-iLTP stimulation. Scale bar, 10 μm (E) Quantification of sGABAAR and VGAT cluster area (left) and density (right) in neurons from (D). n = 27–36 neurons per condition. All values represent mean ± SEM. *p<0.05 and **p<0.01, ***p<0.005, ****p<0.0001; RM two-way ANOVA with Geisser-Greenhouse correction (B) and Šidák’s multiple comparisons post-hoc test (B,C) and ordinary two-way ANOVA with Tukey’s multiple comparisons post-hoc test (E).
Figure 6.
Figure 6.. Calcium and calcineurin signaling are required for increased gephyrin translation and synaptic clustering during iLTP
(A) Graph of Luc-Gphn activities in Ctrl or iLTP-90 neurons in the presence or absence of BAPTA, CsA, and FK506. Firefly was normalized to Renilla, and the data quantified as relative change in normalized Luc activity. n = 5. (B) Western blots of GPHN and GAPDH protein levels in Ctrl and iLTP-90 neurons in the presence or absence of BAPTA, CsA, and FK506. (C) Quantification of GPHN from western blots in (B). Protein levels were normalized to GAPDH, and the data quantified as relative change in normalized protein expression. n = 6. (D) Representative dendritic segments of neurons expressing GPHN IB and labeled with an antibody to VGAT, imaged over time in control and iLTP conditions in the presence or absence of CsA. Puncta are labeled with filled arrowheads when the fluorescence is unchanged and open arrowheads when fluorescence increases over time. Boxes indicate the fluorescent puncta enlarged in the merged images (dendrite scale bar, 10 μm; synapse scale bar, 2 μm). (E) Quantification of fold change in GPHN puncta fluorescence intensity in neurons over time following treatment, as shown in (D). n = 15 neurons per condition, 10 puncta per neuron. (F) Paired measurements of GPHN cluster density in dendrites prior to (−5 min) and 90 min following treatment. n = 15 neurons per condition. All values represent mean ± SEM. *p<0.05 and **p<0.01, ***p<0.005, ****p<0.0001; ordinary (A,C) or RM (E,F) two-way ANOVA with Geisser-Greenhouse correction (E) and Šidák’s multiple comparisons post-hoc test.

Similar articles

References

    1. Takeuchi T, Duszkiewicz AJ, Morris RG. The synaptic plasticity and memory hypothesis: encoding, storage and persistence. Philos Trans R Soc Lond B Biol Sci. 2013. Dec 2;369(1633):20130288. doi: 10.1098/rstb.2013.0288. PMID: 24298167; PMCID: PMC3843897. - DOI - PMC - PubMed
    1. Akhondzadeh S. Hippocampal synaptic plasticity and cognition. J Clin Pharm Ther. 1999. Aug;24(4):241–8. doi: 10.1046/j.1365-2710.1999.00231.x. PMID: 10475982. - DOI - PubMed
    1. Martin KC, Casadio A, Zhu H, Yaping E, Rose JC, Chen M, Bailey CH, Kandel ER. Synapse-specific, long-term facilitation of aplysia sensory to motor synapses: a function for local protein synthesis in memory storage. Cell. 1997. Dec 26;91(7):927–38. doi: 10.1016/s0092-8674(00)80484-5. PMID: 9428516. - DOI - PubMed
    1. Sidrauski C, Acosta-Alvear D, Khoutorsky A, et al. Pharmacological brake-release of mRNA translation enhances cognitive memory. Elife. 2013. May;2:e00498. DOI: 10.7554/elife.00498. PMID: 23741617; PMCID: PMC3667625. - DOI - PMC - PubMed
    1. Gal-Ben-Ari S, Kenney JW, Ounalla-Saad H, Taha E, David O, Levitan D, Gildish I, Panja D, Pai B, Wibrand K, Simpson TI, Proud CG, Bramham CR, Armstrong JD, Rosenblum K. Consolidation and translation regulation. Learn Mem. 2012. Aug 16;19(9):410–22. doi: 10.1101/lm.026849.112. PMID: 22904372; PMCID: PMC3418764. - DOI - PMC - PubMed

Publication types