[Preprint]. 2024 Jun 14:2023.12.15.571925.
doi: 10.1101/2023.12.15.571925.

Predicting the First Steps of Evolution in Randomly Assembled Communities

Affiliations

Predicting the First Steps of Evolution in Randomly Assembled Communities

John McEnany et al. bioRxiv. .

Update in

Abstract

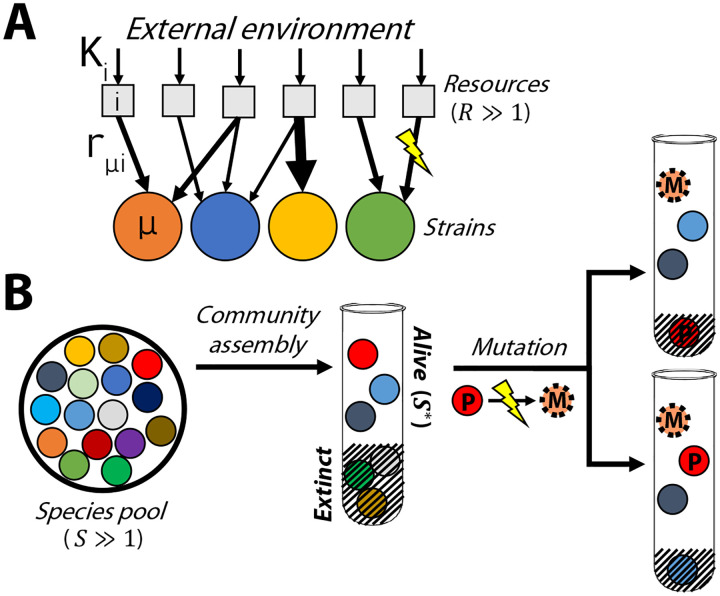
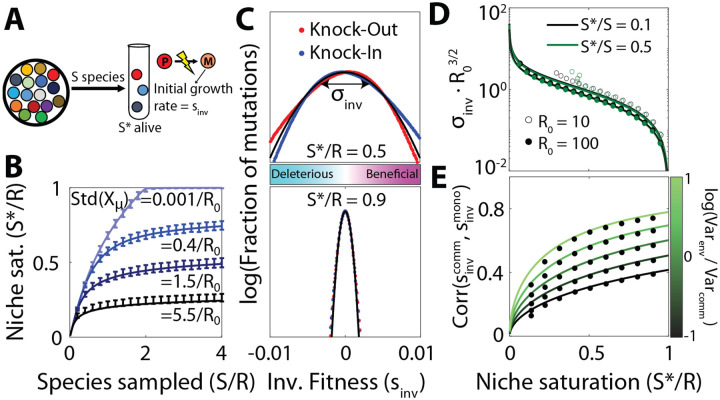
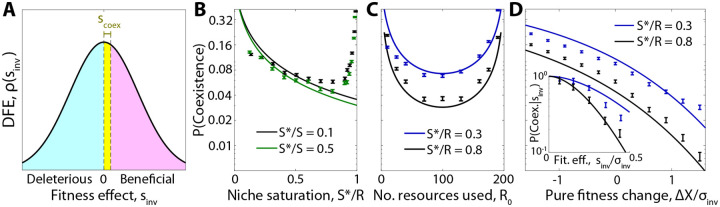
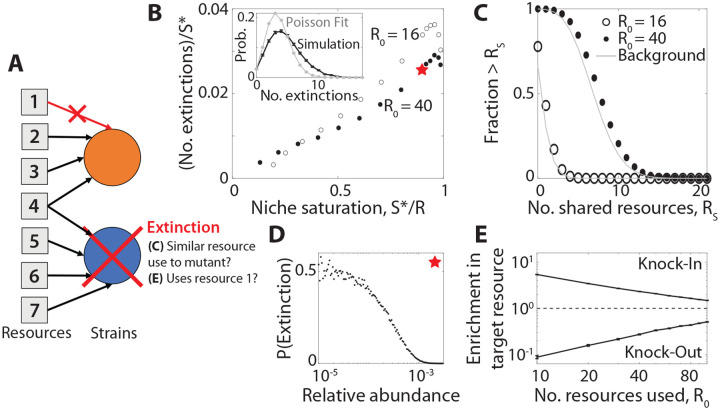
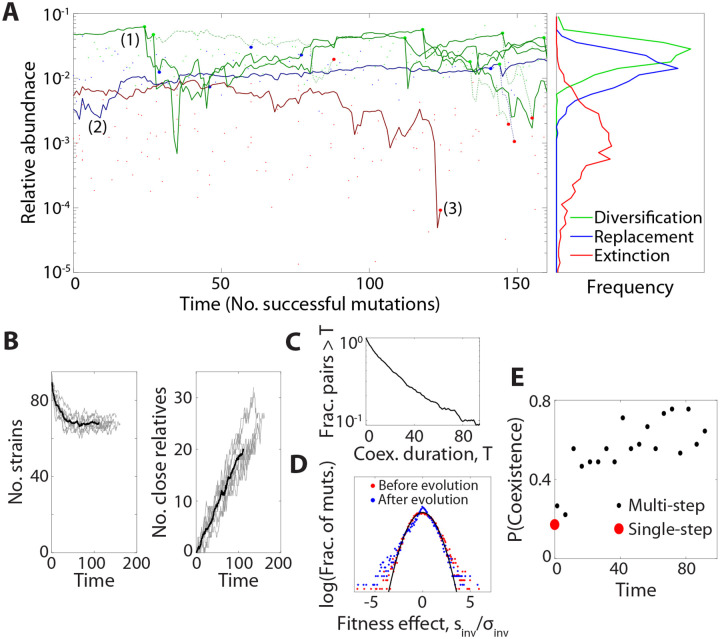
Microbial communities can self-assemble into highly diverse states with predictable statistical properties. However, these initial states can be disrupted by rapid evolution of the resident strains. When a new mutation arises, it competes for resources with its parent strain and with the other species in the community. This interplay between ecology and evolution is difficult to capture with existing community assembly theory. Here, we introduce a mathematical framework for predicting the first steps of evolution in large randomly assembled communities that compete for substitutable resources. We show how the fitness effects of new mutations and the probability that they coexist with their parent depends on the size of the community, the saturation of its niches, and the metabolic overlap between its members. We find that successful mutations are often able to coexist with their parent strains, even in saturated communities with low niche availability. At the same time, these invading mutants often cause extinctions of metabolically distant species. Our results suggest that even small amounts of evolution can produce distinct genetic signatures in natural microbial communities.


Conflict of interest statement

Competing interests: None declared.

Figures

Figure 1:
Figure 1:. Modeling the first steps of evolution in a randomly assembled community that competes for substitutable resources.
(A) Microbial strains compete for resources that are continuously supplied by the environment at rates Ki. Each strain μ has a characteristic set of uptake rates rμ,i (arrows), which can be altered by further mutations. (B) A local pool of 𝒮 initial species, whose phenotypes are randomly drawn from a common statistical distribution, self-assembles into an ecological equilibrium with 𝒮*𝒮 surviving species (left). A new mutation (M) arises in one of the surviving species (P); if the mutation provides a fitness benefit, its descendants can either replace the parent strain (top right) or stably coexist with the parent, potentially driving another species to extinction (bottom right).
Figure 2:
Figure 2:. Distribution of fitness effects of first-step mutations as a function of community complexity.
(A) As in Fig. 1, a community is assembled from 𝒮 initial species, leaving 𝒮* alive at equilibrium. The surviving species produce mutations, whose invasion fitness sinv is equal to their initial relative growth rate. (B) Number of surviving species 𝒮* as a function of the sampling depth 𝒮 and the standard deviation of the total uptake budget among sampled species, StdXμ. Curves show theory predictions from SI Section 3.1, while points show means and standard deviations over 103 simulation runs with =200,0=40, and uniform resource supply. (C) Distribution of fitness effects of knock-out (and knock-in) mutations with ΔX=0 in communities with two different levels of niche saturation 𝒮*/). Black curve shows the theoretical predictions from Eq. (5), while dots represent a histogram over all possible strategy mutations in 103 simulation runs using the same parameters as panel B, with 𝒮*/𝒮=0.1. (D) The width σinv of the distribution of fitness effects in panel C as a function of niche saturation, for various values of sampling permissivity 𝒮*/𝒮 and per-species resource usage 0. Curves show the theoretical predictions from Eq. (5), while the dots show the average over 103 simulation runs. (E) Pearson correlation between the fitness effect of a mutation in the community and its fitness effect in monoculture, for different values of niche saturation and scaled variation in resource supply rates, Varenv/VarcommVar(K)/K20/1-0/. Curves show the theoretical predictions from SI Section 4.1, while points show the average over all mutations in 103 simulated communities with parameters the same as panel C.
Figure 3:
Figure 3:. Ecological diversification in large communities.
(A) Schematic showing the subset of mutations that are able to stably coexist with their parent strain. Coexistence occurs in the yellow region where the invasion fitness is below a critical threshold scoex, which depends on the abundance of the parent and the phenotypic effect size of the mutation. (B-D) Probability that a successful knock-out mutant coexists with its parent strain as a function of (B) the niche saturation 𝒮*/, (C) the typical number of resources used per species 0, and (D) the change in overall uptake budget of the mutant ΔX. Inset shows the dependence on the total invasion fitness sinv. In all panels, curves show the theory predictions from SI Sections 3.3 and 3.4, while points show means and standard errors over 104 simulation runs with base parameters =200,0=40,𝒮*/𝒮=0.1, and uniform resource supply.
Figure 4:
Figure 4:. Successful mutations drive extinctions of metabolically distant species.
(A) Schematic showing the extinction of an unrelated species (blue) after a beneficial knockout mutation (orange) invades. In this example, the displaced species and the mutant share one common resource, but not the one targeted by the knock-out mutation. (B) Average number of extinctions after the invasion of a successful mutant, as a function of niche saturation 𝒮*/; parent strains are excluded from the extinction tally. Inset: full distribution of extinctions for the starred parameters, compared to a Poisson distribution with the same fraction of zero counts. Points denote the averages over 104 simulation runs with the same base parameters as Fig. 3. (C) Distribution of the number of resources jointly utilized by the displaced species and the invading mutant (parent strains excluded). Points denote the results of simulations with 𝒮*/=0.9. Gray curves show the analogous background distribution between the mutant and all other species in the community, regardless of whether they become extinct. (D) Probability of extinction as a function of initial relative abundance for the starred point in panel B. (E) The fold change in probability that the displaced species uses the same resource targeted by the mutant (i.e., the resource being knocked in or out), relative to the background distribution of resource use in the population. Points denote means and standard errors for knock-in and knock-out mutations as a function of 0 for 𝒮*/=0.8, with the the remaining parameters the same as panel B.
Figure 5:
Figure 5:. Mutation and diversification over longer evolutionary timescales.
(A) Left: an example simulation showing the step-wise accumulation of ~100 adaptive knock-out mutations in a community with =100,0=20,𝒮*/=0.9,𝒮*/𝒮=0.1. Solid lines denote the abundance trajectories of 3 example lineages. Large points indicate extinction events in these lineages (red), diversification events (green), and mutation events that displace their parent strain (blue) in the highlighted lineages, while smaller points indicate analogous events for other species in the community. Dashed lines illustrate offshoots of the highlighted lineages that eventually went extinct. Right: Relative abundances of strains when they experienced mutation, diversification and extinction events, respectively. Lines denote histograms aggregated over 9 simulation runs. (B) Left: Total number of surviving strains over time. Grey lines denote replicate simulations for the same parameters in panel A, while their average is shown in black. Right: Total number of strains related to another surviving strain through one or more in situ diversification events. (C) The probability of mutant-parent coexistence being maintained (i.e., both lineages surviving) as a function of time since initial divergence, over ten simulations. (D) The distribution of fitness effects at the start of the simulation (red) and after 90 accumulated mutations (blue), compared to the first-step predictions from Fig. 2 (black). (E) The probability that a mutation event leads to stable diversification as a function of time. Black points denote binned values aggregated over nine replicate simulations, while red point denotes the analogous result for 104 first-step simulations.

Similar articles

References

    1. Huttenhower C, Gevers D, Knight R, Abubucker S, Badger JH, Chinwalla AT, et al. Structure, function and diversity of the healthy human microbiome. Nature. 2012;486(7402):207–214. doi:10.1038/nature11234. - DOI - PMC - PubMed
    1. Yang J, Pu J, Lu S, Bai X, Wu Y, Jin D, et al. Species-Level Analysis of Human Gut Microbiota With Metataxonomics. Frontiers in Microbiology. 2020;11. doi:10.3389/fmicb.2020.02029. - DOI - PMC - PubMed
    1. Bai Y, Müller DB, Srinivas G, Garrido-Oter R, Potthoff E, Rott M, et al. Functional overlap of the Arabidopsis leaf and root microbiota. Nature. 2015;528(7582):364–369. doi:10.1038/nature16192. - DOI - PubMed
    1. Sunagawa S, Coelho LP, Chaffron S, Kultima JR, Labadie K, Salazar G, et al. Structure and function of the global ocean microbiome. Science. 2015;348(6237). doi:10.1126/science.1261359. - DOI - PubMed
    1. Roodgar M, Good BH, Garud NR, Martis S, Avula M, Zhou W, et al. Longitudinal linked-read sequencing reveals ecological and evolutionary responses of a human gut microbiome during antibiotic treatment. Genome Res. 2021;31(8):1433–1446. - PMC - PubMed

Publication types