

This is a preprint.
Feature attention graph neural network for estimating brain age and identifying important neural connections in mouse models of genetic risk for Alzheimer's disease
- PMID: 38168445
- PMCID: PMC10760088
- DOI: 10.1101/2023.12.13.571574
Feature attention graph neural network for estimating brain age and identifying important neural connections in mouse models of genetic risk for Alzheimer's disease
Update in
-
Feature attention graph neural network for estimating brain age and identifying important neural connections in mouse models of genetic risk for Alzheimer's disease.Imaging Neurosci (Camb). 2024 Jul 31;2:imag-2-00245. doi: 10.1162/imag_a_00245. eCollection 2024. Imaging Neurosci (Camb). 2024. PMID: 40800544 Free PMC article.
Abstract
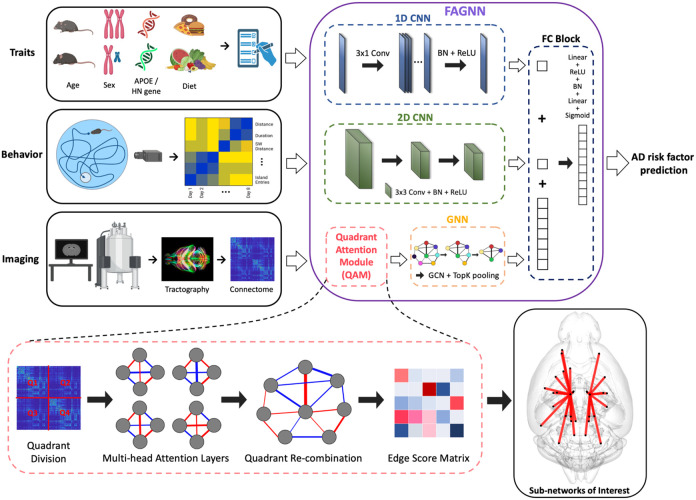
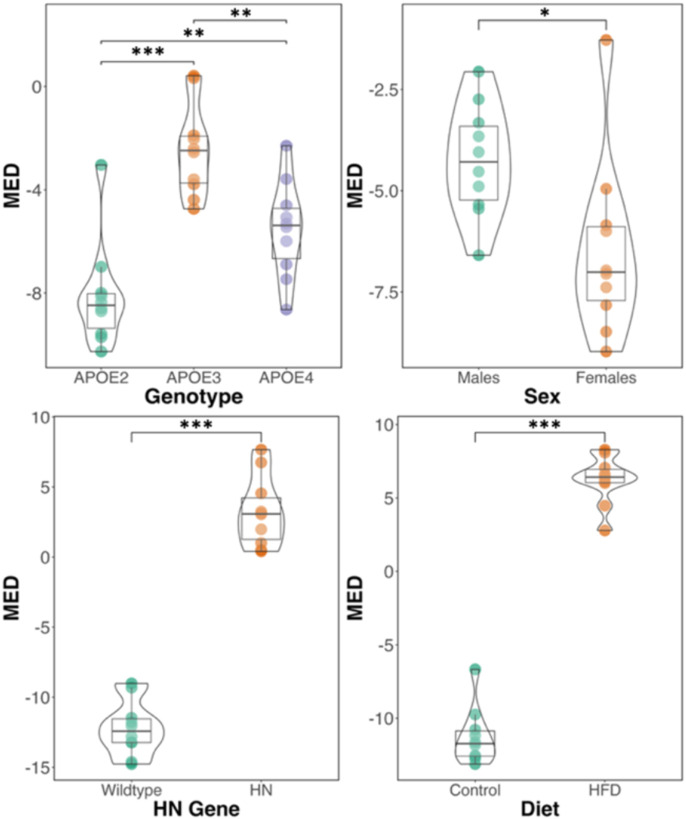
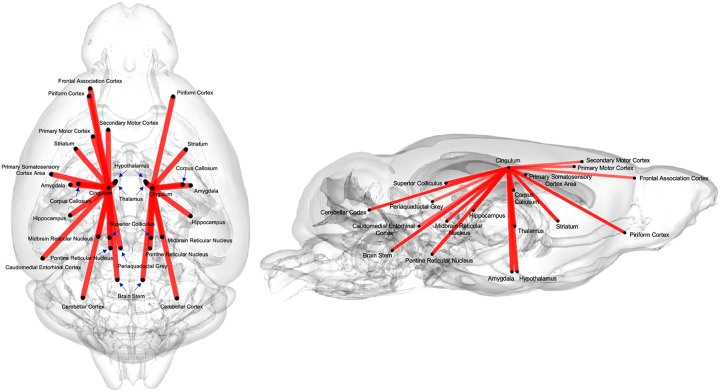
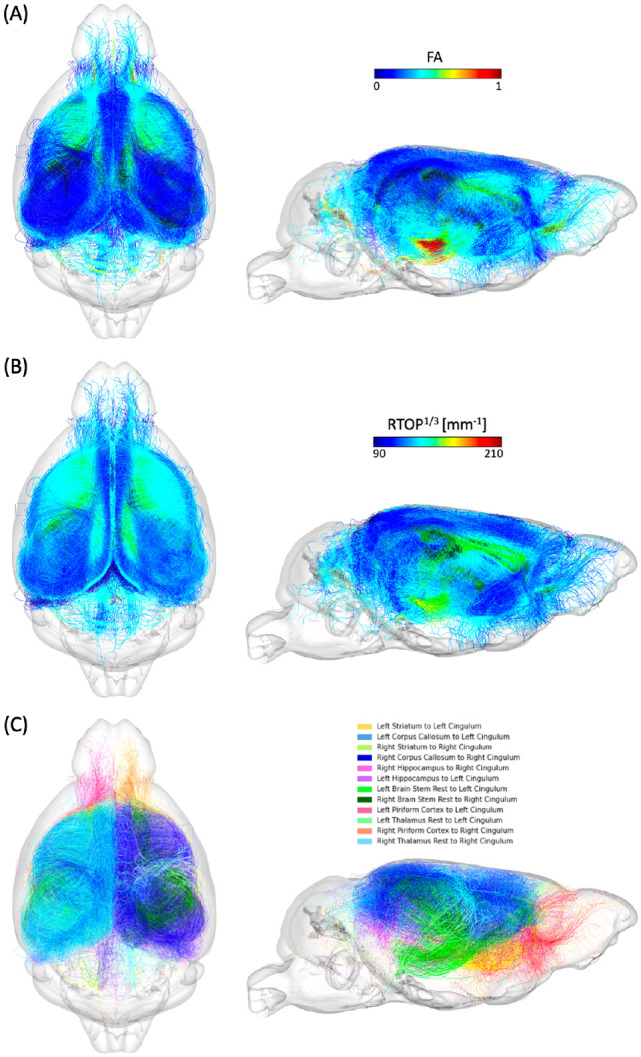
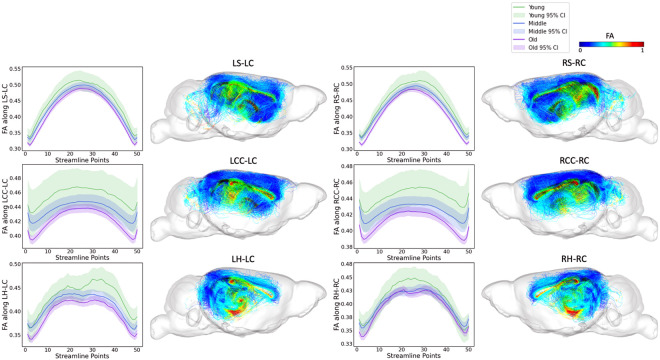
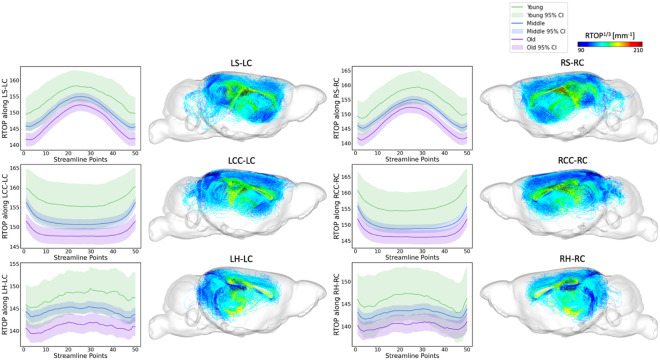
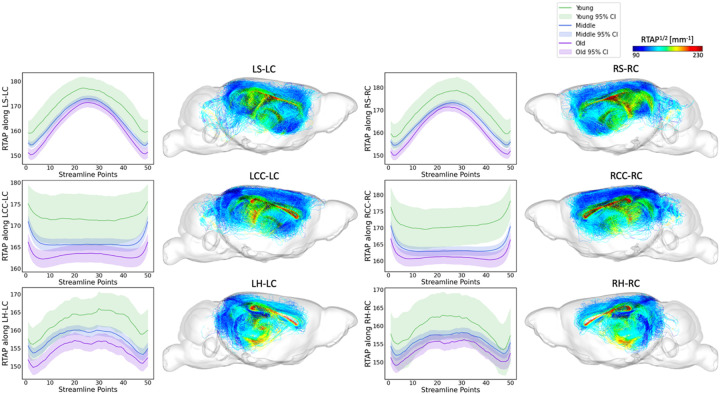
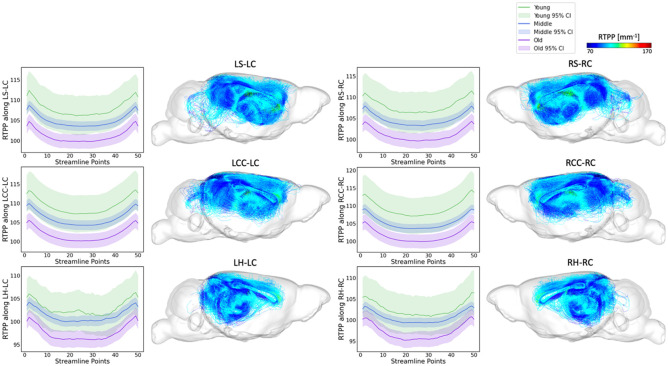
Alzheimer's disease (AD) remains one of the most extensively researched neurodegenerative disorders due to its widespread prevalence and complex risk factors. Age is a crucial risk factor for AD, which can be estimated by the disparity between physiological age and estimated brain age. To model AD risk more effectively, integrating biological, genetic, and cognitive markers is essential. Here, we utilized mouse models expressing the major APOE human alleles and human nitric oxide synthase 2 to replicate genetic risk for AD and a humanized innate immune response. We estimated brain age employing a multivariate dataset that includes brain connectomes, APOE genotype, subject traits such as age and sex, and behavioral data. Our methodology used Feature Attention Graph Neural Networks (FAGNN) for integrating different data types. Behavioral data were processed with a 2D Convolutional Neural Network (CNN), subject traits with a 1D CNN, brain connectomes through a Graph Neural Network using quadrant attention module. The model yielded a mean absolute error for age prediction of 31.85 days, with a root mean squared error of 41.84 days, outperforming other, reduced models. In addition, FAGNN identified key brain connections involved in the aging process. The highest weights were assigned to the connections between cingulum and corpus callosum, striatum, hippocampus, thalamus, hypothalamus, cerebellum, and piriform cortex. Our study demonstrates the feasibility of predicting brain age in models of aging and genetic risk for AD. To verify the validity of our findings, we compared Fractional Anisotropy (FA) along the tracts of regions with the highest connectivity, the Return-to-Origin Probability (RTOP), Return-to-Plane Probability (RTPP), and Return-to-Axis Probability (RTAP), which showed significant differences between young, middle-aged, and old age groups. Younger mice exhibited higher FA, RTOP, RTAP, and RTPP compared to older groups in the selected connections, suggesting that degradation of white matter tracts plays a critical role in aging and for FAGNN's selections. Our analysis suggests a potential neuroprotective role of APOE2, relative to APOE3 and APOE4, where APOE2 appears to mitigate age-related changes. Our findings highlighted a complex interplay of genetics and brain aging in the context of AD risk modeling.
Keywords: APOE; Alzheimer’s disease; aging; brain connectomics; diffusion MRI; graph neural network.
Conflict of interest statement
Declaration of Competing Interests The authors declare that they have no financial or non-financial interests that could be construed as a potential conflict of interest.
Figures
References
-
- Anatürk M., Kaufmann T., Cole J. H., Suri S., Griffanti L., Zsoldos E., Filippini N., Singh-Manoux A., Kivimäki M., Westlye L. T., Ebmeier K. P., & de Lange A. M. G. (2021). Prediction of brain age and cognitive age: Quantifying brain and cognitive maintenance in aging. Human Brain Mapping, 42(6). 10.1002/hbm.25316 - DOI - PMC - PubMed
-
- Anderson R. J., Cook J. J., Delpratt N., Nouls J. C., Gu B., McNamara J. O., Avants B. B., Johnson G. A., & Badea A. (2019). Small Animal Multivariate Brain Analysis (SAMBA) – a High Throughput Pipeline with a Validation Framework. Neuroinformatics, 17(3), 451–472. 10.1007/S12021-018-9410-0/FIGURES/9 - DOI - PMC - PubMed
-
- Anderson R. J., Wang N., Cook J. J., Cofer G. P., Dibb R., Johnson G. A., & Badea A. (2018). A high performance computing cluster implementation of compressed sensing reconstruction for MR histology. ISMRM, Paris, France.
Publication types
Grants and funding
LinkOut - more resources
Full Text Sources
Miscellaneous