

This is a preprint.
It has not yet been peer reviewed by a journal.
The National Library of Medicine is
running a pilot
to include preprints that result from research funded by NIH in PMC and PubMed.
[Preprint]. 2025 Feb 4:2023.12.13.571314.
doi: 10.1101/2023.12.13.571314.
Stable Cortical Body Maps Before and After Arm Amputation
Affiliations
- PMID: 38168448
- PMCID: PMC10760201
- DOI: 10.1101/2023.12.13.571314
Item in Clipboard
Stable Cortical Body Maps Before and After Arm Amputation
bioRxiv.
.
Update in
-
Stable cortical body maps before and after arm amputation.Nat Neurosci. 2025 Oct;28(10):2015-2021. doi: 10.1038/s41593-025-02037-7. Epub 2025 Aug 21. Nat Neurosci. 2025. PMID: 40841477 Free PMC article.
Abstract
The adult brain's capacity for cortical reorganization remains debated. Using longitudinal neuroimaging in three adults, followed up to five years before and after arm amputation, we compared cortical activity elicited by movement of the hand (pre-amputation) versus phantom hand (post-amputation) and lips (pre/post-amputation). We observed stable representations of both hand and lips. By directly quantifying activity changes across amputation, we overturn decades of animal and human research, demonstrating amputation does not trigger large-scale cortical reorganization.
Figures

(A) Experimental timeline. Pre- and post-amputation scans were conducted across 4–5 time points: twice before, and at 3 months, 6 months and 1.5 (P1) / 5 years (P2) after amputation. (B) Illustration depicting the 3 participants 6m post-amputation, including their subjective description of their phantom limb position. (C) Phantom movements are not imaginary. Univariate activity (z-scored) contrast map displaying participant’s attempts to open and close the phantom hand vs. imagining movement, 6 months post-amputation. (D) Participant’s hand (red) and lip (blue) cortical activation maps (contrasted against feet movements) within the affected hand hemisphere across 4–5 sessions. All maps were minimally thresholded at 33% the maximum z-statistic and used a common color scale (participant’s maximum Z-statistic > 4.5).
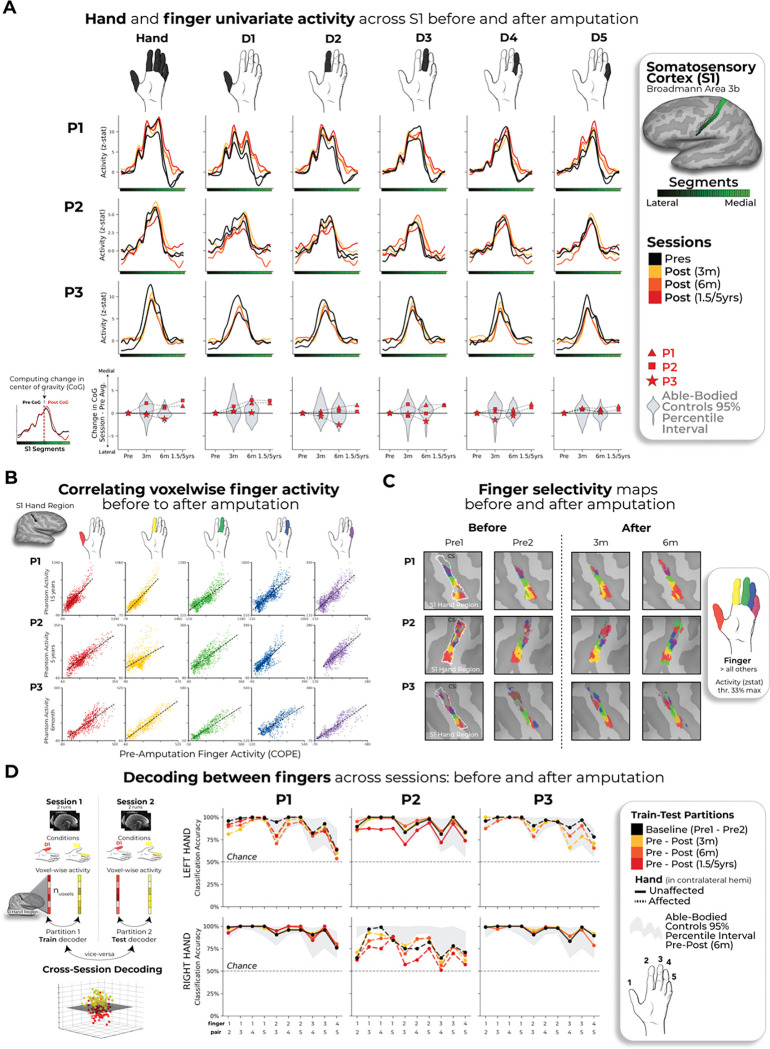
(A) Longitudinal hand and individual finger activity (versus rest) projected across the S1 (BA3b) region of interest (ROI) segmented into 49 segments of similar height. Affected hand’s activity over 5 sessions (indicated in the legend) for each of the case-study participants that underwent an amputation; bottom row shows finger CoG shifts before and after amputation. Black lines reflect pre-amputation activity, orange/red lines post-amputation. Case-study participants’ CoG shifts (red) for the hand and individual fingers fell within the distribution of controls (grey; 12–18 comparisons per participant; Crawford t-tests: P1 (6m): 0.14≤ puncorr≤ 0.58; P2 (6m): 0.06≤puncorr≤0.81; P3 (6m): 0.10≤puncorr≤0.91). Values indicate group means ± standard error. Positive values indicate medial shifts (toward feet), negative values lateral (toward lips) in S1. Control data shown as gray violin plots. P1 data shown as a red triangle. P2 data shown as a red square. P3 data shown as a red star. For simplicity, the control values are all for the left (non-dominant) hand. (B) Pre-post amputation single-finger multi-voxel correlation: For each finger of the case-study participants, voxel-wise activity correlations before and at the final scan after amputation are shown. All other correlations are comprehensively reported in Supp Figure 5. All participant’s pre-to-post correlations were significant (5 Pearson correlations per participant; P1 (6m): 0.68≤ r≤ .90, puncorr<0.001; P2 (6m): 0.80≤r≤.85, puncorr<0.001; P3 (6m): 0.88≤r≤.91, puncorr<0.001). (C) Finger selectivity maps before and after amputation. Each contrast map reflects the activity for each finger (versus all others), masked to the hand ROI. Each mask was minimally thresholded at 33% the maximum z-statistic. Color codes indicated on the right. To capture the multi-finger activity at a single voxel, a 70% opacity filter was applied to all fingers. (D) Left - Graphic illustration of multivoxel analyses using a linear SVM decoder. Right – Longitudinal classifier performance. Line colors denote train-test/cross validation session pairs, respectively as indicated in the legend. The gray shaded area reflects able-bodied control’s Pre – Post (6m) data (95% percentile interval). Training the classifier on the pre-amputation data and testing it on the post-amputation data (and vice versus) revealed significantly above chance classification accuracies for all case-study participants at all post-amputation sessions (one-sample t-test: P1: Pre/1.5y: 89%; p<0.001; P2: Pre/5y: 67%; p<0.001; P3: Pre/6m: 88%; p<0.001). All other annotations are depicted in Figure 1.
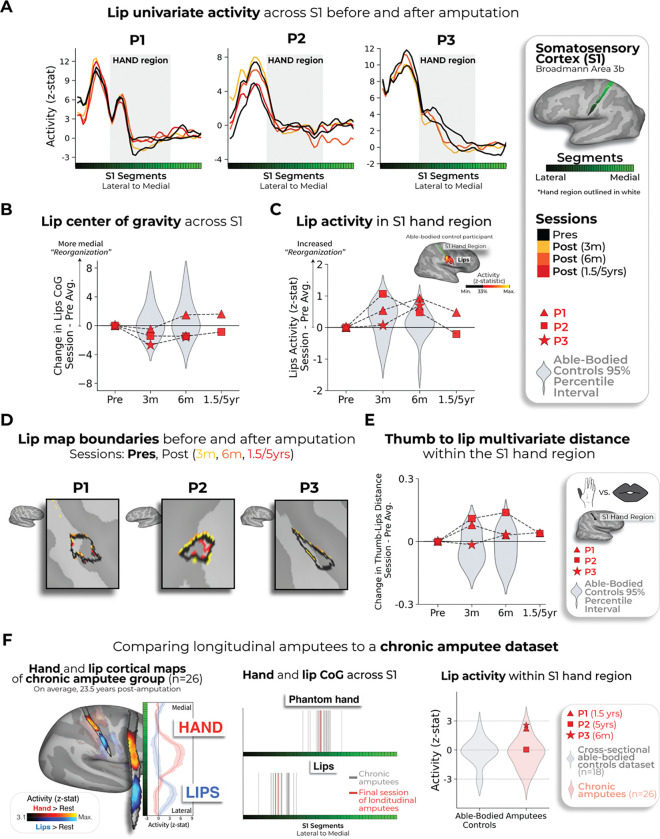
(A) Each case-study participant’s lip activity (versus rest) for their sessions projected across the S1 ROI. Black lines reflect pre-amputation activity, yellow (3m), orange (6m) and red (1.5/5y) lines post-amputation. Grey region depicts approximated coverage of the hand portion within S1. (B) All case-study participants showed typical longitudinal variability at their 6 months scan, relative to controls, for lip CoG. Positive values reflect medial shifts (towards the hand). (C) All case-study participants showed typical lip activity in the S1 hand region at the final scan. Right corner of panel depicts representative control participant’s activity for the hand and lips (versus feet; minimally thresholded at 33% the max. z-statistic). (D) All case-study participants exhibited no expansions of the lip map boundaries towards the hand region. Maps masked to the S1 ROI and minimally thresholded (Z > 4.5). (E) All case-study participants showed stable thumb-to-lip multivariate Mahalanobis distances cross-validated at their final scan, relative to controls. (F) Comparing the case-study participants to a chronic amputee dataset (n=26). Left – chronic amputee’s group-level cortical activation maps of the phantom hand and lips (versus rest) projected onto a single hemisphere (minimally thresholded at Z > 3.1). Opacity applied to activity outside the S1 ROI. Group univariate activity plotted as a line (group mean ± standard error) for the phantom hand (red) and lips (blue) across the S1 ROI. Middle – All case-study participants, comparable to chronic amputees, showed a typical center of gravity for both the phantom hand (top row) and lips (bottom row). Right – All case-study participants exhibited typical lip activity within the S1 hand region during their final session consistent with chronic amputees. The magnitude of lip activity (95% percentile interval) within the S1 hand region for a secondary able-bodied control group (n=18; shown in grey). Chronic amputees shown in pink and the case-study participants last session data shown in red. All other annotations are the same as described in Figure 2.
References
Publication types
Grants and funding
LinkOut - more resources
Full Text Sources