. 2024 Jan 2;14(1):151.
doi: 10.1038/s41598-023-49910-8.

Future changes in the precipitation regime over the Arabian Peninsula with special emphasis on UAE: insights from NEX-GDDP CMIP6 model simulations

Affiliations

Future changes in the precipitation regime over the Arabian Peninsula with special emphasis on UAE: insights from NEX-GDDP CMIP6 model simulations

K Koteswara Rao et al. Sci Rep. .

Abstract

Global warming can profoundly influence the mean climate over the Arabian Peninsula, which may significantly influence both natural and human systems. The present study aims to investigate the changes in the precipitation regime in response to climate change over the Arabian Peninsula, with special emphasis on the United Arab Emirates (UAE). This work is performed using a sub-set of high-resolution NASA Earth Exchange Global Daily Downscaled Projections (NEX-GDDP) data derived from Coupled Model Intercomparison Project Phase 6 (CMIP6) Global Climate Models under three different Shared Socioeconomic Pathway (SSP) scenarios (SSP1-2.6, SSP2-4.5, and SSP5-8.5). The changes are analyzed in three phases such as 2021-2050 (near future), 2051-2080 (mid future) and 2080-2100 (far future), with the period of 1985-2014 as the baseline. This study represents the first attempt to utilize data from NEX-GDDP models to project the regional patterns of precipitation regime across the Arabian Peninsula. Results suggest that the annual precipitation is expected to increase over most of the UAE by up to 30%, particularly intense from the mid-future onwards in all scenarios. Specifically, the spatiotemporal distribution of precipitation extremes such as intensity, 1-day highest precipitation, and precipitation exceeding 10 mm days are increasing; in contrast, the consecutive dry days may decrease towards the end of the century. The results show that the changes in extreme precipitation under a warming scenario relative to the historical period indicate progressive wetting across UAE, accompanied by increased heavy precipitation events and reduced dry spell events, particularly under the high emission scenarios. A high-resolution dataset is essential for a better understanding of changes in precipitation patterns, especially in regions where more detailed information is needed on a local scale to achieve water, food security, and environmental sustainability to formulate effective adaptation strategies for mitigating the potential risks and consequences associated with variations in wet and dry conditions.


Conflict of interest statement

The authors declare no competing interests.

Figures

Figure 1
Figure 1
The (a) mean climatological pattern (mm) and (b) linear trend in annual rainfall (mm/decade) based on 1979–2022. The stippling (dotted) regions represent the trend is statistically significant at 0.05 level.
Figure 2
Figure 2
Inter-annual variability of area averaged UAE annual total precipitation. The blue color depicts linear trend.
Figure 3
Figure 3
Inter-annual variability of SDII, RX1DAY, PD10 and CDD over UAE. The blue line indicates linear trend over 1979–2022.
Figure 4
Figure 4
Spatial distribution of annual mean precipitation over Arabian Peninsula during 1985–2014 (a) CPC (b) CMIP6 MMM and (c) BIAS. The stippling (dotted) regions represent the biases are statistically significant at 0.05 level.
Figure 5
Figure 5
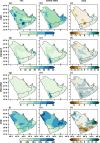
Spatial distribution of extreme precipitation indices over Arabian Peninsula CPC (1st column), CMIP6 MMM (2nd column), and BIAS (3rd column) during 1985–2014. The stippling (dotted) regions represent the statistically significant biases at 0.05 level.
Figure 6
Figure 6
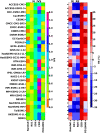
A portrait diagrams for Interannual variability Score (IVS) and Relative Error (RE) showing the performance of each single model for precipitation extreme indices area averaged over UAE during the period 1985–2014.
Figure 7
Figure 7
Future changes in annual total precipitation (%) from SSP1-2.6 (low emission), SSP2-4.5 (medium emission) and SSP5-8.5 (high mission) scenarios of CMIP6 during near, mid and far future with reference to the baseline 1985–2014. The stippling (dotted) regions represent the changes are statistically significant at 0.05 level.
Figure 8
Figure 8
Area averaged UAE mean monthly future precipitation change relative to baseline period (1985–2014). The average rainfall (mm/day; solid lines) and the associated uncertainty range (shading) for near (2021–2050), mid (2051–2080) and far (2081–2100) future under SSP1-2.6, SSP2-4.5 and SSP5-8.5 scenarios.
Figure 9
Figure 9
Time series of area averaged UAE annual total precipitation (%) anomalies (relative to 1985–2014) from CMIP6 models. The solid thick lines represent MMM and the shaded regions denote ± 1 SD from thirty models for historical, SSP1-2.6, SSP2-4.5 and SSP5-8.5 scenarios.
Figure 10
Figure 10
Future changes in precipitation intensity (%) from SSP1-2.6 (low emission), SSP2-4.5 (medium emission) and SSP5-8.5 (high mission) scenarios of CMIP6 during near, mid and far future with reference to the baseline 1985–2014. The stippling (dotted) regions represent the changes are statistically significant at 0.05 level.
Figure 11
Figure 11
Future changes in 1-day highest precipitation (%) from SSP1-2.6 (low emission), SSP2-4.5 (medium emission) and SSP5-8.5 (high mission) scenarios of CMIP6 during near, mid and far future with reference to the baseline 1985–2014. The stippling (dotted) regions represent the changes are statistically significant at 0.05 level.
Figure 12
Figure 12
Future changes in more than 10 mm precipitation days (%) from SSP1-2.6 (low emission), SSP2-4.5 (medium emission) and SSP5-8.5 (high mission) scenarios of CMIP6 during near, mid and far future with reference to the baseline 1985–2014. The stippling (dotted) regions represent the changes are statistically significant at 0.05 level.
Figure 13
Figure 13
Future changes in dry days (days) from SSP1-2.6 (low emission), SSP2-4.5 (medium emission) and SSP5-8.5 (high mission) scenarios of CMIP6 during near, mid and far future with reference to the baseline 1985–2014. The stippling (dotted) regions represent the changes are statistically significant at 0.05 level.
Figure 14
Figure 14
Time series of area averaged UAE annual (a) SDII, (b) RX1DAY, (c) PD10mm and (d) CDD anomalies (relative to 1985–2014) from CMIP6 models. The solid thick lines represent MMM and the shaded regions denote ± 1 SD from thirty models for historical, SSP1-2.6, SSP2-4.5 and SSP5-8.5 scenarios.
Figure 15
Figure 15
Boxplots of regionally averaged precipitation extreme indices over UAE for SSP1-2.6. Boxes indicate the interquartile model spread (25th and 75th quantiles), with the horizontal line indicating the multi model median and the whiskers showing the total intermodel range.
Figure 16
Figure 16
Boxplots of regionally averaged precipitation extreme indices over UAE for SSP2-4.5. Boxes indicate the interquartile model spread (25th and 75th quantiles), with the horizontal line indicating the multi model median and the whiskers showing the total intermodel range.
Figure 17
Figure 17
Boxplots of regionally averaged precipitation extreme indices over UAE for SSP5-8.5. Boxes indicate the interquartile model spread (25th and 75th quantiles), with the horizontal line indicating the multi model median and the whiskers showing the total intermodel range.

Similar articles

Cited by

References

    1. IPCC. (2013). Climate change 2013: The physical science basis. Contribution of working group I to the fifth assessment report of the intergovernmental panel on climate change (In T. F. Stocker, D. Qin, G.-K. Plattner, M. Tignor, S. K. Allen, J. Boschung et al., Eds., pp. 1535). Cambridge University Press.
    1. Clarke B, et al. Extreme weather impacts of climate change: An attribution perspective. Environ. Res. Clim. 2022;1:012001. doi: 10.1088/2752-5295/ac6e7d. - DOI
    1. IPCC et al. Global Warming of 15°C An IPCC Special Report on the impacts of global warming of 15°C Above Pre-Industrial Levels And Related Global Greenhouse Gas Emission Pathways. In: Masson-Delmotte V, Zhai P, Pörtner HO, Roberts D, Skea J, Shukla PR, et al., editors. In the Context Of Strengthening The Global Response To The Threat Of Climate Change, Sustainable Development, And Efforts To Eradicate Poverty. Cambridge University Press; 2018. pp. 3–24.
    1. IPCC et al. Summary for policymakers. In: Masson-Delmotte V, Zhai P, Pirani A, Connors SL, Péan C, Berger S, et al., editors. Climate change 2021: The Physical Science Basis: Contribution of Working Group I to the Sixth Assessment Report of the Intergovernmental Panel on Climate Change. Cambridge University Press; 2021.
    1. Trenberth KE. Changes in precipitation with climate change. Clim. Res. 2011;47:123–138. doi: 10.3354/cr00953. - DOI