

Multi-century (635-year) spring season precipitation reconstruction from northern Pakistan revealed increasing extremes
- PMID: 38168593
- PMCID: PMC10761852
- DOI: 10.1038/s41598-023-50819-5
Multi-century (635-year) spring season precipitation reconstruction from northern Pakistan revealed increasing extremes
Abstract
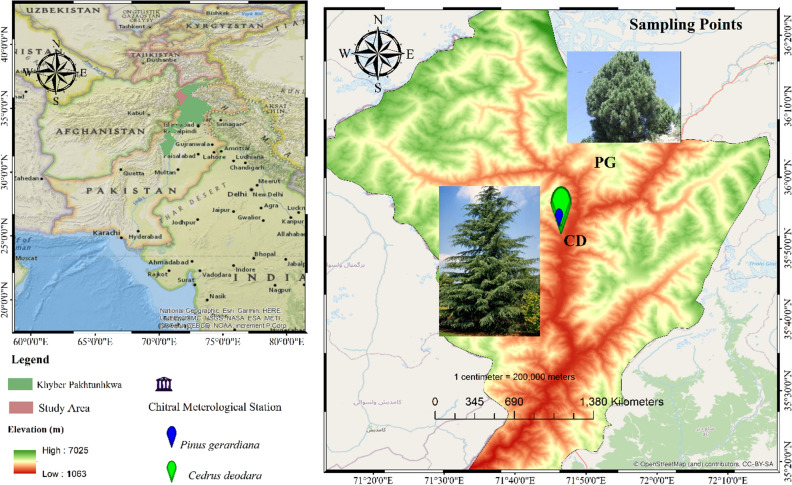
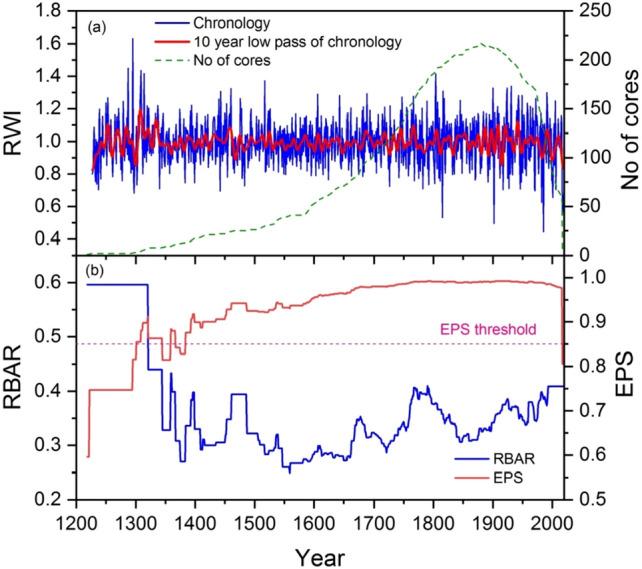
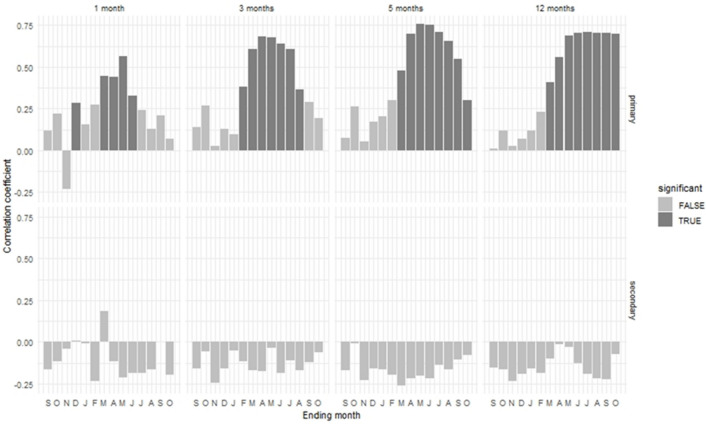
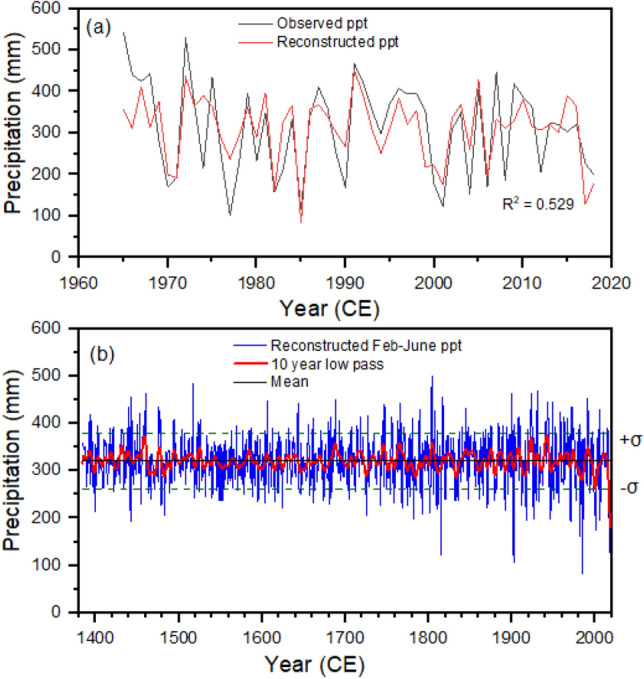
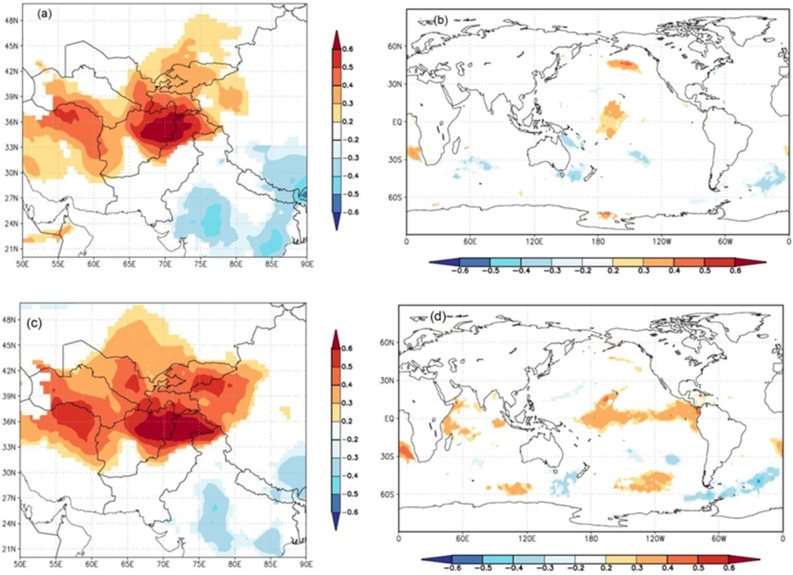
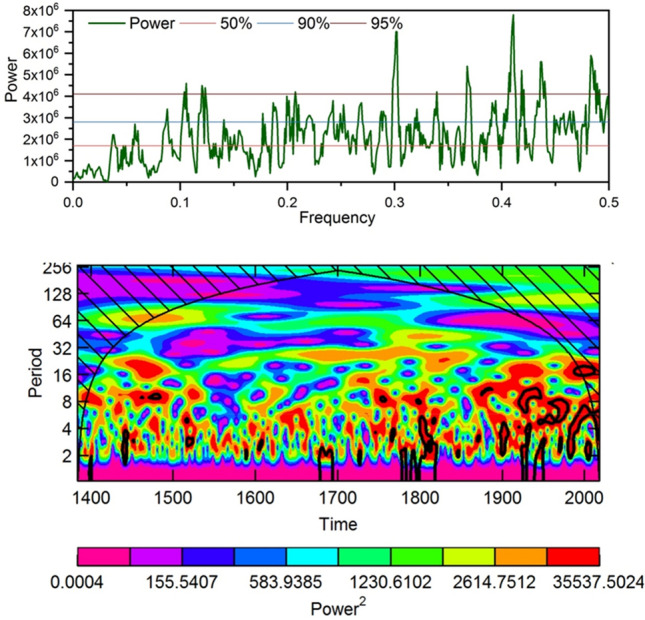
The Hindu Kush Himalaya region is experiencing rapid climate change with adverse impacts in multiple sectors. To put recent climatic changes into a long-term context, here we reconstructed the region's climate history using tree-ring width chronologies of climate-sensitive Cedrus deodara and Pinus gerardiana. Growth-climate analysis reveals that the species tree-growth is primarily limited by moisture stress during or preceding the growing season, as indicated by a positive relationship between the chronology and precipitation and scPDSI, and a negative one with temperature. We have reconstructed 635 years (1384-2018 CE) of February-June precipitation using a robust climate reconstruction model that explains about 53% variance of the measured precipitation data. Our reconstruction shows several dry and wet episodes over the reconstruction period along with an increase in extreme precipitation events during recent centuries or years. Long, very wet periods were observed during the following years: 1392-1393, 1430-1433, 1456-1461, 1523-1526, 1685-1690, 1715-1719, 1744-1748, 1763-1767, 1803-1806, 1843-1846, 1850-1855, 1874-1876, 1885-1887, 1907-1909, 1921-1925, 1939-1944, and 1990-1992, while long dry periods were observed during the following years: 1398-1399, 1464-1472, 1480-1484, 1645-1649, 1724-1727, 1782-1786, 1810-1814, 1831-1835, 1879-1881, 1912-1918, 1981-1986, 1998-2003, and 2016-2018 CE. We found predominantly short-term periodicity cycles of 2.0, 2.2, 2.3, 2.4, 2.6-2.7, 2.9, 3.3, 4.8, 8.1-8.3, and 9.4-9.6 years in our reconstruction. Spatial correlation analyses reveal that our reconstruction is an effective representation of the precipitation variability in the westerly climate-dominated areas of Pakistan and adjacent regions. In addition to the influence of regional circulation systems like western disturbances, we found possible teleconnections between the precipitation variability in northern Pakistan and broader-scale climate modes or phases like AMO and ENSO. The study also highlights the prospects of tree-ring application to explore linkages between western disturbance, increasing intensity and frequency of extreme climate events, and analysis of long-term atmospheric circulation over the western Himalayan region.
© 2024. The Author(s).
Conflict of interest statement
The authors declare no competing interests.
Figures


References
-
- Pörtner, H.O., Roberts, D.C., Adams, H., Adler, C., Aldunce, P., Ali, E. Ibrahim ZZ Climate change 2022: Impacts, adaptation and vulnerability (p. 3056). Geneva, Switzerland: IPCC (2022).
-
- Allan, R.P., Hawkins, E., Bellouin, N., Collins, B. (2021). IPCC, 2021: Summary for Policymakers.
-
- Maharjan, S.B., Mool, P.K., Lizong, W., Xiao, G., Shrestha, F., Shrestha, R.B., Baral, P. The Status of Glacial Lakes in the Hindu Kush Himalaya-ICIMOD Research Report 2018/1. in International Centre for Integrated Mountain Development (ICIMOD) (2018).
-
- Zhan YJ, Ren GY, Shrestha AB, Rajbhandari R, Ren YY, Sanjay J, Wang S. Changes in extreme precipitation events over the Hindu Kush Himalayan region during 1961–2012. Adv. Clim. Change Res. 2017;8(3):166–175. doi: 10.1016/j.accre.2017.08.002. - DOI
LinkOut - more resources
Full Text Sources
