. 2024 Jan;9(1):95-107.
doi: 10.1038/s41564-023-01546-0. Epub 2024 Jan 2.

Candida albicans extracellular vesicles trigger type I IFN signalling via cGAS and STING

Affiliations

Candida albicans extracellular vesicles trigger type I IFN signalling via cGAS and STING

Hannah Brown Harding et al. Nat Microbiol. 2024 Jan.

Abstract

The host type I interferon (IFN) pathway is a major signature of inflammation induced by the human fungal pathogen, Candida albicans. However, the molecular mechanism for activating this pathway in the host defence against C. albicans remains unknown. Here we reveal that mice lacking cyclic GMP-AMP synthase (cGAS)-stimulator of IFN genes (STING) pathway components had improved survival following an intravenous challenge by C. albicans. Biofilm-associated C. albicans DNA packaged in extracellular vesicles triggers the cGAS-STING pathway as determined by induction of interferon-stimulated genes, IFNβ production, and phosphorylation of IFN regulatory factor 3 and TANK-binding kinase 1. Extracellular vesicle-induced activation of type I IFNs was independent of the Dectin-1/Card9 pathway and did not require toll-like receptor 9. Single nucleotide polymorphisms in cGAS and STING potently altered inflammatory cytokine production in human monocytes challenged by C. albicans. These studies provide insights into the early innate immune response induced by a clinically significant fungal pathogen.


Conflict of interest statement

Competing interests

The authors declare no competing interests.

Figures

Extended Data Fig. 1 |
Extended Data Fig. 1 |. Characterization of organs and serum from C. albicans-infected WT and Sting−/− mice.
a. Quantification of fungal burden following a C. albicans infection in WT and Sting−/− mice in the kidneys, liver, spleen, and brains (n = 4 for WT and Sting−/− for each time point). Kidney BUN (b) and creatinine levels (c) were measured from serum of infected and uninfected WT and Sting−/− mice over 28 days. n = 5 for each time point. d. Representative gating strategy for flow cytometry analysis showing selection of total kidney cells (SSC v FSC) → live white blood cells (WBC) (7AAD- and CD45 + ) → WBCs that are not B cells or T cells (CD90.2-, CD19-), and of these, how many are neutrophils (Siglec F + , Ly6G + ). e. Quantification of flow-based immunophenotyping of CD45+ WBCs and (f) Siglec F + , Ly6G+ neutrophils from single cell suspensions of kidneys from WT and Sting−/− mice (n = 6 for each group). g. Immunoblot of viperin from kidney homogenates harvested from WT and Sting−/− mice infected with 150,000 C. albicans at day 3 and day 5, compared to the positive control (immortalized WT macrophages stimulated with cGAMP for 6 h prior to lysis). h. Semi-quantification of fungal burden severity in GMS-stained kidney sections of WT and Sting−/− mice (n = 12). Statistical analyses were performed on raw data by means of a non-parametric, two-tailed Mann Whitney U test = 38.5, p = 0.0364. Data are presented as mean values +/− SD.
Extended Data Fig. 2 |
Extended Data Fig. 2 |. Further characterization of the viperin and IFNß response to C. albicans EVs.
a. Immunoblot of viperin in lysates from WT macrophages stimulated with PBS, ergosterol alone, EVs from C. albicans or C. auris, or cGAMP. b. IFNß production in the supernatants from the same stimulated WT macrophages as in (a). Significance determined using a one-way ANOVA, ***adj. p = 0.0004, **adj. p = 0.004 c. Average sizes of EVs extracted from C. albicans (grown in different conditions) and C. auris. d. Immunoblot of viperin induction in WT, Card9−/−, Dectin-1−/−, and Tlr9−/− immortalized macrophages following stimulation with PBS or C. albicans EVs. e. IFNß production by WT, cGAS−/−, Sting−/−, Card9−/−, Dectin-1−/−, and Tlr9−/− macrophages following a stimulation with PBS, cGAMP, or C. albicans EVs. Significance determined using a two-way ANOVA and subsequent Dunnett’s multiple comparison test with the exception of Card9−/−, which was an ordinary one-way ANOVA and subsequent Dunnett’s multiple comparison test, *adj. p = 0.0031, **adj. p < 0.01, ***adj. p < 0.001, ****adj. p < 0.0001 vs PBS f. Immunoblot of viperin and g. IFNß production by WT macrophages stimulated with graded amounts of EVs extracted from C. albicans 48 h BF. Significance determined using a one-way ANOVA and subsequent Dunnett’s multiple comparison test *adj. p = 0.0364, ***adj. p = 0.0008, ****adj. p < 0.0001 vs PBS. n = 3 biologically independent samples for all ELISAs and data are presented as mean values +/− SD. All Westerns were done in biological triplicate, representative blot shown. Macrophages were stimulated for 6 h prior to processing.
Extended Data Fig. 3 |
Extended Data Fig. 3 |. C. albicans EVs induce translocation of cGAS from the nuclear membrane to the cytosol.
Representative microscopy images of macrophages expressing cGAS-GFP and the localization of cGAS following no stimulation or stimulation with DiI only, C. albicans EVs only, or DiI-labeled C. albicans EVs. Macrophages were stimulated for 3 h prior to imaging. Size bar = 5 μm. Microscopy experiments were repeated with appropriate controls in biological triplicate, representative images shown of similar results.
Extended Data Fig. 4 |
Extended Data Fig. 4 |. Further characterization of the viperin and IFNß response to C. albicans BF DNA.
a. Immunoblot of viperin induction in WT macrophages stimulated with PBS, C. albicans EVs, Benzonase-treated EVs, and transfected EV DNA. b. Immunoblot of viperin induction and c. IFNβ production in WT macrophages stimulated with DNA extracted from C. albicans biofilms (BF) grown for 48 h, 72 h, 96 h and Lipofectamine reagents only. Significance was determined with an ordinary one-way ANOVA and subsequent Dunnett’s multiple comparison test. **adj. p = 0.0012, ***adj. p = 0.0002, ***adj. p < 0.0001 vs untreated control (Lipofectamine). d. Immunoblot of viperin induction in WT, Sting−/−, Card9−/−, Dectin-1−/−, and Tlr9−/− macrophages following a stimulation with PBS, cGAMP, and DNA extracted from C. albicans BF grown for 72 h. e. IFNß production by WT, cGas−/−, Sting−/−, Card9−/−, Dectin-1−/−, and Tlr9−/− macrophages following a stimulation with PBS and DNA extracted from C. albicans BF grown for 72 h. Significance determined using a two-way ANOVA and subsequent Dunnett’s multiple comparison test. ****p < 0.0001 vs untreated control (PBS). f. Immunoblot of STING pathway component in WT, cGas−/−, and Sting−/− immortalized macrophages treated with increasing concentrations of the STING inhibitor, H-151. Cells were treated with H-151 1 h prior to stimulation with PBS, cGAMP, C. albicans BF DNA, or LPS (STING independent positive control). g. Immunoblot of viperin and actin in WT, cGas−/−, and Sting−/− macrophages treated with the H-151 1 h prior to PBS, cGAMP, C. albicans BF DNA, or C. albicans EV stimulation. All macrophages were stimulated for 6 h prior to processing. n = 3 biologically independent samples for all ELISAs and data are presented as mean values +/− SD. All Westerns were done in biological triplicate, representative blot shown.
Extended Data Fig. 5 |
Extended Data Fig. 5 |. Regional association plots for SNPs identified in cGAS and STING.
Regional association plot of SNPs around the MB21D1gene locus for Candida-induced TNF–α concentrations (a) and for Candida-induced IL-6 concentrations (b). Regional association plot of SNPs around the TMEM173 gene locus for Candida-induced TNF–α concentrations (c) and for Candida-induced IL-6 concentrations (d). The -log10 p-values of imputed SNPs are plotted on the y-axis against their physical position (NCBI build 36) on the x-axis. The most strongly associated SNPs in the regions are represented with purple diamond and surrounding markers are color coded according to their correlation coefficient (r2) with the top SNP using the hg19/1000 Genomes European samples. The light blue lines denote the estimated recombination rates. e. Evidence of the top SNPs regulation the expression levels of MB21D1 and TMEM173. We queried the most significant or top SNPs for statistical evidence of association with the target genes using the eQTLGen database and considered a p value of < 5 × 10⁻⁸ to be the threshold for significant cytokine QTLs. f. TNF production by WT, cGas−/−, and Sting−/− murine macrophages following a 2 h co-culture with live C. albicans. ****adj. p < 0.0001 vs. WT. n = 3 biologically independent samples for ELISA and data are presented as mean values +/− SD. Significance determined using an ordinary one-way ANOVA and subsequent Dunnett’s multiple comparison test.
Fig. 1 |
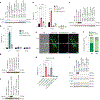
Fig. 1 |. Deletion of cGAS or STING renders mice more resistant to intravenous C. albicans.
a,b, WT, cGas−/− (a), and Sting−/− (b) mice were infected intravenously with 100,000 or 150,000 C. albicans yeast, respectively. The data are presented as Kaplan–Meier survival curves representative of three experiments (n = 14 for each group, and significance was determined using a log-rank test (Mantel–Cox) **P = 0.0041, ***P < 0.001 versus WT, data are presented as mean values ± standard deviation). c, Quantification of renal fungal burden following a C. albicans infection in WT and Sting−/− mice (n = 8 for WT and 14 for Sting−/− for each timepoint). d, Histological analysis of kidney sections from WT and Sting−/− mice at day 5 following a C. albicans infection. Host immune cells and fungal cells were identified by H&E and GMS staining, respectively. Scale bar, 100 μm. e, Efficacy of fungal killing by WT, cGas−/− and Sting−/− immortalized macrophages to kill C. albicans for 2 h at varying ratios. Data calculated by two-way ANOVA and subsequent Dunnett’s multiple comparison test. Data are presented as mean values from three biological replicates ± standard deviation, ****P < 0.0001 versus WT.
Fig. 2 |
Fig. 2 |. C. albicans EVs and BF DNA activate the STING pathway.
a, Immunoblot of viperin in WT, cGAS−/− and Sting−/− macrophages in response to PBS, cGAMP, C. albicans EVs or ergosterol. b, Secretion of IFNβ by WT, cGas−/− and Sting−/− macrophages stimulated with PBS, cGAMP, C. albicans EVs and ergosterol. c, Immunoblot of viperin induction in WT, cGAS−/− and Sting−/− macrophages following a stimulation with PBS, cGAMP and EVs extracted from either C. albicans BF grown for 48 h or C. albicans planktonic culture. d, IFNβ production by WT, cGas−/− and Sting−/− macrophages, following a stimulation with PBS, EVs extracted from either a C. albicans BF grown for 48 h, or C. albicans planktonic culture. e. Representative microscopy images of cGAS–GFP macrophages with and without stimulation with DiI-labelled C. albicans BF EVs (DIC = differential interference contrast). Macrophages were stimulated for 3 h before imaging. f. Quantification of nuclear versus non-nuclear cGAS–GFP localization patterns in unstimulated and stimulated cells. g,h, Immunoblot of viperin (g) and IFNβ production in response to non-transfected (NT) and transfected (TF) cGAMP, BF DNA and Benzonase (Benz.)-treated BF DNA (h). i, Immunoblot of phosphorylated IRF3, total IRF3, phosphorylated TBK1, total TBK1 and actin in response to TF cGAMP and BF DNA in WT, cGas−/− and Sting−/− macrophages. j, Immunoblot of viperin in WT cells treated with Dynasore or vehicle control of dimethyl sulfoxide (DMSO) before stimulation with PBS, C. albicans EVs and TF C. albicans BF DNA. Macrophages were stimulated for 6 h before processing. Two-way (b and d) and one-way (h) ANOVAs with subsequent Dunnett’s multiple comparison tests are shown for ELISAs. Data are presented as mean values from three biological triplicates ± standard deviation, with adjusted (adj.) P values. *adj. P = 0.0143, **adj. P = 0.012, ***adj. P = 0.0007, ****adj. P < 0.0001 versus untreated control (PBS or Lipofectamine). All western blots were done in biological triplicate, representative blot shown.
Fig. 3 |
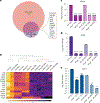
Fig. 3 |. Early ISG upregulation in WT macrophages stimulated by C. albicans EVs and BF DNA.
a, Venn diagram of genes identified by NanoString analysis as induced by C. albicans EVs and BF DNA in WT macrophages as compared with their controls (PBS and Lipofectamine alone, respectively). The 13 overlapping genes are highlighted in the purple box and the ISGs are bolded. b, A heatmap is shown of normalized counts with z-scores and unsupervised clustering of these 13 overlapping genes in WT, cGas−/− and Sting−/− macrophages stimulated with PBS EVs, BF DNA or Lipofectamine (Lipo) alone. ce, RT–qPCR analysis of RSAD2 (c), OASL (d) and IFIT3 (e) in WT, cGas−/− and Sting−/− macrophages after stimulation with PBS, EVs, Lipofectamine or BF DNA is shown, n = 3. All data are representative of at least two independent experiments. For RT–qPCR panels, error bars indicate the standard deviation, and statistical analyses were performed by means of unpaired two-tailed Student’s t-tests as compared with the appropriate control, with **P < 0.01; ***P = 0.0002; and ****P < 0.0001.
Fig. 4 |
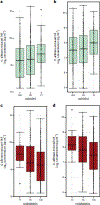
Fig. 4 |. Functional consequence of activating the STING pathway.
a,b, Boxplots show the top SNP rs610913 at the MB21D1 locus (cGAS) stratified by genotypes for C. albicans-induced TNFα concentrations (a) and for C. albicans-induced IL6 concentrations (b). c,d, Individuals homozygous for the G allele (GG) on average produce less TNFα and IL6 than individuals carrying one G allele (GT) or homozygous for the T allele (TT). Boxplots show the top SNP rs28396805 at the TMEM173 locus (STING) stratified by genotypes for C. albicans-induced IL6 concentrations (c) and C. albicans-induced TNFα concentrations (d). On average, carriers of the C allele (CC and TC) produce less IL6 and TNFα than individuals homozygous for the T allele (TT). The minimum portion of the error bars denote the first quartile (25th percentile) and the maximum part of the error bars represent the third quartile (75th percentile). The black line in the middle denotes the median (50th) percentile. The black dots are whiskers that span between the minimum and maximum values. A total of n = 442 samples have genotype and cytokine data from the 500FG cohort.

References

    1. Tsay S et al. National burden of candidemia, United States, 2017. Open Forum Infect. Dis 5, S142 (2018).
    1. Cornely OA et al. Epidemiology and outcome of fungemia in a cancer Cohort Of the Infectious Diseases Group (IDG) of the European Organization for Research and Treatment of Cancer (EORTC 65031). Clin. Infect. Dis 10.1093/cid/civ293 (2015). - DOI - PubMed
    1. Smeekens SP et al. Functional genomics identifies type I interferon pathway as central for host defense against Candida albicans. Nat. Commun 4, 1342 (2013). - PMC - PubMed
    1. Pekmezovic M et al. Candida pathogens induce protective mitochondria-associated type I interferon signalling and a damage-driven response in vaginal epithelial cells. Nat. Microbiol 6, 643–657 (2021). - PubMed
    1. Bourgeois C et al. Conventional dendritic cells mount a type I IFN response against Candida spp. Requiring novel phagosomal TLR7-mediated IFN-β signaling. J. Immunol 186, 3104–3112 (2011). - PubMed