. 2024 Jan;34(1):58-75.
doi: 10.1038/s41422-023-00909-w. Epub 2024 Jan 2.

ZNF689 deficiency promotes intratumor heterogeneity and immunotherapy resistance in triple-negative breast cancer

Affiliations

ZNF689 deficiency promotes intratumor heterogeneity and immunotherapy resistance in triple-negative breast cancer

Li-Ping Ge et al. Cell Res. 2024 Jan.

Abstract

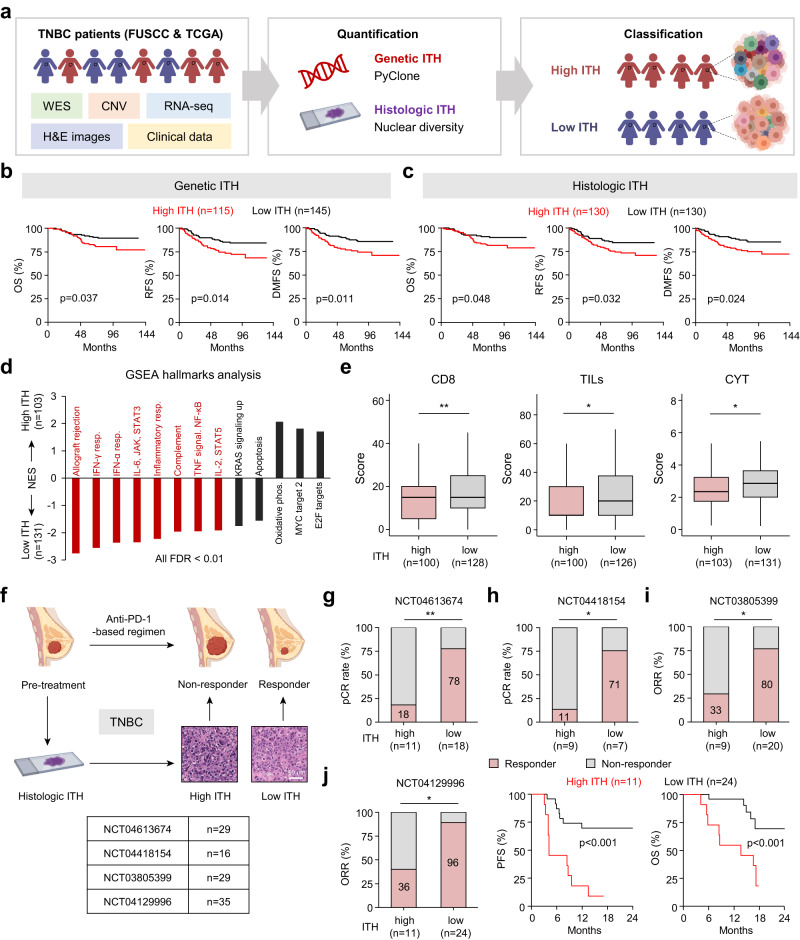
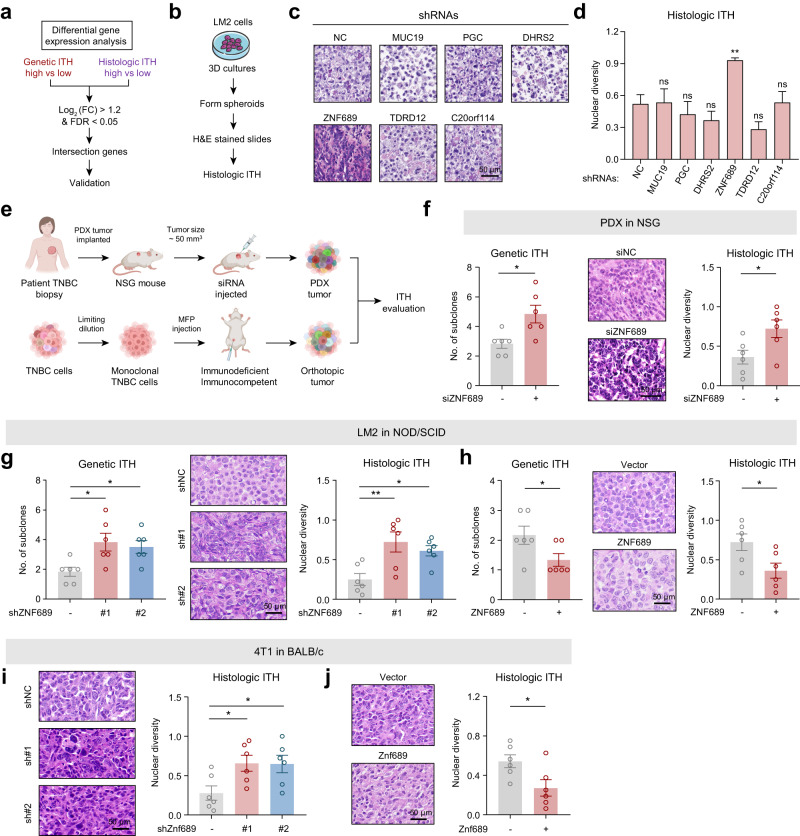
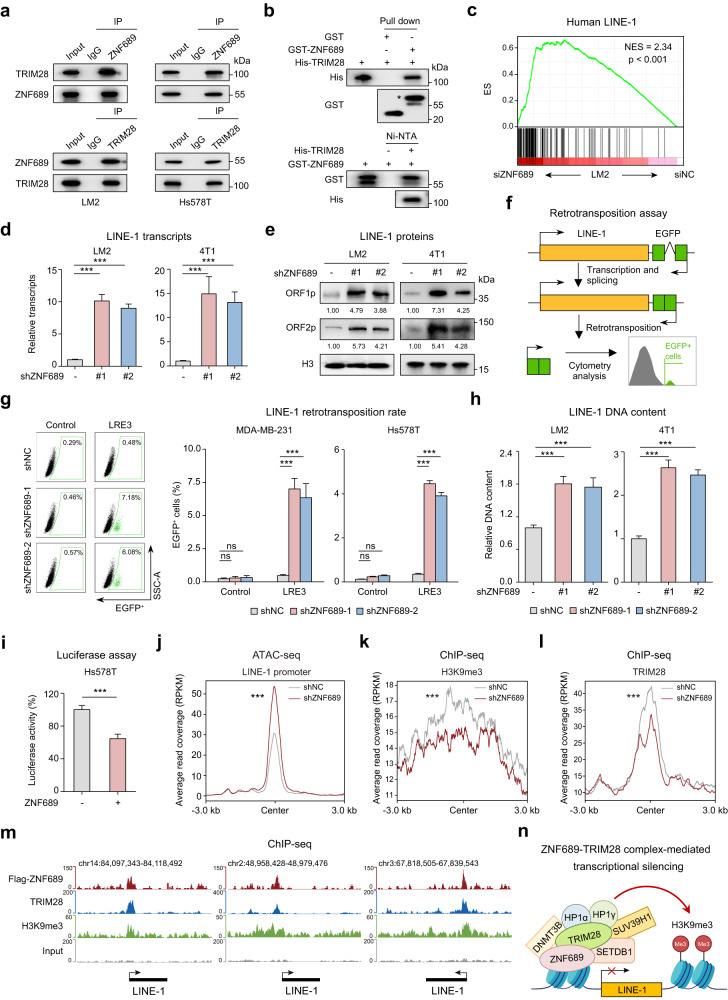
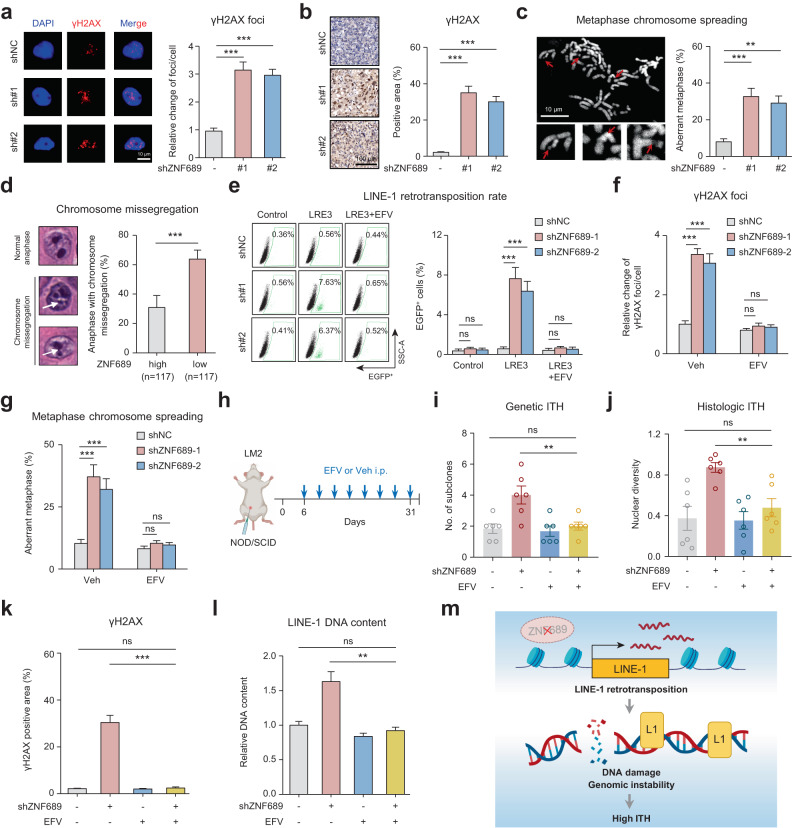
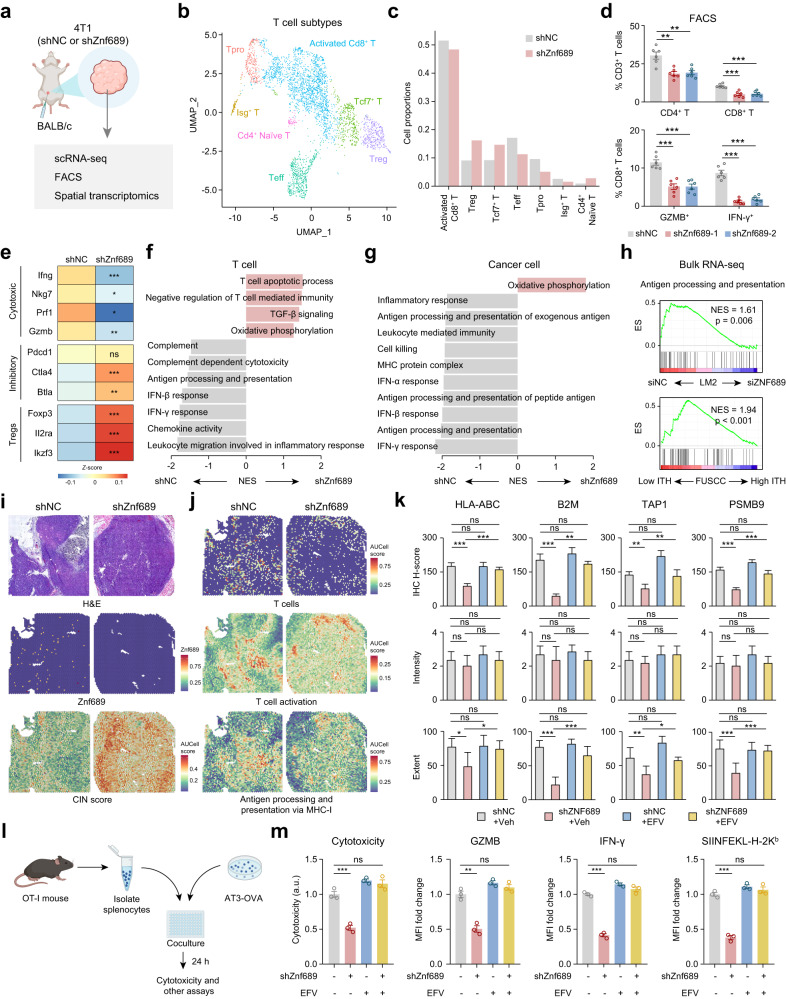
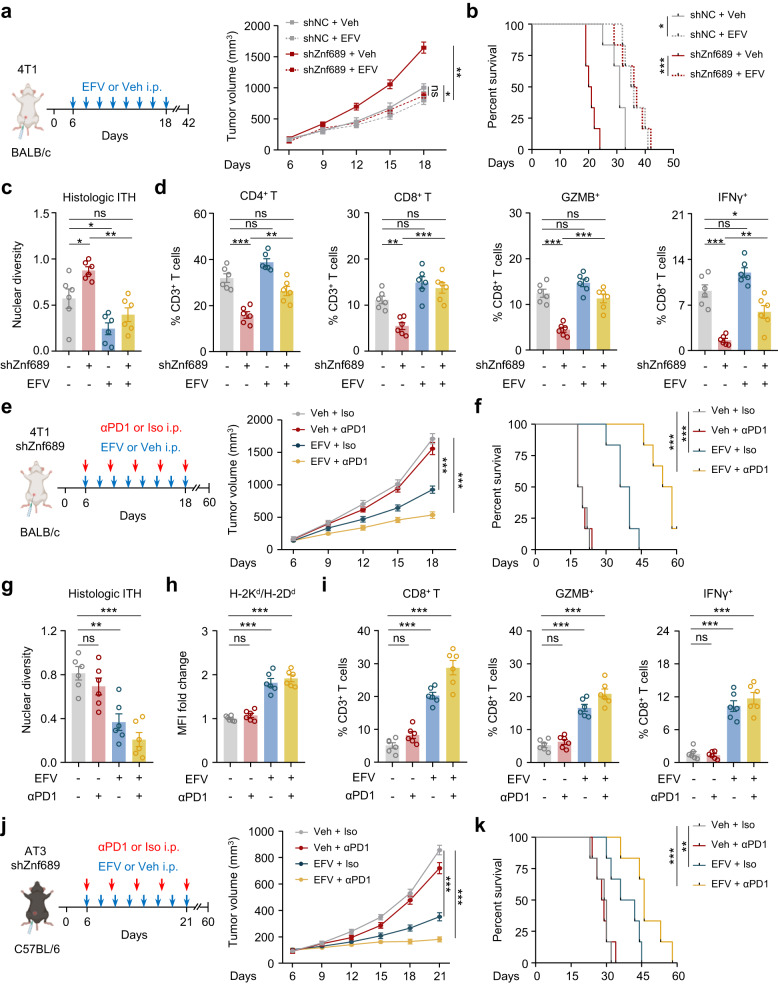
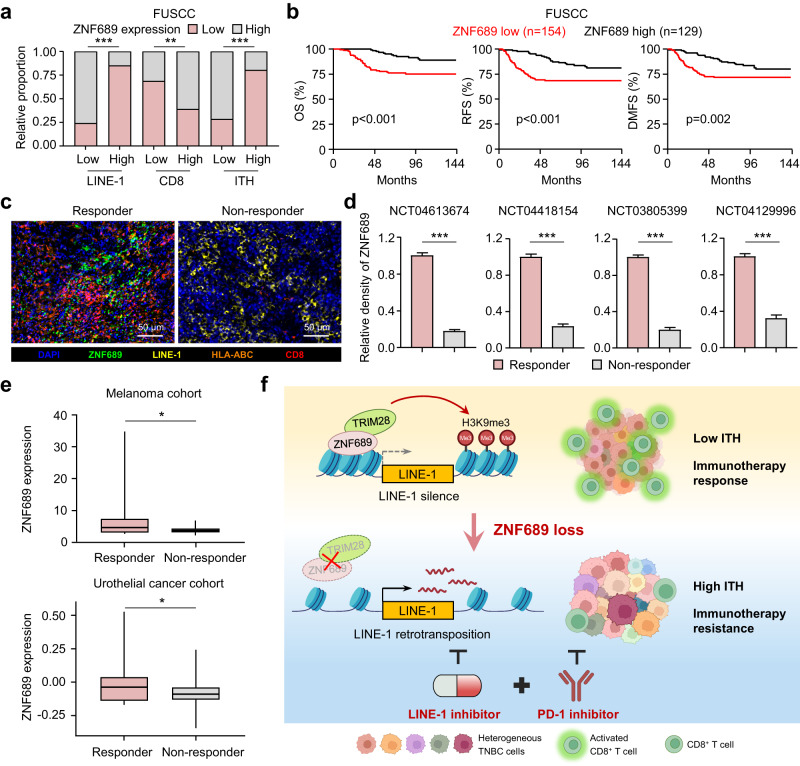
Triple-negative breast cancer (TNBC) is an aggressive disease characterized by remarkable intratumor heterogeneity (ITH), which poses therapeutic challenges. However, the clinical relevance and key determinant of ITH in TNBC are poorly understood. Here, we comprehensively characterized ITH levels using multi-omics data across our center's cohort (n = 260), The Cancer Genome Atlas cohort (n = 134), and four immunotherapy-treated cohorts (n = 109). Our results revealed that high ITH was associated with poor patient survival and immunotherapy resistance. Importantly, we identified zinc finger protein 689 (ZNF689) deficiency as a crucial determinant of ITH formation. Mechanistically, the ZNF689-TRIM28 complex was found to directly bind to the promoter of long interspersed element-1 (LINE-1), inducing H3K9me3-mediated transcriptional silencing. ZNF689 deficiency reactivated LINE-1 retrotransposition to exacerbate genomic instability, which fostered ITH. Single-cell RNA sequencing, spatially resolved transcriptomics and flow cytometry analysis confirmed that ZNF689 deficiency-induced ITH inhibited antigen presentation and T-cell activation, conferring immunotherapy resistance. Pharmacological inhibition of LINE-1 significantly reduced ITH, enhanced antitumor immunity, and eventually sensitized ZNF689-deficient tumors to immunotherapy in vivo. Consistently, ZNF689 expression positively correlated with favorable prognosis and immunotherapy response in clinical samples. Altogether, our study uncovers a previously unrecognized mechanism underlying ZNF689 deficiency-induced ITH and suggests LINE-1 inhibition combined with immunotherapy as a novel treatment strategy for TNBC.


Conflict of interest statement

The authors declare no competing interests.

Figures

Fig. 1
Fig. 1. High ITH reduces patient survival and confers immunotherapy resistance in TNBC.
a Flow chart of ITH analysis in TNBC. b, c Kaplan–Meier analyses of the OS, RFS and DMFS of FUSCC patients grouped according to genetic ITH (b) and histologic ITH (c). d Normalized enrichment score (NES) for hallmark gene sets correlated with genetic ITH levels in the FUSCC cohort. Red indicates immune gene sets. FDR false discovery rate, phos. phosphorylation, resp. response. e The CD8, TILs, and CYT scores of patients in the FUSCC cohort with different levels of genetic ITH. f Schematic overview of the analytical workflow. Four clinical trials were used to document the relationship between pretreatment ITH and anti-PD-1 responses in TNBC. Scale bar, 60 μm. gi Analysis of the responses in patients with different levels of histologic ITH in NCT04613674 (g), NCT04418154 (h) and NCT03805399 (i). j Analysis of the response, PFS and OS in patients with different levels of histologic ITH in NCT04129996. P values were determined using log-rank tests (b, c, j), Wilcoxon tests (e), and Fisher’s exact tests (gj). *P < 0.05, **P < 0.01.
Fig. 2
Fig. 2. ZNF689 deficiency promotes ITH in TNBC.
a Flowchart of the screening process. FC fold change; FDR false discovery rate. b Protocols of the 3D tumor sphere assay to evaluate the histologic ITH of LM2 cells. c Representative images of H&E-stained LM2 spheroids. d Histologic ITH analysis of LM2 spheroids. e Graphic illustration of different mouse models to examine the role of ZNF689 in ITH. f The genetic ITH and histologic ITH of TNBC PDX tumors from NSG mice (n = 6) after intratumoral administration with either siNC or siZNF689. g The genetic ITH and histologic ITH of orthotopic tumors generated by inoculating NOD/SCID mice (n = 6) in the MFPs with shNC or shZNF689 LM2 cells. h The genetic ITH and histologic ITH of orthotopic tumors generated by inoculating NOD/SCID mice (n = 6) in the MFPs with vector- or ZNF689-overexpressing LM2 cells. i Histologic ITH of orthotopic tumors generated by injecting shNC or shZnf689 4T1 cells into the MFPs of BALB/c mice (n = 6). j Histologic ITH of orthotopic tumors generated by injecting vector- or Znf689-overexpressing 4T1 cells into the MFPs of BALB/c mice (n = 6). Scale bars, 50 μm. P values were determined using one-way ANOVA (d, g, i) and two-tailed unpaired Student’s t-tests (f, h, j). ns not significant; *P < 0.05, **P < 0.01.
Fig. 3
Fig. 3. ZNF689 represses LINE-1 retrotransposition via TRIM28 complex-mediated transcriptional silencing.
a Co-IP experiments of endogenous ZNF689 and TRIM28 followed by western blotting. b In vitro pull-down assays of GST-tagged ZNF689 and His-tagged TRIM28 recombinant proteins followed by western blotting. A single asterisk represents the specific band. c Upregulation of the human LINE-1 gene signature in siZNF689-treated LM2 cells by GSEA. d RT-qPCR analysis of LINE-1 (ORF2) transcript levels in shNC and shZNF689 cells. e Western blot analysis of LINE-1 ORF1p and ORF2p proteins in shNC and shZNF689 cells. f Schematic illustration of the LINE-1 retrotransposition reporter assay. g Representative flow cytometry graphs are shown for cells harboring the LRE3-EGFP retrotransposition reporter or the retrotransposition-deficient JM111 control (left). Quantification of de novo retrotransposition events (EGFP-positive cells) in shNC and shZNF689 cells (right). h RT-qPCR analysis of the relative LINE-1 (5′-UTR for LM2; ORF2 for 4T1) genomic DNA content in shNC and shZNF689 cells. i Dual-luciferase reporter assay detecting the activity of the LINE-1 promoter in ZNF689-overexpressing cells. j ATAC-seq peak signals affected by ZNF689 knockdown at the full-length LINE-1 promoter in LM2 cells. k, l Metaplots showing changes in H3K9me3 (k) and TRIM28 (l) ChIP-seq signals upon ZNF689 knockdown in the full-length LINE-1 promoter. m ChIP-seq tracks showing the binding patterns of ZNF689, TRIM28, H3K9me3 and input at full-length LINE-1. n Schematic diagram showing that ZNF689 represses LINE-1 retrotransposition via TRIM28 complex-mediated transcriptional silencing. P values were determined using one-way ANOVA (d, g, h), two-tailed unpaired Student’s t-tests (i) and Wilcoxon tests (jl). ns not significant; ***P < 0.001.
Fig. 4
Fig. 4. ZNF689 deficiency-induced LINE-1 retrotransposition exacerbates genomic instability and promotes ITH.
a Representative IF images and quantification of γH2AX foci in shNC and shZNF689 LM2 cells (n = 30). Scale bar, 10 μm. b Representative IHC images and quantification of γH2AX in orthotopic shNC and shZNF689 LM2 tumors (n = 6). Scale bar, 100 μm. c Representative images and quantification of chromosome aberrations (red arrows) in shNC and shZNF689 LM2 cells at passage 20 (n = 50). Scale bar, 10 μm. d Representative images and quantification of chromosome missegregation errors (white arrows) in diagnostic H&E samples in the FUSCC cohort. e Representative flow cytometry graphs and quantification of de novo retrotransposition events (EGFP-positive cells) in shNC and shZNF689 MDA-MB-231 cells treated with EFV (20 μM). f Quantification of γH2AX foci in shNC and shZNF689 LM2 cells treated with EFV (20 μM) (n = 30). g Quantification of chromosome aberrations in shNC and shZNF689 LM2 cells at passage 20 treated with EFV (20 μM) (n = 50). h Schematic diagram of the EFV treatment regimen. After inoculation of shNC or shZNF689 LM2 cells into the MFP, the NOD/SCID mice were randomly divided into groups and treated daily with Veh or EFV via i.p. injection (n = 6 mice/group). i, j The genetic ITH (i) and histologic ITH (j) of orthotopic LM2 tumors from mice in h (n = 6). k Quantification of γH2AX in orthotopic tumors from mice in h (n = 6). l RT-qPCR analysis of LINE-1 (5′-UTR) DNA content of tumors dissected from mice in h (n = 6). m Schematic diagram showing that ZNF689 deficiency exacerbates genomic instability to promote ITH by reactivating LINE-1 retrotransposition. P values were determined using one-way ANOVA (ac, eg, il) and two-tailed unpaired Student’s t-tests (d). ns not significant; **P < 0.01, ***P < 0.001.
Fig. 5
Fig. 5. ZNF689 deficiency-induced ITH impairs antigen presentation and T-cell activation.
a shNC and shZnf689 4T1 cells were subcutaneously injected into the MFPs of BALB/c mice. Then tumors were used for scRNA-seq, fluorescence activated cell sorting (FACS) and spatial transcriptomics. b UMAP plot of reclassification of intratumoral T cells. c The distribution of T-cell subtypes in shNC and shZnf689 tumors. d Flow cytometry analysis of the percentages of CD4+ T cells, CD8+ T cells, GZMB+ CD8+ T cells, and IFN-γ+ CD8+ T cells in tumors (n = 6). e Heatmap showing the expression of marker genes for cytotoxic T cells, inhibitory T cells and Tregs in T cells of shNC and shZnf689 tumors. f, g Pathways downregulated in T cells (f) and cancer cells (g) in shZnf689 tumors. h Downregulation of antigen processing and presentation in siZNF689-treated LM2 cells and high genetic ITH tumors from the FUSCC cohort by GSEA. i H&E-stained tissue images, Znf689 expression and signature scores of CIN in the spots of shNC and shZnf689 tumors. j Signature scores of T cells, T-cell activation, and antigen processing and presentation via MHC-I in the spots of shNC and shZnf689 tumors. k IHC H-scores, intensity, and extent for HLA-ABC, B2M, TAP1, and PSMB9 protein expression in tumors from mice in Fig. 4h. l Schematic diagram of the in vitro tumor-immune cell coculture assay. m Cytotoxicity analysis of culture medium at 24 h after tumor cell and OT-I CD8+ T-cell coculture. Flow cytometry analysis was used to determine the expression of GZMB and IFN-γ in CD8+ T cells, and OVA (SIINFEKL–H-2Kb) presentation in AT3-OVA tumor cells at 24 h after tumor cell and OT-I splenocyte coculture. P values were determined using one-way ANOVA (d, k, m) and two-tailed unpaired Student’s t-tests (e). ns not significant; *P < 0.05, **P < 0.01, ***P < 0.001.
Fig. 6
Fig. 6. LINE-1 inhibition sensitizes ZNF689 deficiency-induced high-ITH tumors to immunotherapy in TNBC.
a Schematic diagram for the establishment of the orthotopic 4T1 syngeneic tumor model in BALB/c mice and the treatment schedule for the LINE-1 inhibitor EFV. Tumor growth curves are shown (n = 6 mice/group). b Kaplan–Meier survival curves for the mice in a. Survival data were obtained from another independent experiment. c Histologic ITH of orthotopic tumors from mice in a (n = 6). d Primary tumors from mice in a were harvested for flow cytometry to determine the percentages of CD4+ and CD8+ T cells among CD3+ T cells and GZMB+ and IFN-γ+ cells among CD8+ T cells (n = 6). e Schematic diagram for the establishment of the orthotopic shZnf689 4T1 syngeneic tumor model in BALB/c mice and the treatment schedule for PD-1 antibody and LINE-1 inhibitor EFV. Tumor growth curves are shown (n = 6 mice/group). f Kaplan–Meier survival curves for the mice in e. Survival data were obtained from another independent experiment. g The histologic ITH of orthotopic tumors from mice in e (n = 6). h Quantitative estimate of MHC-I levels on the surface of 4T1 tumors from mice in e (n = 6). MFI mean fluorescence intensity. i Primary tumors from mice in e were harvested for flow cytometry to determine the percentages of CD8+ T cells among CD3+ T cells and GZMB+ and IFN-γ+ cells among CD8+ T cells (n = 6). j Schematic diagram for the establishment of the orthotopic shZnf689 AT3 syngeneic tumor model in C57BL/6 mice and the treatment schedule for PD-1 antibody and LINE-1 inhibitor EFV. Tumor growth curves are shown (n = 6 mice/group). k Kaplan–Meier survival curves for the mice in j. Survival data were obtained from another independent experiment. P values were determined using two-way ANOVA (a, e, j), log-rank tests (b, f, k) and one-way ANOVA (c, d, gi). ns not significant; *P < 0.05, **P < 0.01, ***P < 0.001.
Fig. 7
Fig. 7. ZNF689 expression positively correlates with a favorable prognosis and immunotherapy response in TNBC.
a Analysis of the correlation of ZNF689 expression with LINE-1 ORF1p, CD8, and histologic ITH in TNBC tissues (n = 283). b Kaplan–Meier analysis of OS, RFS, and DMFS in TNBC patients from FUSCC grouped according to the expression of ZNF689. c Multiplex IF staining in one representative responder and one non-responder treated with anti-PD-1-based immunotherapy. Scale bars, 50 µm. d Quantification of ZNF689 expression in responders and non-responders in four trials. e Analysis of ZNF689 mRNA levels in all responder versus non-responder patients in the melanoma cohort (GSE91061) and urothelial cancer cohort (GSE176307). f Illustration of the proposed working model. P values were determined using Pearson’s χ2 test (a), log-rank test (b), two-tailed unpaired Student’s t-test (d), and one-tailed Student’s t-test (e). *P < 0.05, **P < 0.01, ***P < 0.001.

References

    1. Bianchini G, De Angelis C, Licata L, Gianni L. Treatment landscape of triple-negative breast cancer — expanded options, evolving needs. Nat. Rev. Clin. Oncol. 2022;19:91–113. doi: 10.1038/s41571-021-00565-2. - DOI - PubMed
    1. McGranahan N, Swanton C. Clonal heterogeneity and tumor evolution: past, present, and the future. Cell. 2017;168:613–628. doi: 10.1016/j.cell.2017.01.018. - DOI - PubMed
    1. Vitale I, et al. Mutational and antigenic landscape in tumor progression and cancer immunotherapy. Trends Cell Biol. 2019;29:396–416. doi: 10.1016/j.tcb.2019.01.003. - DOI - PubMed
    1. Schmid P, et al. Atezolizumab and nab-paclitaxel in advanced triple-negative breast cancer. N. Engl. J. Med. 2018;379:2108–2121. doi: 10.1056/NEJMoa1809615. - DOI - PubMed
    1. Cortes J, et al. Pembrolizumab plus chemotherapy versus placebo plus chemotherapy for previously untreated locally recurrent inoperable or metastatic triple-negative breast cancer (KEYNOTE-355): a randomised, placebo-controlled, double-blind, phase 3 clinical trial. Lancet. 2020;396:1817–1828. doi: 10.1016/S0140-6736(20)32531-9. - DOI - PubMed

Publication types

MeSH terms

Substances

LinkOut - more resources