. 2024 Jan;25(1):66-76.
doi: 10.1038/s41590-023-01682-z. Epub 2024 Jan 2.

CD4+ T cell immunity is dependent on an intrinsic stem-like program

Affiliations

CD4+ T cell immunity is dependent on an intrinsic stem-like program

Dawei Zou et al. Nat Immunol. 2024 Jan.

Abstract

CD4+ T cells are central to various immune responses, but the molecular programs that drive and maintain CD4+ T cell immunity are not entirely clear. Here we identify a stem-like program that governs the CD4+ T cell response in transplantation models. Single-cell-transcriptomic analysis revealed that naive alloantigen-specific CD4+ T cells develop into TCF1hi effector precursor (TEP) cells and TCF1-CXCR6+ effectors in transplant recipients. The TCF1-CXCR6+CD4+ effectors lose proliferation capacity and do not reject allografts upon adoptive transfer into secondary hosts. By contrast, the TCF1hiCD4+ TEP cells have dual features of self-renewal and effector differentiation potential, and allograft rejection depends on continuous replenishment of TCF1-CXCR6+ effectors from TCF1hiCD4+ TEP cells. Mechanistically, TCF1 sustains the CD4+ TEP cell population, whereas the transcription factor IRF4 and the glycolytic enzyme LDHA govern the effector differentiation potential of CD4+ TEP cells. Deletion of IRF4 or LDHA in T cells induces transplant acceptance. These findings unravel a stem-like program that controls the self-renewal capacity and effector differentiation potential of CD4+ TEP cells and have implications for T cell-related immunotherapies.


Figures

Extended Data Fig. 1 |
Extended Data Fig. 1 |. Single-cell transcriptome analysis of alloreactive CD4+ T cells (related to Fig. 1).
a–e, CD45.2+ WT B6 mice were adoptively transferred with CD45.1+ TEa CD4+ T cells, followed by BALB/c heart transplantation 1 d later. The transferred TEa cells from spleens and heart allografts were obtained at 7 days post-transplantation for scRNA-seq. a, Percentage heart allograft survival after transplantation. n = 5 mice. b, The gating strategy for sorting the transferred TEa cells from recipients. c, Violin plots show the expression distributions of indicated T cell marker genes, stem-like genes, and effector genes in each of the TEa cell clusters. d, Feature plots show the normalized gene expression of stem-like TEP cell and effector cell markers projected onto the uniform manifold approximation and projection (UMAP). e, Feature plots show the normalized gene expression of Th1, Th2, Th17, and Treg cell markers, projected onto the UMAP. In both d and e, gene expression level represented by color gradient ranging from gray (low expression) to purple (high expression).
Extended Data Fig. 2 |
Extended Data Fig. 2 |. Phenotypic characterization of the adoptively transferred TEa CD4+ T cells in transplant recipients (related to Figs. 2 and 3).
a,b, WT B6 and B6.Tcf7GFP mice were transplanted with BALB/c hearts. a, Experimental scheme. b, Percentage heart allografts in WT B6 and B6.Tcf7GFP mice (n = 6 mice per group). c–f, B6.Rag1−/− mice were adoptively transferred with CD45.1+ Tcf7GFP TEa cells and transplanted with BALB/c skins. c, Experimental scheme. d, Percentage skin allograft survival. n = 7 mice. e, TCF1.GFP expression of TEa cells in blood at indicated days after transplantation. Flow plots are gated on TEa cells. The line graph shows percentages of TCF1.GFP cells in TEa cells. Data are mean ± SD (n = 8 mice). f, TCF1.GFP expression of TEa cells in indicated tissues at 14 days after transplantation. Flow plots are gated on TEa cells. The bar graph shows percentages of TCF1.GFP+ cells in TEa cells. Data are mean ± SD (n = 4 mice), and results are representative of two independent experiments. g, CD45.1+ Tcf7GFP TEa cells were adoptively transferred into Rag1−/− mice receiving BALB/c skin transplantation. At 14 days post-transplantation, TCF1hi and TCF1 TEa cells were isolated from the secondary lymphoid organs and transferred into new Rag1−/− hosts that received BALB/c skin transplantation. In these new hosts, representative flow plots show TEa cell frequencies among CD45+ cells in indicated organs 14 days post-transplantation (related to Fig. 3e). In a and c, experimental schemes were created with BioRender.com. P values are from two-tailed unpaired Student’s t-test (f) or log-rank test (b).
Extended Data Fig. 3 |
Extended Data Fig. 3 |. CD4+ TEP cells self-renew and replenish the effector cell pool.
a–c, CD45.1+ Tcf7GFP TEa cells were adoptively transferred into Rag1−/− recipients receiving BALB/c skin transplantation. Ly108hiCXCR6 TEP TEa and Ly108loCXCR6+ effector TEa cells were isolated from the spleens and lymph nodes at 14 days post-transplantation, and adoptively transferred into new Rag1−/− recipients receiving BALB/c skin transplantation. The phenotypic changes of TEP TEa and effector TEa cells in new recipients were analyzed at 14 days post-transplantation. a, Experimental scheme. b, Representative flow plots (related to Fig. 3j) show percentage TEa cells within CD45+ cells in new recipients that were transferred with Ly108hiCXCR6 or Ly108loCXCR6+ TEa cells. Flow plots are gated on CD45+ cells. c, Representative flow plots (related to Fig. 3k) show Ly108 and CXCR6 expression of TEa cells in new recipients that were transferred with Ly108hiCXCR6 TEP TEa cells. Flow plots are gated on TEa cells. d,e, Cxcr6−/− and WT B6 mice were transplanted with BALB/c hearts. d, Experimental scheme. e, Percentage heart allograft survival after transplantation. n = 6 mice for the WT group, and n = 5 mice for the Cxcr6−/− group. In a and d, experimental schemes were created with BioRender.com. The P value is from log-rank test (e).
Extended Data Fig. 4 |
Extended Data Fig. 4 |. TCF1 sustains stem-like CD4+ TEP cells (related to Fig. 4).
a–d, CD45.1+ Tcf7−/− TEa and CD45.2+ WT TEa cells were mixed in a 1:1 ratio and adoptively co-transferred into Rag1−/− mice, followed by BALB/c skin transplantation. TEa cells in recipients were analyzed at 14 days post-transplantation. a, Experimental scheme. b, Percentage Tcf7−/− TEa and WT TEa cells among total TEa cells in spleens and grafts. n = 4 mice. c, IFN-γ production by Tcf7−/− TEa and WT TEa cells in spleens and dLNs. n = 4 mice. d, Percentage Ly108hiCXCR6 cells within Tcf7−/− TEa or WT TEa cells in the indicated tissues. n = 4 mice. Flow plots in b–d are gated on TEa cells. e, Rag1−/− mice were adoptively transferred with WT TEa cells transduced with mCherry alone (Ctrl-mCherry) or TCF1-mCherry, followed by BALB/c skin transplantation. Representative flow plots show Ly108 and CXCR6 expression of mCherry+ TEa cells in dLN at 14 days post-transplantation. Flow plots are gated on mCherry+ TEa cells. The bar graph shows percentage Ly108hiCXCR6+ cells in mCherry+ TEa cells. n = 4 mice for the Ctrl-mCherry group, and n = 3 mice for the TCF1-mCherry group. f,g, Tcf7fl/flCd4-Cre and Tcf7fl/fl control mice were transplanted with BALB/c hearts. f, Experimental scheme. g, Percentage heart allograft survival after transplantation. n = 6 mice per group. In a and f, experimental schemes were created with BioRender.com. In b–e, data are presented as mean ± SD, and results are representative of two independent experiments. P values are from two-tailed unpaired Student’s t-test (b–e) or log-rank test (g).
Extended Data Fig. 5 |
Extended Data Fig. 5 |. IRF4 governs the effector differentiation potential of stem-like CD4+ TEP cells (related to Fig. 4).
a–f, Rag1−/− mice were adoptively co-transferred with CD45.2+ Irf4−/− TEa and CD45.1+ WT TEa cells (in a 1:1 ratio), followed by BALB/c skin transplantation. a, Experimental scheme. Created with BioRender.com. b, Percentage Irf4−/− TEa and WT TEa cells within total TEa cells in blood at indicated days post-transplantation. Flow plots are gated on TEa cells. n = 4 mice. c, Representative flow plots show Ly108 and CXCR6 expression of TEa cells in dLN at 14 days post-transplantation. The bar graph shows percentage Ly108hiCXCR6 cells in Irf4−/− TEa and WT TEa cells. n = 3 mice. d, Percentage of TCF1+ cells within Irf4−/− TEa and WT TEa cells in the dLN at 14 days post-transplantation. n = 3 mice. e, Percentage of IFN-γ+ cells among Irf4−/− TEa and WT TEa cells in the dLN at 14 days post-transplantation. n = 3 mice. f, Percentage of granzyme B+ cells among Irf4−/− TEa and WT TEa cells in the dLN at 14 days post-transplantation. n = 3 mice. g, Rag1−/− mice were adoptively transferred with Irf4−/− TEa cells transduced with GFP alone (Ctrl–GFP) or IRF4–GFP, followed by BALB/c skin transplantation. Histogram and bar graph show CXCR6 expression of GFP+ TEa cells in the dLN at 14 days post-transplantation. n = 3 mice per group. In b–g, data are mean ± SD. P values are from two-tailed unpaired Student’s t-test (b–g).
Extended Data Fig. 6 |
Extended Data Fig. 6 |. T-bet is dispensable for the generation of Ly108loCXCR6+ effectors.
a–b, Rag1−/− mice were adoptively co-transferred with CD45.1+ Tbx21−/− TEa and CD45.2+ WT TEa cells (in a 1:1 ratio), followed by BALB/c skin transplantation. The transferred TEa cells were analyzed at 14 days post-transplantation. a, Percentage Tbx21−/− TEa and WT TEa cells within total TEa cells in indicated tissues. Flow plots are gated on TEa cells. n = 4 mice. b, Percentage Ly108loCXCR6+ cells in Tbx21−/− TEa and WT TEa cells. Flow plots are gated on WT TEa or Tbx21−/− TEa cells. n = 4 mice. c,d, Rag1−/− mice were adoptively transferred with Tbx21−/− TEa or WT TEa cells, followed by BALB/c skin transplantation. c, Experimental scheme. Created with BioRender.com. d, Percentage allograft survival. n = 5 mice per group. In a,b, data are mean ± SD, and results are representative of two independent experiments. P values are from two-tailed unpaired Student’s t-test (a,b) or log-rank test (d).
Extended Data Fig. 7 |
Extended Data Fig. 7 |. Identification of metabolic reactions that are significantly differentially active in stem-like TEP or effector CD4+ T cells.
a–c, Compass algorithm was applied to analyze the metabolic states of alloantigen-specific TEa cells, based on scRNA-seq data. a, Differential activity of 1,497 reactions (colored dots) in 79 metabolic subsystems when compared between stem-like TEP TEa and effector TEa cells. Cohen′s d was used to determine the effect sizes. b, Volcano plots illustrate the detailed P values and effect sizes for metabolic reactions in 5 indicated subsystems when compared between stem-like TEP TEa and effector TEa cells. c, Spearman correlation of Compass scores with the expression of stem-like genes or effector genes. Rows are metabolic reactions selected from 8 subsystems listed in b and Fig. 5a–c. In b, data were analyzed by two-sided Wilcoxon rank-sum tests with Benjamini–Hochberg correction for multiple comparisons.
Extended Data Fig. 8 |
Extended Data Fig. 8 |. Enhanced glycolytic metabolism in CD4+ effector T cells.
a, Gene set enrichment analysis (GSEA) of scRNA-seq data identifies 801 pathways that are differentially expressed in TEa cell clusters. The bubble plot illustrates 48 representative pathways in each TEa cell cluster. Node sizes are proportional to NES scores from GSEA. Red color indicates upregulation in one cluster when compared to all other clusters. Blue color indicates downregulation in one cluster when compared to all other clusters. Color intensities correspond to FDR adjusted P values from GSEA. b, Schematic depicting the critical enzymes that catalyze sequential reactions in glycolysis. Adapted from ‘Glycolysis and Glycolytic Enzymes’, by BioRender.com (2023). Retrieved from https://app.biorender.com/biorender-templates. Genes significantly upregulated in effector (cluster 1) versus TEP (clusters 0 and 2) TEa cells were marked in bold red font with an asterisk. c, Violin plots show the expression distributions of indicated genes (encoding glycolytic enzymes) in each TEa cell clusters. In a, data were analyzed by weighted Kolmogorov-Smirnov tests, and false discovery rates (FDR) were calculated. In c, data were analyzed by two-sided Wilcoxon rank-sum tests with Bonferroni correction for multiple comparisons.
Extended Data Fig. 9 |
Extended Data Fig. 9 |. scRNA-seq identifies LDHA as a crucial regulator of effector differentiation of TEP cells.
a–d, On day 7 post-heart transplantation, transferred WT TEa and Ldha−/− TEa cells were isolated from recipient spleens for scRNA-seq analysis. a, UMAP analysis of TEa cells, including both WT TEa and Ldha−/− TEa cells from recipient spleens. Distinct color schemes were used to identify and visually represent the eight clusters (0–7). b, Feature plots project normalized Ldha gene expression onto the UMAPs for WT TEa or Ldha−/− TEa cell population. c,d, The compass algorithm was used to assess the metabolic states of WT stem-like and Ldha−/− stem-like TEa cells. c, Differential activity of metabolic reactions (colored dots) in metabolic subsystems between WT stem-like and Ldha−/− stem-like TEa cells, with Cohen’s d determining the effect sizes. d, Volcano plots illustrate the detailed P values and effect sizes for metabolic reactions in the citric acid cycle, oxidative phosphorylation, and glutamate metabolism. In d, data were analyzed by two-sided Wilcoxon rank-sum tests with Benjamini–Hochberg correction for multiple comparisons.
Extended Data Fig. 10 |
Extended Data Fig. 10 |. LDHA governs the effector differentiation potential of CD4+ TEP cells.
a, The UMAP feature plot shows normalized Ldha expression. Cluster numbers (related to Fig. 1b) are indicated in the UMAP plot. b, Experimental scheme for Fig. 6a. c, Experimental scheme for Fig. 6b. d–h, CD45.1+ WT TEa and CD45.2+ Ldha−/− TEa cells were mixed in a 1:1 ratio, labeled with CTV, and adoptively co-transferred into Rag1−/− mice 1 d before BALB/c skin transplantation. The transferred TEa cells were analyzed by flow cytometry on day 14 post-skin transplantation. d, Experimental scheme. e, Percentage of WT TEa and Ldha−/− TEa cells among total TEa cells in dLNs and grafts. Flow plots are gated on TEa cells. n = 7 mice. f,g, Representative flow plots and bar graphs show % IFNγ+CTV (f; n = 7 mice) and T-bet+CTV (g; n = 7 mice) TEa cells among the transferred WT or Ldha−/− TEa cells in dLNs. h, Bar graphs show % TCF1CTV, Ly108CTV, CXCR6+CTV, IFNγ+CTV, and T-bet+CTV TEa cells among the transferred WT or Ldha−/− TEa cells in spleens. n = 7 mice. In b–d, experimental schemes were created with BioRender.com. In e–h, data are mean ± SD, and results are pooled from two independent experiments. P values are from two-tailed unpaired Student’s t-test (e–h).
Fig. 1 |
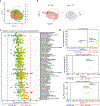
Fig. 1 |. Single-cell transcriptomics identifies alloimmune CD4+ TEP cells and effectors.
ae, CD45.2+ WT B6 mice were adoptively transferred with CD45.1+ TEa transgenic CD4+ T cells and transplanted with BALB/c hearts, followed by scRNA-seq and flow cytometric analyses of TEa cells at 7 d post-transplantation. Schematic of the experimental design (a). Created with BioRender.com. Uniform Manifold Approximation and Projection (UMAP) analysis of 10,964 single TEa cells from both spleens and allografts (b). Eight clusters (0–7) were identified and visualized with distinct color scheme. Heat map showing the expression of selected genes across all TEa cells (c). The top differentially expressed genes in the major TEP cell clusters (0 and 2) versus the major effector cell cluster 1 are shown. The blue and red color bar indicates cell origin (blue, derived from spleens (Spl); and red, derived from grafts). Normalized expression of indicated genes projected onto the UMAP (d). Frequencies of Ly108+TCF1+ and CXCR6+ cells among the transferred TEa cells in the spleens of B6 mice without transplantation (naive; Spl; n = 5 mice) or in the spleens (HTx; Spl) and the allografts (HTx; graft) of transplant recipients (n = 3 mice) (e). HTx, heart transplantation. Flow plots are gated on live TEa cells. Data are presented as mean ± s.d. (e). Results are representative of two independent experiments. P values are from a two-tailed unpaired Student’s t-test.
Fig. 2 |
Fig. 2 |. Transfer of TCF1hi CD4+ TEP cells but not TCF1CD4+ effector cells induces transplant rejection.
ac, TCF1hi or TCF1CD44+CD4+ polyclonal T cells were sorted from the secondary lymphoid organs of Tcf7GFP mice at 7 d post BALB/c heart transplantation, and adoptively transferred into Rag1−/− hosts that were transplanted with BALB/c skins 1 d later. Experimental scheme (a). Gating strategy for cell sorting (b). Percentage skin allograft survival. n = 5 mice per group (c). dg, CD45.2+ B6 mice were adoptively transferred with CD45.1+ Tcf7GFP TEa cells and transplanted with BALB/c hearts. TCF1hi or TCF1 TEa cells were isolated from the secondary lymphoid organs at 7 d post-heart transplantation, and adoptively transferred into Rag1−/− hosts that were transplanted with BALB/c skins 1 d later. Experimental scheme (d). Percentage skin allograft survival (e). n = 5 mice per group. Frequencies of the transferred TEa cells among CD45+ cells in Rag1−/− recipients at 21 d post-skin transplantation (f,g). Flow plots are gated on live CD45+ cells. n = 7 mice per group. h,i, Tcf7GFP TEa cells were adoptively transferred into WT B6 mice (recipient 1) receiving BALB/c heart transplantation. TCF1hi TEa cells from recipient 1 were transferred into Rag1−/− mice (recipient 2) receiving BALB/c skin transplantation. TCF1hi and TCF1 TEa cells from recipient 2 were transferred into new Rag1−/− hosts (recipient 3) receiving BALB/c skin transplantation. Experimental scheme (h). Percentage skin allograft survival on third recipients (i). n = 6 mice per group. Experimental schemes are created with BioRender.com (a,d,h). Data are presented as mean ± s.d. (g). Results are pooled from two independent experiments. P values are from a two-tailed unpaired Student’s t-test (g) and log-rank test (c,e,i).
Fig. 3 |
Fig. 3 |. CD4+ TEP cells function as reserve cells to replenish the effector cell pool.
ak, CD45.1+ Tcf7GFP TEa cells were adoptively transferred into Rag1−/− mice receiving BALB/c skin transplantation. TCF1hi, TCF1, Ly108hiCXCR6 and Ly108loCXCR6+ TEa cells were isolated from the secondary lymphoid organs at 14 d post-transplantation. Isolated TEa cells were either stimulated in vitro or adoptively transferred into new Rag1−/− hosts receiving BALB/c skin transplantation. Proliferation of CTV-labeled TCF1hi or TCF1 TEa cells after in vitro stimulation with CB6F1 or B6 splenocytes (a). n = 5 biologically independent replicates for TCF1hi TEa, and n = 4 for TCF1 TEa. Percentages of active caspase 3+ (b) and annexin V+ (c) in TCF1hi and TCF1 TEa cells stimulated with CB6F1 splenocytes for 3 d, with or without 30 μM Z-VAD-FMK (Z-VAD) pan-caspase inhibition. n = 4 biologically independent replicates per group. In recipient mice transferred with TCF1hi or TCF1 TEa cells, the graphs shown are percentage skin allograft survival (d; n = 7 mice for the 1 × 10⁴ TCF1hi group, and n = 4 mice for the 1 × 10⁶ TCF1 group), frequencies of TEa cells among CD45+ cells in indicated organs 14 d post-transplantation (e; n = 3 mice per group) and percentage of TCF1hi cells derived from the transferred TCF1hi TEa cells (f; n = 3 mice). dLN, draining lymph node. TCF1 expression in Ly108hiCXCR6 and Ly108loCXCR6+ TEa cells. n = 3 mice (g). MFI, mean fluorescence intensity. Proliferation of CTV-labeled Ly108hiCXCR6, Ly108loCXCR6+ or naive TEa cells after in vitro stimulation (h). n = 4 biologically independent replicates per group. In recipient mice transferred with Ly108hiCXCR6 or Ly108loCXCR6+ TEa cells, the graphs shown are percentage skin allograft survival (i; n = 6 mice for the Ly108hiCXCR6 group and n = 5 mice for the Ly108loCXCR6+ group), frequencies of TEa cells at 14 d post-transplantation (j; n = 7 mice per group), and percentages Ly108hiCXCR6 and Ly108loCXCR6+ cells derived from the transferred Ly108hiCXCR6 TEa cells (k; n = 7 mice). mLN, mesenteric lymph node. ln, CD4+ T cells from rejected human kidney allografts or PBMCs were analyzed by flow cytometry or cultured in vitro. Experimental scheme, created with BioRender.com (l). TCF1 expression in CXCR6 and CXCR6+CD4+ T cells (m). n = 3 biologically independent replicates. Proliferation of CTV-labeled CXCR6 or CXCR6+CD4+ T cells after stimulation with anti-CD3/anti-CD28 monoclonal antibodies (n). n = 3 biologically independent replicates per group. Data are presented as mean ± s.d. (ac,eh,j,k,m,n). Results are representative of two or three independent experiments (ac,eh) or pooled from two independent experiments (j,k). P values are from a two-tailed unpaired Student’s t-test (ac,eh,j,k,m,n) and log-rank test (d,i).
Fig. 4 |
Fig. 4 |. TCF1 and IRF4 control distinct stem-like features of CD4+ TEP cells.
ak, Rag1−/− recipient mice were adoptively transferred with indicated TEa cell populations 1 d before BALB/c skin transplantation. TEa cells in spleens (a,b,d,e,h,i) and allografts (f,j) were analyzed at 14 d post-transplantation. Percentages of Ly108hiCXCR6 cells derived from the co-transferred WT TEa and Tcf7−/− TEa cells (a). n = 7 mice. Percentages of Ly108hiCXCR6 cells derived from the transferred WT TEa cells transduced with mCherry alone (Ctrl-mCherry) or TCF1-mCherry (b). Flow plots are gated on mCherry+ TEa cells. n = 4 mice for the Ctrl-mCherry group and n = 3 mice for the TCF1-mCherry group. Skin allograft survival in mice transferred with WT TEa or Tcf7−/− TEa cells. n = 5 mice per group (c). Percentages of Ly108hiCXCR6 cells derived from the co-transferred WT TEa and Irf4−/− TEa cells (d). n = 6 mice. Percentages of TCF1hi cells derived from the co-transferred WT TEa and Irf4−/− TEa cells. n = 6 mice (e). Percentages of WT TEa and Irf4−/− TEa cells among total TEa cells in allografts (f). n = 6 mice. Chromatin immunoprecipitation (ChIP) analysis of H3K27me3 at the indicated regions of the Tcf7 locus in WT TEa and Irf4−/− TEa cells (g,h). UTR, untranslated region. n = 3 biologically independent replicates per group. TCF1 expression in the transferred Irf4−/− TEa cells transduced with green fluorescent protein (GFP) alone (Ctrl–GFP) or IRF4–GFP. n = 3 mice per group (i). Percentages of the transferred Irf4−/− TEa cells (Ctrl–GFP or IRF4–GFP transduced) among CD45+ cells in allografts (j). Flow plots are gated on CD45+ cells. n = 3 mice per group. Skin allograft survival in groups transferred with WT TEa (n = 6 mice), Irf4−/− TEa (n = 5 mice) or IRF4–GFP transduced Irf4−/− TEa cells (n = 5 mice) (k). Data are presented as mean ± s.d. (a,b,df,hj). Results are pooled from two independent experiments (a,df). Results are representative of two independent experiments (b,hj). P values are from a two-tailed unpaired Student’s t-test (a,b,df,hj) and log-rank test (c,k).
Fig. 5 |
Fig. 5 |. scRNA-seq identifies LDHA as a crucial regulator of effector differentiation of TEP cells.
ac, Compass algorithm was applied to determine the metabolic states of stem-like TEa cells and effector TEa cells, based on scRNA-seq data. Volcano plots illustrate the detailed P values and effect sizes for metabolic reactions in glycolysis (a), citric acid cycle (b) and fatty acid oxidation (c). df, scRNA-seq analysis of transferred WT TEa and Ldha−/− TEa cells, isolated from the spleens of heart transplant recipients 7 d post-transplantation. Split violin plots display the expression distributions of indicated stem-like genes and effector genes within each TEa cell cluster (d). The Ldha−/− and WT TEa cell populations are represented in red and green, respectively. Feature plots display the normalized Tcf7 expression in WT TEa and Ldha−/− TEa cells, projected onto the UMAP (e). The volcano plot illustrates the detailed P values and effect sizes for metabolic reactions within the glycolysis subsystem, comparing WT stem-like TEa and Ldha−/− stem-like TEa cells, analyzed by Compass algorithm (f). Data were analyzed by two-sided Wilcoxon rank-sum tests with Benjamini–Hochberg correction for multiple comparisons (ac,f).
Fig. 6 |
Fig. 6 |. LDHA governs the effector differentiation potential of CD4+ TEP cells.
a, Percentage BALB/c heart allograft survival in Ldhafl/flCd4-Cre (n = 5 mice) or Ldhafl/fl control mice (n = 6 mice). b, Percentage BALB/c skin allograft survival on Rag1−/− mice transferred with Ldha−/− TEa or WT TEa cells. n = 6 mice per group. cg, CD45.1+ WT TEa and CD45.2+ Ldha−/− TEa cells were mixed in a 1:1 ratio, labeled with CTV, and adoptively co-transferred into Rag1−/− mice 1 d before BALB/c skin transplantation. The transferred TEa cells were analyzed by flow cytometry on day 14 after skin transplantation. Representative flow plots and bar graphs show % TCF1CTV, Ly108CTV and CXCR6+CTV TEa cells among the co-transferred WT and Ldha−/− TEa cells (c). n = 7 mice. Flow plots illustrate the gating strategy for CTV+ and CTV TEa cell populations and BCL2 expression within these populations (d). BCL2 expression levels in WT TEa or Ldha−/− TEa cells, comparing CTV+ with CTV cells. n = 3 mice (e). BCL2 expression levels in CTV+ or CTV cells, comparing WT TEa with Ldha−/− TEa cells (f). n = 3 mice. Flow plots and bar graphs show % CTV active caspase 3+ TEa cells among WT TEa or Ldha−/− TEa cells (g). n = 8 mice. Data are presented as mean ± s.d. (c,eg). Results are pooled from two independent experiments (c,g) or are representative of three independent experiments (e,f). P values are from a two-tailed unpaired Student’s t-test (c,eg) and log-rank test (a,b).

References

    1. Pawlak M, Ho AW & Kuchroo VK Cytokines and transcription factors in the differentiation of CD4(+) T helper cell subsets and induction of tissue inflammation and autoimmunity. Curr. Opin. Immunol. 67, 57–67 (2020). - PMC - PubMed
    1. Ruterbusch M, Pruner KB, Shehata L & Pepper M In vivo CD4(+) T cell differentiation and function: revisiting the Th1/Th2 paradigm. Annu. Rev. Immunol. 38, 705–725 (2020). - PubMed
    1. Smith-Garvin JE, Koretzky GA & Jordan MS T cell activation. Annu. Rev. Immunol. 27, 591–619 (2009). - PMC - PubMed
    1. Schnell A et al. Stem-like intestinal Th17 cells give rise to pathogenic effector T cells during autoimmunity. Cell 184, 6281–6298 (2021). - PMC - PubMed
    1. Xia Y et al. BCL6-dependent TCF-1(+) progenitor cells maintain effector and helper CD4(+) T cell responses to persistent antigen. Immunity 55, 1200–1215 (2022). - PMC - PubMed

MeSH terms

LinkOut - more resources