. 2024 Sep;42(9):1417-1428.
doi: 10.1038/s41587-023-01978-3. Epub 2024 Jan 2.

Programmable protein expression using a genetically encoded m6A sensor

Affiliations

Programmable protein expression using a genetically encoded m6A sensor

Bahjat F Marayati et al. Nat Biotechnol. 2024 Sep.

Abstract

The N6-methyladenosine (m6A) modification is found in thousands of cellular mRNAs and is a critical regulator of gene expression and cellular physiology. m6A dysregulation contributes to several human diseases, and the m6A methyltransferase machinery has emerged as a promising therapeutic target. However, current methods for studying m6A require RNA isolation and do not provide a real-time readout of mRNA methylation in living cells. Here we present a genetically encoded m6A sensor (GEMS) technology, which couples a fluorescent signal with cellular mRNA methylation. GEMS detects changes in m6A caused by pharmacological inhibition of the m6A methyltransferase, giving it potential utility for drug discovery efforts. Additionally, GEMS can be programmed to achieve m6A-dependent delivery of custom protein payloads in cells. Thus, GEMS is a versatile platform for m6A sensing that provides both a simple readout for m6A methylation and a system for m6A-coupled protein expression.


Figures

Figure 1:
Figure 1:. Overview of the GEMS system.
Schematic illustrating the GEMS system for sensing m6A methylation. The m6A reporter mRNA is shown with a region of the m6A sensor sequence expanded. When this sequence is unmethylated, APO1-YTH does not bind to the sensor sequence and no editing takes place. As a result, EGFP-DHFR is produced and rapidly degraded (left). Methylation of either adenosine (red) in the sensor sequence results in recruitment of APO1-YTH and C-to-U editing of either or both convertible stop codons. Translation leads to EGFP production and cellular fluorescence (right).
Figure 2:
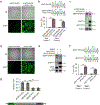
Figure 2:. GEMS depends on m6A recognition.
a. HEK293T cells were transfected with the GEMS reporter mRNA alone or the reporter mRNA together with APO1-YTH and imaged 24 h later. Cells expressing the reporter mRNA with APO1-YTH exhibit robust EGFP fluorescence, whereas cells expressing the reporter mRNA alone are dark. Scale bar: 100 μm. b. RT-PCR and Sanger sequencing of the m6A sensor sequence from cells in (a) shows C-to-U editing (C-to-T in cDNA) of the convertible stop codon cytidines (marked with an asterisk) only in the presence of APO1-YTH. Quantification of %C2U at the indicated cytidines is shown below the sequencing traces. ***p < 0.001 by two-sided Student’s t-testby two-sided Student’s are presented as mean values ± SEM. t-test, n = 3 biological replicates. All data are presented as mean values ± SEM. c. Western blot from cells in (a) indicates EGFP production from the GEMS reporter mRNA only in cells expressing APO1-YTH. d. HEK293T cells were transfected with the GEMS system containing APO1-YTH or m6A binding-deficient APO1-YTHmut and imaged after 24 h. Cells expressing APO1-YTH contain EGFP fluorescence whereas cells expressing APO1-YTHmut are dark. Scale bar: 100 μm. e. Western blot from cells in (d) indicates loss of EGFP production from the GEMS reporter mRNA when cells co-express APO1-YTHmut. f. RT-PCR and Sanger sequencing from cells in (d) shows C-to-U editing of the m6A sensor sequence only in cells co-expressing APO1-YTH. Quantification of %C2U at the indicated cytidines is shown below the sequencing traces. ***p < 0.001 by two-sided Student’s t-test, n = 3 biological replicates. All data are presented as mean values ± SEM. g. Relative m6A quantification using an RT-qPCR m6A detection approach shows similar levels of methylation of the m6A sensor sequence (GEMS GAC) and endogenous ACTB site A1222 on which the sensor sequence is based. m6A is not detected at non-consensus adenosines in the m6A sensor sequence (UAC and CAG). Dotted line at 0.5 represents the minimum cutoff value indicating the presence of m6A. Schematic below shows the presence of the indicated adenosines within the m6A sensor sequence. ***p < 0.001 by two-sided Student’s t-test, n = 3 biological replicates. All data are presented as mean values ± SEM.
Figure 3:
Figure 3:. GEMS is METTL3-dependent.
a. The GEMS system was transfected into HEK293T cells containing an auxin-inducible degron tag fused to endogenous METTL3. Addition of auxin leads to reduced EGFP fluorescence. Scale bar: 100 μm. b. Western blot confirms loss of METTL3 and EGFP following auxin treatment of cells in (a). c. Quantification of EGFP/EGFP-DHFR ratio from western blot samples in (b) shows a decrease in EGFP/EGFP-DHFR in response to auxin treatment. ***p < .001 by two-sided Student’s t-test, n = 5 biological replicates. All data are presented as mean values ± SEM. d. Sanger sequencing traces show C-to-U editing of the m6A sensor sequence in RNA extracts from cells in (a). Editing is reduced in auxin-treated cells. ***p < 0.001 by two-sided Student’s t-test, n = 3 biological replicates e. RT-qPCR quantification of m6A sensor sequence methylation decreased m6A after auxin-mediated METTL3 depletion. ***p < 0.001 by two-sided Student’s t-test, n = 3 biological replicates. All data are presented as mean values ± SEM. f. The GEMS system was transfected into HEK293T cells in the presence or absence of METTL3 overexpression. EGFP fluorescence is increased in METTL3-overexpressing cells. Scale bar: 100 μm. g. Western blot analysis shows an increase in EGFP protein expression in cells overexpressing METTL3. h. Quantification of EGFP/EGFP-DHFR ratio from western blot data indicates increased EGFP/EGFP-DHFR in METTL3-overexpressing cells. *p = 0.02 by two-sided Student’s t-test, n = 3 biological replicates. All data are presented as mean values ± SEM. i. Sanger sequencing analysis of RNA extracts from cells in (f) shows increased C-to-U editing of the m6A sensor sequence in response to METTL3 overexpression. Stop codon 1: **p = 0.007, Stop codon 2: **p = 0.009 by two-sided Student’s t-test, n = 3 biological replicates. All data are presented as mean values ± SEM. j. Correlation between the change in m6A level in the reporter mRNA and EGFP protein production (EGFP/EGFP-DHFR) in response to METTL3 overexpression. Line represents best-fit and shaded area represents 95% confidence interval around the fit. Pearson’s r = 0.971, ***p < 0.001 by two-sided Student’s t-test, n = 4 biological replicates.
Figure 4:
Figure 4:. GEMS detects differences in methylation across cell types.
a. The GEMS system containing an internal m6A-independent DsRed reporter was transfected into HEK293T, HeLa, and Huh-7 cells followed by fluorescence microscopy 24 h later. m6A-coupled EGFP fluorescence is reduced in Huh-7 cells compared to HEK293T and HeLa cells. Scale bar: 100 μm. b. Western blot analysis of cells in (a) shows decreased EGFP expression in Huh-7 cells compared to HEK293T and HeLa cells. c. Quantification of EGFP/EGFP-DHFR ratio relative to DsRed expression in HEK293T, HeLa, and Huh-7 cells. n.s.= no significant difference, ***p < 0.001 by two-sided Student’s t-test, n = 3 biological replicates. All data are presented as mean values ± SEM. d. Sanger sequencing shows C-to-U editing of the m6A sensor sequence in RNA samples from cells in (a). Huh-7 cells have reduced C-to-U editing compared to HEK293T and HeLa cells. Quantification of %C-to-U is shown on the right. ***p < 0.001 by two-sided Student’s t-test, n = 3 biological replicates. All data are presented as mean values ± SEM. e. Mass spectrometry was used to quantify m6A in purified mRNA from HEK29T, HeLa, and Huh-7 cells. n = 2 biological replicates per cell line. All data are presented as mean values.
Figure 5:
Figure 5:. GEMS senses changes in m6A caused by small molecule inhibition of METTL3.
a. EGFP fluorescence from the GEMS system is reduced in HEK293T cells treated with the METTL3 inhibitor STM2457. GEMS-expressing cells were treated with 30 μM STM2457 for 24 h. Scale bar: 100 μm. b. Quantitative microscopy was performed on HEK293T cells expressing the GEMS system and treated with 30 μM STM2457. Treatment with STM2457 shows a significant reduction in EGFP fluorescence intensity. ***p < 0.001 by two-sided Student’s t-test, Single dot represents individual cells (DMSO: n = 777 cells; STM2457: n = 796 cells). Boxes span the interquartile range (25th to 75th percentile); horizontal lines indicate the median (50th percentile); whiskers extend to minima and maxima. EGFP signal in each cell was normalized to DsRed. c. Western blot shows decreased EGFP protein in STM2457-treated cells. d. Densitometry analysis indicates reduced EGFP/EGFP-DHFR ratio in cells treated with 30 μM STM2457 for 24 h. ***p <0.001 by two-sided Student’s t-test, n = 3 biological replicates. All data are presented as mean values ± SEM. e. Sanger sequencing of the m6A sensor sequence in RNA samples from cells in (a) shows reduced C-to-U editing in cells treated with STM2457. Quantification of %C-to-U is shown on the right. ***p <0.001 by two-sided Student’s t-test, n = 3 biological replicates. All data are presented as mean values ± SEM. f. RT-qPCR-based m6A detection was used to quantify relative m6A levels of endogenous ACTB A1222 and the m6A sensor sequence. STM2457 treatment leads to similar reductions in m6A in endogenous ACTB and the m6A sensor sequence. ***p < 0.001 by two-sided Student’s t-test, n = 3 biological replicates. All data are presented as mean values ± SEM.
Figure 6:
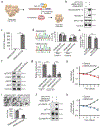
Figure 6:. m6A-coupled effector protein delivery counteracts the effects of m6A hypermethylation in cancer cells.
a. Schematic showing m6A-coupled expression of a tumor suppressor protein to counteract the effects of m6A hypermethylation in cancer cells. b. GEMS was used to deliver either EGFP (GEMS-EGFP) or SOCS2 (GEMS-SOCS2) into Huh-7 cells. Western blot indicates robust expression of SOCS2 in cells expressing GEMS-SOCS2. c. RT-qPCR shows SOCS2 coding sequence expression in Huh-7 cells transfected with GEMS-SOCS2. ***p < 0.001 by two-sided Student’s t-test, n = 3 biological replicates. All data are presented as mean values ± SEM. d. Sanger sequencing of the m6A sensor sequence from cells in (b) indicates similar C-to-U editing rates of the GEMS-EGFP and GEMS-SOCS2 mRNAs. n.s. = no significant difference by two-sided Student’s t-test, n = 3 biological replicates. All data are presented as mean values ± SEM. e. Quantification of EGFP/EGFP-DHFR ratio and SOCS2/SOCS2-DHFR ratio from western blot data from cells expressing GEMS-EGFP or GEMS-SOCS2 indicates similar ratios. n.s. = no significant difference by two-sided Student’s t-test, n = 3 biological replicates. All data are presented as mean values ± SEM. f. Western blot analysis of downstream SOCS2 targets shows a decrease in STAT5 and JAK2 phosphorylation in Huh-7 cells expressing GEMS-SOCS2. g. RT-qPCR shows reduced expression of SOCS2 target mRNAs IGF1 and CyclinD1 in Huh-7 cells expressing GEMS-SOCS2. ***p < 0.001 by two-sided Student’s t-test, n = 3 biological replicates. All data are presented as mean values ± SEM. h. Cell growth assays show reduced growth of Huh-7 cells transfected with GEMS-SOCS2 compared to non-transfected cells (Control). Growth curves for both were normalized to cells expressing GEMS-EGFP. ***p < 0.001 by two-sided Student’s t-test, n = 3 biological replicates. All data are presented as mean values ± SEM. i. Huh-7 cell migration is diminished following expression of GEMS-SOCS2 compared to GEMS-EGFP. ***p < 0.001 by two-sided Student’s t-test, n = 3 biological replicates. All data are presented as mean values ± SEM. Scale bar: 100 μm. j. Western blot shows elevated p53 levels in Huh-7 cells expressing GEMS-p53 compared to GEMS-EGFP. Top panel shows brightfield images of cells migration, bottom panel shows quantification of the total number of cells migrated. ***p < 0.001 by two-sided Student’s t-test, n = 3 biological replicates. k. Cell growth is reduced in Huh-7 cells transfected with GEMS-p53 compared to non-transfected cells (Control). Growth curves for both were normalized to cells expressing GEMS-EGFP. ***p < 0.001 by two-sided Student’s t-test, n = 3 biological replicates. All data are presented as mean values ± SEM.

References

    1. Zaccara S, Ries RJ, and Jaffrey SR. (2019). Reading, writing and erasing mRNA methylation. Nat. Rev. Mol. Cell Biol. 20. 10.1038/s41580-019-0168-5. - DOI - PubMed
    1. Shi H, Wei J, and He C. (2019). Where, When, and How: Context-Dependent Functions of RNA Methylation Writers, Readers, and Erasers. Mol. Cell 74. 10.1016/j.molcel.2019.04.025. - DOI - PMC - PubMed
    1. Meyer KD, Saletore Y, Zumbo P, Elemento O, Mason CE, and Jaffrey SR. (2012). Comprehensive analysis of mRNA methylation reveals enrichment in 3′ UTRs and near stop codons. Cell. 10.1016/j.cell.2012.05.003. - DOI - PMC - PubMed
    1. Dominissini D, Moshitch-Moshkovitz S, Schwartz S, Salmon-Divon M, Ungar L, Osenberg S, Cesarkas K, Jacob-Hirsch J, Amariglio N, Kupiec M, et al. (2012). Topology of the human and mouse m6A RNA methylomes revealed by m6A-seq. Nature. 10.1038/nature11112. - DOI - PubMed
    1. Flamand MN, and Meyer KD. (2019). The epitranscriptome and synaptic plasticity. Curr. Opin. Neurobiol. 10.1016/j.conb.2019.04.007. - DOI - PMC - PubMed

Methods-only References

    1. Abràmoff MD, Magalhães PJ, and Ram SJ. (2004). Image processing with image J. Biophotonics Int. 11. 10.1201/9781420005615.ax4. - DOI
    1. Kluesner MG, Nedveck DA, Lahr WS, Garbe JR, Abrahante JE, Webber BR, and Moriarity BS. (2018). EditR: a method to quantify base editing from Sanger sequencing. Cris. J. 1, 239–250. - PMC - PubMed
    1. Kuchipudi SV, Tellabati M, Nelli RK, White GA, Perez BB, Sebastian S, Slomka MJ, Brookes SM, Brown IH, Dunham SP, et al. (2012). 18S rRNA is a reliable normalisation gene for real time PCR based on influenza virus infected cells. Virol. J. 9. 10.1186/1743-422X-9-230. - DOI - PMC - PubMed

LinkOut - more resources