. 2024 Sep;42(9):1378-1383.
doi: 10.1038/s41587-023-01983-6. Epub 2024 Jan 2.

High-quality metagenome assembly from long accurate reads with metaMDBG

Affiliations

High-quality metagenome assembly from long accurate reads with metaMDBG

Gaëtan Benoit et al. Nat Biotechnol. 2024 Sep.

Abstract

We introduce metaMDBG, a metagenomics assembler for PacBio HiFi reads. MetaMDBG combines a de Bruijn graph assembly in a minimizer space with an iterative assembly over sequences of minimizers to address variations in genome coverage depth and an abundance-based filtering strategy to simplify strain complexity. For complex communities, we obtained up to twice as many high-quality circularized prokaryotic metagenome-assembled genomes as existing methods and had better recovery of viruses and plasmids.


Conflict of interest statement

The authors declare no competing interests.

Figures
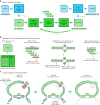
Fig. 1
Fig. 1. Overview of the algorithmic steps of metaMDBG.
a, Overview of the multi-k assembly strategy. Processes in blue are performed at the level of nucleotide sequences and those in green are performed only at the level of minimizers. b, Components for estimating and refining k-min-mer abundance as k is increased and for filtering errors before graph construction. c, Illustration of the 'local progressive abundance filter' algorithm that simplifies complex graph regions generated by errors, inter-genomic repeats and strain variability. Each node represents a unitig (unitigs in green and blue belong to two distinct species and unitigs in red represent errors). The long unitig (with abundance = 4) is chosen as the seed (step c.1). Its abundance is used as a reference to apply a 'local progressive abundance filter' from 1× to 0.5× its abundance (steps c.2 and c.3). At each step, unitigs with abundance equal to the cutoff value are removed and the graph is re-compacted to simplify fragmented unitigs. Note that fragmented green unitigs with abundance = 2 would have been removed without the intermediate step c.2.
Fig. 2
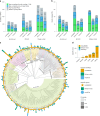
Fig. 2. Assembly results on three HiFi PacBio metagenomic projects.
a, CheckM evaluation. A MAG is considered 'near-complete' if its completeness is ≥90% and contamination is ≤5%; 'high quality' if its completeness is ≥70% and contamination is ≤10%; and 'medium quality' if its completeness is ≥50% and contamination is ≤10%. b, The percentage of mapped HiFi reads on MAGs. c, Phylogenetic tree of genera recovered from the AD-HiFi data set for all assemblers combined. For the near-complete bacterial MAGs, we generated a de novo phylogenetic tree based on GTDB-Tk marker genes, displayed at the genus level. The outer bar charts give the number of MAGs found in each genus. The colored symbols then denote genera recovered by only one of the assemblers. The grayscale heat map illustrates the aggregate abundance of dereplicated MAGs in a genus. d, Number of taxa at different levels that are unique to each assembler.
Extended Data Fig. 1
Extended Data Fig. 1. Number of contigs required to cover a near-complete circular MAG reconstructed successfully by an alternative assembler.
In order to estimate the degree of fragmentation of assemblers, we aligned the contigs of one assembler against the near-complete circular contigs (cMAGs) recovered by the other assemblers. The fragmentation is then represented as the number of contigs required to cover these cMAGs (see section ‘Assessment of completeness and fragmentation of assemblies using reference sequences’ for details). The boxplot elements are the median (horizontal bar), 25th and 75th percentiles (box limits Q1 and Q3), Q1-1.5*IQR and Q3+1.5*IQR (whiskers, IQR=Q3-Q1) and outliers. Summary statistics (n, min, median, mean, max): Human gut- metaMDBG (19, 1, 2, 2.1, 5); hifiasm-meta (32, 1, 2, 4, 24); metaFlye (68, 1, 4, 7.5, 48) : AD-HiFi- metaMDBG (11, 1, 2, 2.3, 6); hifiasm-meta (72, 1, 6, 19.8, 109); metaFlye (105, 1, 6, 15.1, 104) : Sheep rumen- metaMDBG (15, 1, 1, 1.8, 8); hifiasm-meta (18, 1, 3, 10.7, 125); metaFlye (183, 1, 3, 5, 37). The data to generate this boxplot have been extracted from Supplementary Table S5.
Extended Data Fig. 2
Extended Data Fig. 2. Histograms of SNV density and coverage depths for near-complete circular contigs.
SNV densities (A) and coverage depths (B) are shown for all the near-complete circular contigs (see definition in text) aggregated across the three HiFi PacBio datasets (Human gut, AD-HiFi, Sheep Rumen) for each assembler (metaMDBG, hifiasm-meta, metaFlye).
Extended Data Fig. 3
Extended Data Fig. 3. Number of contigs in non-circular near-complete MAGs.
The boxplot elements are the median (horizontal bar), 25th and 75th percentiles (box limits Q1 and Q3), Q1-1.5*IQR and Q3+1.5*IQR (whiskers, IQR=Q3-Q1) and outliers. Summary statistics (n, min, median, mean, max): Human gut- metaMDBG (90, 1, 4, 6.8, 53); hifiasm-meta (67, 1, 3, 3.1, 13); metaFlye (65, 1, 3, 4.6, 19) : AD-HiFi- metaMDBG (174, 1, 4, 9.2, 138); hifiasm-meta (47, 1, 2, 3.6, 20); metaFlye (107, 1, 5, 7, 35) : Sheep rumen-metaMDBG (181, 1, 2, 3.3, 22); hifiasm-meta (137, 1, 1, 1.5, 9); metaFlye (186, 1, 2, 2.8, 22). The data to generate this boxplot have been extracted from Supplementary Table S5.
Extended Data Fig. 4
Extended Data Fig. 4. Number of low-coverage non-circular near-complete MAGs recovered by the assemblers.
For the three tested PacBio HiFi datasets, we show the number of non-circular near-complete MAGs with low coverage ( < 12x) reconstructed by each assembler.
Extended Data Fig. 5
Extended Data Fig. 5. Total number of near-complete MAGs (circular and non-circular) across different dereplication thresholds.
We used dRep to cluster MAGs by nucleotide similarity using the parameter -sa from 0.95 to 1. This Figure shows for each assembler on each data set, how the number of dereplicated near-complete MAG clusters, both circular and non-circular, collapses as they are dereplicated at decreasing levels of nucleotide similarity. In the Sheep rumen and Human gut data sets, the number of dereplicated MAG clusters from hifiasm-meta drops significantly below a 97% ANI dereplication threshold, this is not observed for metaMDBG or metaFlye, which indicates that a greater proportion of the hifiasm-meta MAG diversity is at the strain-level. This is not the case for the AD-HiFi data set where no assembler seems to generate a substantial number of strains with more than 97% ANI.

Update of

References

    1. Quince, C., Walker, A. W., Simpson, J. T., Loman, N. J. & Segata, N. Shotgun metagenomics, from sampling to analysis. Nat. Biotechnol.35, 833–844 (2017). 10.1038/nbt.3935 - DOI - PubMed
    1. The Human Microbiome Project Consortium. A framework for human microbiome research. Nature486, 215–221 (2012). 10.1038/nature11209 - DOI - PMC - PubMed
    1. Edgar, R. C. et al. Petabase-scale sequence alignment catalyses viral discovery. Nature602, 142–147 (2022). 10.1038/s41586-021-04332-2 - DOI - PubMed
    1. Quince, C. et al. STRONG: metagenomics strain resolution on assembly graphs. Genome Biol.22, 214 (2021). 10.1186/s13059-021-02419-7 - DOI - PMC - PubMed
    1. Vicedomini, R., Quince, C., Darling, A. E. & Chikhi, R. Strainberry: automated strain separation in low-complexity metagenomes using long reads. Nat. Commun.12, 4485 (2021). 10.1038/s41467-021-24515-9 - DOI - PMC - PubMed

LinkOut - more resources